Abstract
Current methods can illuminate the genome-wide activity of CRISPR-Cas9 nucleases, but are not easily scalable to the throughput needed to fully understand the principles that govern Cas9 specificity. Here we describe ‘circularization for high-throughput analysis of nuclease genome-wide effects by sequencing’ (CHANGE-seq), a scalable, automatable tagmentation-based method for measuring the genome-wide activity of Cas9 in vitro. We applied CHANGE-seq to 110 sgRNA targets across 13 therapeutically relevant loci in human primary T-cells and identified 201,934 off-target sites, enabling the training of a machine learning model to predict off-target activity. Comparing matched genome-wide off-target, chromatin modification and accessibility, and transcriptional data, we found that cellular off-target activity was two to four times more likely to occur near active promoters, enhancers, and transcribed regions. Finally, CHANGE-seq analysis of 6 targets across 8 individual genomes revealed that human single-nucleotide variation had significant effects on activity at ~15.2% of off-target sites analyzed. CHANGE-seq is a simplified, sensitive, and scalable approach to understanding the specificity of genome editors.
CRISPR-Cas genome-editing nucleases are transformative technologies for biological research and human medicine because of the simplicity with which they can be programmed to modify the genomes of living cells. In particular, Cas9 from S. pyogenes has been broadly adopted as an easily programmable genome editor, comprised of Cas9 protein and an associated single guide RNA (sgRNA), that can recognize and cut a specified 20-bp target sequence (protospacer) next to an NGG protospacer adjacent motif (PAM)1–3.
An important application of genome editing is towards development of curative cell-based genetic therapies. However, promising editing strategies (such as engineering human T-cells for cancer immunotherapies4) typically demand modification of hundreds of millions of cells and the risk of introducing nuclease-induced oncogenic off-target mutations remains a key concern. The reality of this concern stems from earlier gene therapy trials where use of γ-retroviral vectors for treatment of X-linked severe combined immunodeficiency led to T-cell leukemia in several young patients5. Although protein or sgRNA engineering and other strategies can minimize ‘detectable’ off-target mutations6–10, it remains essential to experimentally define the genome-wide activity of genome editors.
In spite of broad adoption of Cas9 for genome editing, general principles that explain genome-wide off-target activity11–17 remain largely unknown. We and others have described several cellular12,18–23 and in vitro24–27 methods to define the genome-wide activity of genome editors, but they are not scalable to the number of sites required to learn basic principles. Cellular methods such as GUIDE-seq12 are difficult to scale because they require individual transfections for each target or cell source and are not as sensitive as in vitro methods. CIRCLE-seq26,27, a highly sensitive in vitro method we developed to selectively sequence Cas9-cleaved genomic DNA, is based on the principle of detecting newly cut DNA ends from purified circularized genomic DNA treated with Cas9. However, CIRCLE-seq is labor-intensive and requires multiple reactions to process the relatively high amounts of genomic DNA required for a single analysis, making it impractical to analyze large numbers of targets in parallel.
Here we present CHANGE-seq, a high-throughput method for defining the genome-wide activities of CRISPR-Cas9 nucleases in vitro. CHANGE-seq leverages a new Tn5 tagmentation-based workflow we developed to efficiently generate circularized genomic DNA libraries for defining the genome-wide activity of genome editors. Using human primary T-cells, we apply our approach to generate large-scale datasets to define fundamental principles of Cas9 activity genome-wide, train machine learning models to predict off-target site activity, select highly specific target sites, identify chromatin signatures associated with off-target mutagenesis, and measure the impact of human genetic variation on Cas9 nuclease activity.
Results
Development of a high-throughput method to measure Cas9 genome-wide activity
We sought to develop a high-throughput in vitro method for defining the genome-wide activity of genome editors with the following ideal characteristics: 1) easy to practice, 2) high enrichment efficiency, 3) high scalability, 4) low genomic DNA input requirements, and 5) high sensitivity. We reasoned that use of Tn528,29, a transposase enzyme widely used in genomic assays30 for simultaneous in vitro DNA transposition and fragmentation (tagmentation), could enable the rapid generation of circularized genomic DNA libraries with minimal free ends. The mechanism of Tn5 tagmentation would ensure that both ends of tagmented DNA molecules contain required sequences for circularization by intramolecular ligation. Treatment of enzymatically purified circularized genomic DNA with Cas9 nuclease would enable detection of newly cut and linearized DNA ends by adapter ligation, PCR amplification, and high-throughput sequencing.
We designed and extensively optimized a Tn5-based protocol for defining the genome-wide activity of CRISPR-Cas9 nucleases (Fig. 1a, Extended Data Figure 1, Supplementary Figure 1), using a custom Tn5 transposome to randomly integrate adapter sequences for genomic DNA circularization (Fig. 1b). We analyzed a well-characterized benchmark target using 42 conditions across 19 high-throughput sequencing runs to optimize multiple steps including DNA gap-repair, DNA purification, exonuclease and proteinase K treatment (Fig. 1c, Supplementary Note, Supplementary Table 1). After overcoming major bottlenecks at stages including tagmentation and gap-repair, we called the optimized protocol circularization for high-throughput analysis of nuclease genome-wide effects by sequencing or CHANGE-seq and used it for all subsequent experiments (Supplementary Protocol). We confirmed that CHANGE-seq produces circular genomic DNA molecules without detectable linear DNA by direct visualization with atomic force microscopy (Fig. 1d). Overall, CHANGE-seq reduces genomic DNA input requirements by approximately 5-fold, the number of reactions per sample by 10- to 20-fold (by avoiding requirements for exonuclease treatments that required splitting samples into multiple reactions), eliminates the need for specialized equipment for DNA shearing, and greatly reduces the number of processing steps, time, and cost relative to CIRCLE-seq (Extended Data Figure 2).
Fig. 1 |. Development and optimization of CHANGE-seq.
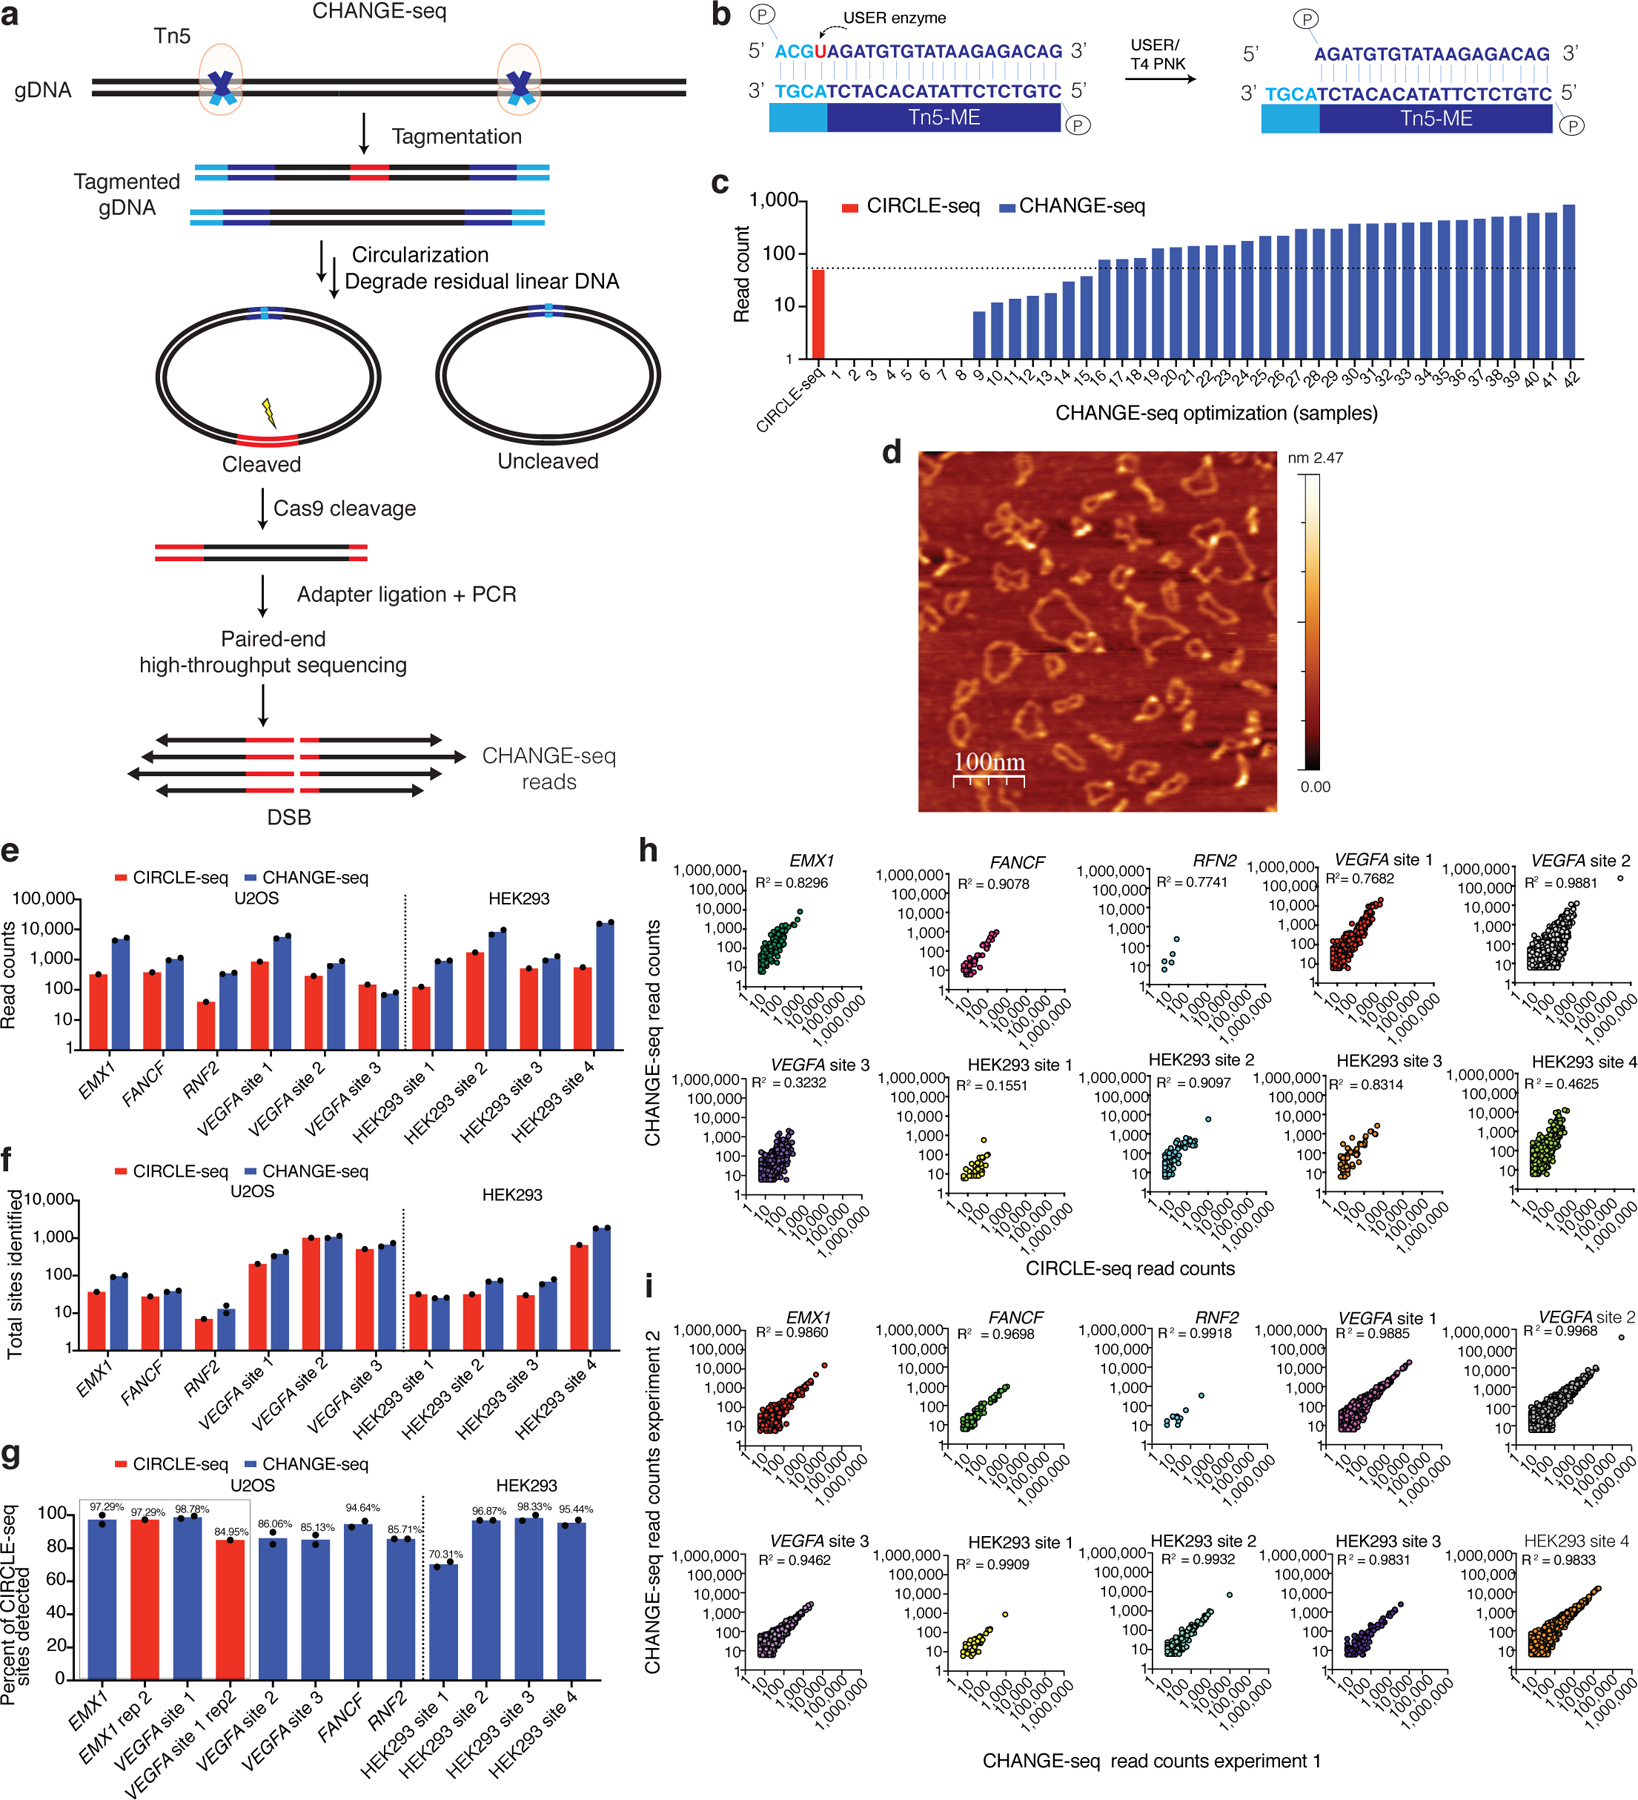
a, Schematic overview of CHANGE-seq workflow. Genomic DNA is tagmented using a custom Tn5-transposome, circularized by low-concentration intramolecular ligation and residual linear DNA molecules are degraded by treatment with a mixture of exonucleases. Upon treatment with Cas9, circularized DNA molecules containing Cas9 on- and off-target sites are subsequently linearized, releasing newly cleaved DNA ends for adapter ligation, PCR amplification and paired-end high-throughput sequencing. b, The custom Tn5 transposon sequence for circularization is comprised of 19 -base pairs required for transposition (Tn5-ME) and 4 palindromic -base pairs containing a uracil for subsequent overhang generation. c, Plot of on-target read count enrichment during development of CHANGE-seq protocol (blue) compared to CIRCLE-seq (red), for benchmark sgRNA targeting EMX1. All libraries sampled to the same sequence depth for comparisons. Optimization sample descriptions listed in Supplementary Table 1. d, Direct visualization of genomic DNA circles produced by CHANGE-seq by atomic force microscopy (scale in nm). Signal intensity indicates the relative height of the AFM probe passing over DNA molecules on the slide surface. This experiment was repeated two times with similar results. e, Barplot of on-target site read count enrichment for 10 target sites evaluated by CIRCLE-seq (red, n=1) and CHANGE-seq (blue, n=2). CHANGE-seq enrichment ranged from 2- to 30-fold compared to CIRCLE-seq. f, Barplot showing number of sites detected by CHANGE-seq (n=2) was comparable or higher than CIRCLE-seq (n=1) for most of the targets. g, Barplot showing proportion of CIRCLE-seq (n=1) sites identified by CHANGE-seq (n=2). The bars highlighted in red indicate two target sites with available published CIRCLE-seq technical replicates, where the percent of CIRCLE-seq sites detected by CHANGE-seq was greater than or equal to that of CIRCLE-seq technical replicates. Read count detection threshold set at 18 for all samples to minimize sampling artifacts. h, Scatterplots of CIRCLE-seq and CHANGE-seq read counts (log scale) from experiments performed on the same cellular source of genomic DNA. i, Scatterplots of CHANGE-seq read counts (log scale) between two CHANGE-seq libraries independently prepared from the same source of genomic DNA for 10 target sites, showing that CHANGE-seq is highly reproducible. (h-i) Correlation between two samples was calculated using Pearson’s correlation coefficient.
To directly compare the performance of CHANGE-seq with CIRCLE-seq, we analyzed 10 SpCas9 target sites that we had previously characterized with CIRCLE-seq26, sampling all high-throughput sequencing libraries to the same sequencing depth and applying the same read count threshold for analysis. For 9 of 10 sites, CHANGE-seq on-target read counts and the number of sites detected were greater than or equal to CIRCLE-seq (Figs. 1e, 1f). The percentage of sites detected by both CIRCLE-seq and CHANGE-seq, at a fixed read count threshold chosen to minimize sampling artifacts, ranged from 70.3% to 97.3%. Notably, at two sites with available published CIRCLE-seq technical replicates, the percentage of CIRCLE-seq sites detected by CHANGE-seq was greater than or equal to CIRCLE-seq technical replicates (Fig. 1g). CHANGE-seq and CIRCLE-seq read counts were strongly correlated at most targets evaluated; as expected, the best correlations were observed against CIRCLE-seq runs sequenced sufficiently to achieve high on-target read counts and better dynamic range (Fig. 1h). For each of the 10 SpCas9 targets, we performed independent CHANGE-seq library preparations and found that read counts of the replicates were strongly correlated (R2>0.9) (Fig. 1i).
Next, we compared CHANGE-seq with published GUIDE-seq data for the same 10 target sites and found for most sgRNAs CHANGE-seq identified all or nearly all off-target sites identified by GUIDE-seq (Extended Data Figure 3). Additionally, we adapted and optimized CHANGE-seq for an automated liquid handling platform (Supplementary Note), contributing to the potential for high-throughput applications. Taken together, our results show that CHANGE-seq is highly reproducible, automation-compatible, and more sequencing-efficient than CIRCLE-seq.
High-throughput Cas9 genome-wide activity profiling
To systematically evaluate the genome-wide activity of Cas9, we designed 110 sgRNAs targeted to nonrepetitive sites across 13 therapeutically important loci in human primary CD4+/CD8+T-cells obtained from a healthy adult donor. We targeted sites in the early coding exons of (1) safe harbor locus AAVS1; (2) immune suppressive checkpoint genes PDCD1, LAG3, FAS, CTLA4, CBLB and PTPN6; (3) alloreactive genes B2M and TRBC1; (4) T-cell receptor alpha constant (TRAC) locus; (5) HIV co-receptor genes CCR5 and CXCR4; and (6) autoimmunity related gene PTPN2. Prior to performing CHANGE-seq, we validated in vitro cleavage activity of all sgRNAs (Supplementary Figure 2, Supplementary Table 2). We used enzymatically in vitro transcribed sgRNAs rather than their chemically synthesized counterparts to avoid manufacturer-specific truncated synthesis artifacts.
For the 110 targets, using CHANGE-seq, we identified a total of 202,043 unique on- and off-target sites across the genome (Fig. 2a, Supplementary Figure 3) with variable numbers of off-target sites ranging from 19 to 61,415 for individual sgRNAs (Fig. 2b, Supplementary Table 3). CHANGE-seq specificity ratio, defined as the sum of on-target reads divided by the sum of on-target and off-target reads, is usually, but not always, associated with the total number of sites detected (Fig. 2c, Supplementary Table 4), and can identify high-specificity target sites.
Fig. 2 |. High-throughput CHANGE-seq profiling of 110 therapeutic target sites reveals target site factors that affect Cas9 genome-wide specificity.
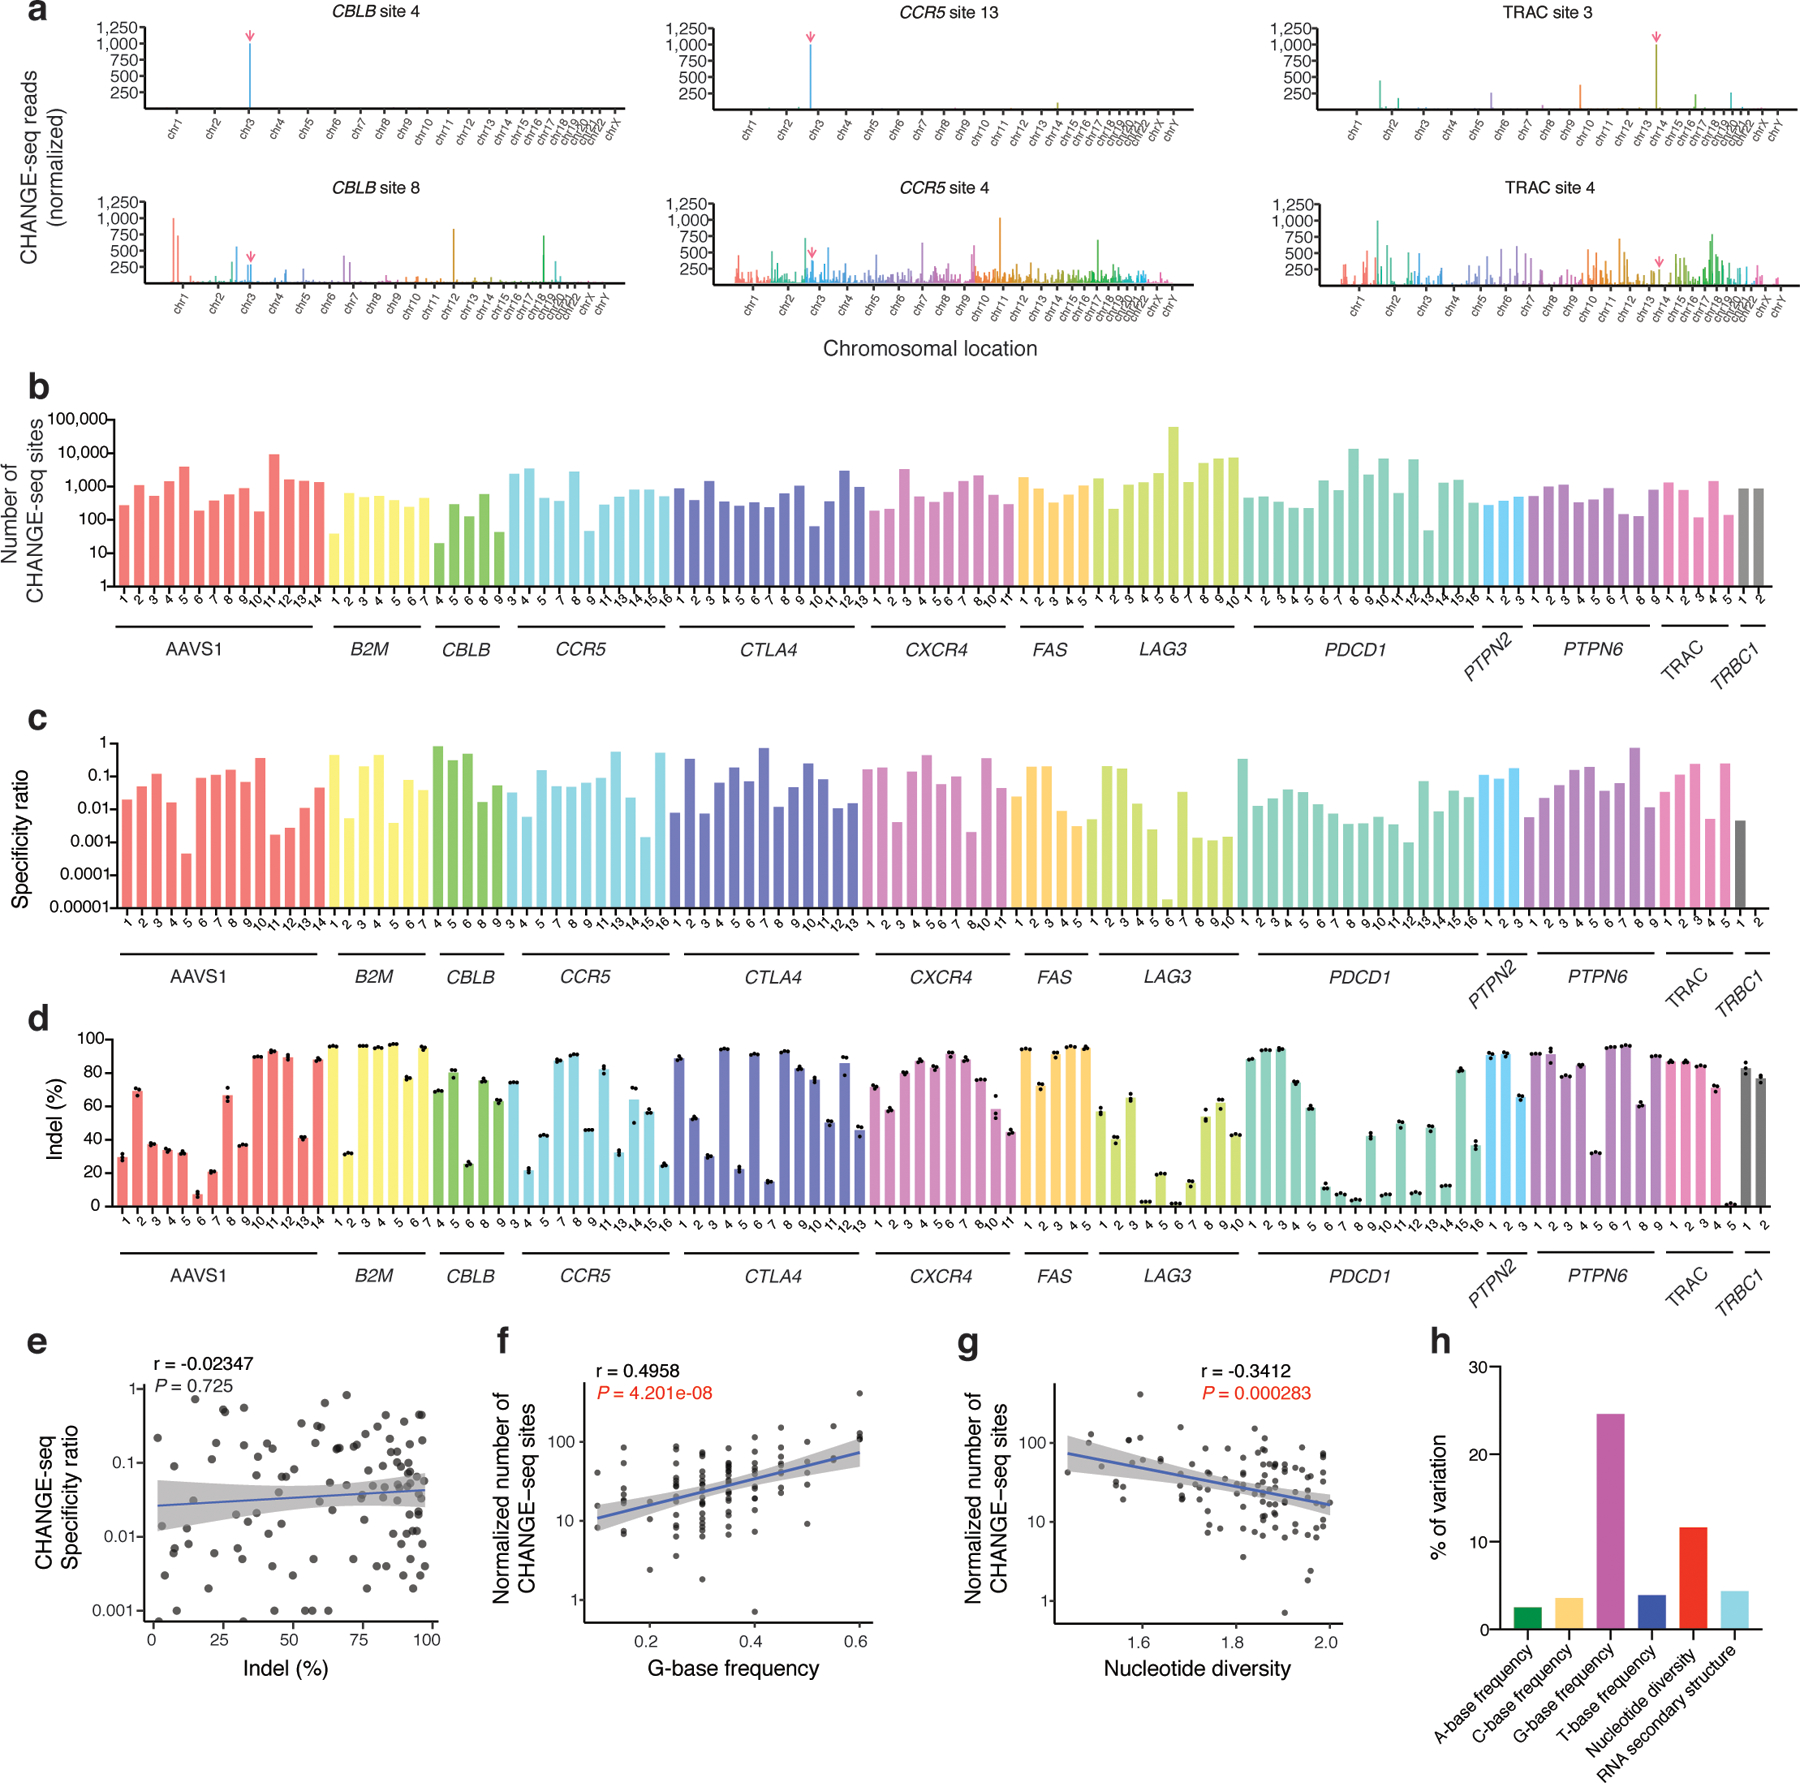
a, Manhattan plots of CHANGE-seq detected on- and off-target sites organized by chromosomal position with bar heights representing normalized CHANGE-seq read count. The on-target site is indicated with a red arrow. Examples of target sites with specific (top) and promiscuous (bottom) activity shown for the same locus. b, Barplot of number of CHANGE-seq sites detected for 110 sgRNAs designed toward nonrepetitive target sites across 13 loci in human primary CD4+/CD8+ T-cells (log scale) (n=1). c, Barplot of specificity ratio showing relative specificity of sites (log scale). d, Barplot of indel mutation frequencies for 110 intended target sites measured 3 days post nucleofection with Cas9:sgRNA RNPs (n=3). e, Scatterplot showing correlation of indel frequency at the intended target sites with CHANGE-seq specificity ratio. f, Scatterplot showing correlation of G-base frequency with normalized number of CHANGE-seq detected sites (adjusted by number of homologous genomic sites) (log scale). g, Scatterplot showing correlation of nucleotide diversity with normalized number of CHANGE-seq detected sites (adjusted by number of homologous sites) (log scale). (e-g). Correlation between two samples was calculated using Pearson’s correlation coefficient and two-tailed P value. h, Variance in number of sites detected by CHANGE-seq explained by target site A-frequency, C-frequency, G-frequency, T-frequency, nucleotide diversity and RNA-secondary structure.
To assess whether Cas9 cellular on-target activity is intrinsically linked to specificity, we measured indel mutation frequencies induced by Cas9 RNPs targeted to the same 110 target sites in human primary CD4+/CD8+T-cells (Fig. 2d, Supplementary Table 5). Although we observed a broad range of activity (1.5% - 97.2%, mean of 62.1%), we did not detect a correlation between on-target activity and off-target activity (Fig. 2e), suggesting that it is possible to identify sgRNA targets with ideal characteristics of both high activity and specificity.
To our knowledge, this Cas9 genome-wide nuclease activity dataset is the largest generated to date, with 10-fold more targets and off-target sites than earlier studies12,19–21,26, made possible only by the scalability of CHANGE-seq. As factors that affect the genome-wide activity of Cas9 remain not well understood, next, we analyzed our unique large-scale genome-wide activity dataset to understand whether specific sequence characteristics and positions are associated with off-target activity.
Target and off-target sequence factors that affect Cas9 activity
First, we investigated whether sgRNA target base frequency, target site nucleotide diversity (quantified by Shannon entropy index, a measure of information content), or RNA secondary structure are associated with Cas9 genome-wide nuclease activity. Notably, we found that G-base frequency and nucleotide diversity in the target site are significantly associated with the number of off-target sites detected (Fig. 2f, g) and explain 24% and 11% of the variation in number of sites detected, respectively (Fig. 2h), in univariate analyses. These simple measures may be useful for predicting which Cas9 targets are the most specific.
Next, to understand factors that influence Cas9 activity at individual off-target sites, we analyzed the effect of mismatch number, position, base, and the precise combination of on-target and off-target base on CHANGE-seq read counts at 202,043 on-target and off-target sites. As expected, on average, off-target sites with increasing numbers of mismatches were identified with lower CHANGE-seq read counts (Fig. 3a). At off-target sites genome-wide, canonical NGG PAMs are cleaved with the highest average frequency, followed by NAG, NGA, and NTG (Fig. 3b). By comparing mismatch frequencies observed at CHANGE-seq detected off-target sites versus homologous genomic sites, we found that mismatches are less tolerated closer to the PAM, with A-base mismatches on the non-target strand best tolerated for off-target activity (Fig. 3c). When examining this phenomenon in greater detail, we found that specifically G>A mismatches, consistent with rG:dT wobble base pairings, were best tolerated at off-target sites (Fig. 3d).
Fig. 3 |. Machine learning from large-scale CHANGE-seq datasets illuminates important predictors of off-target site activity.
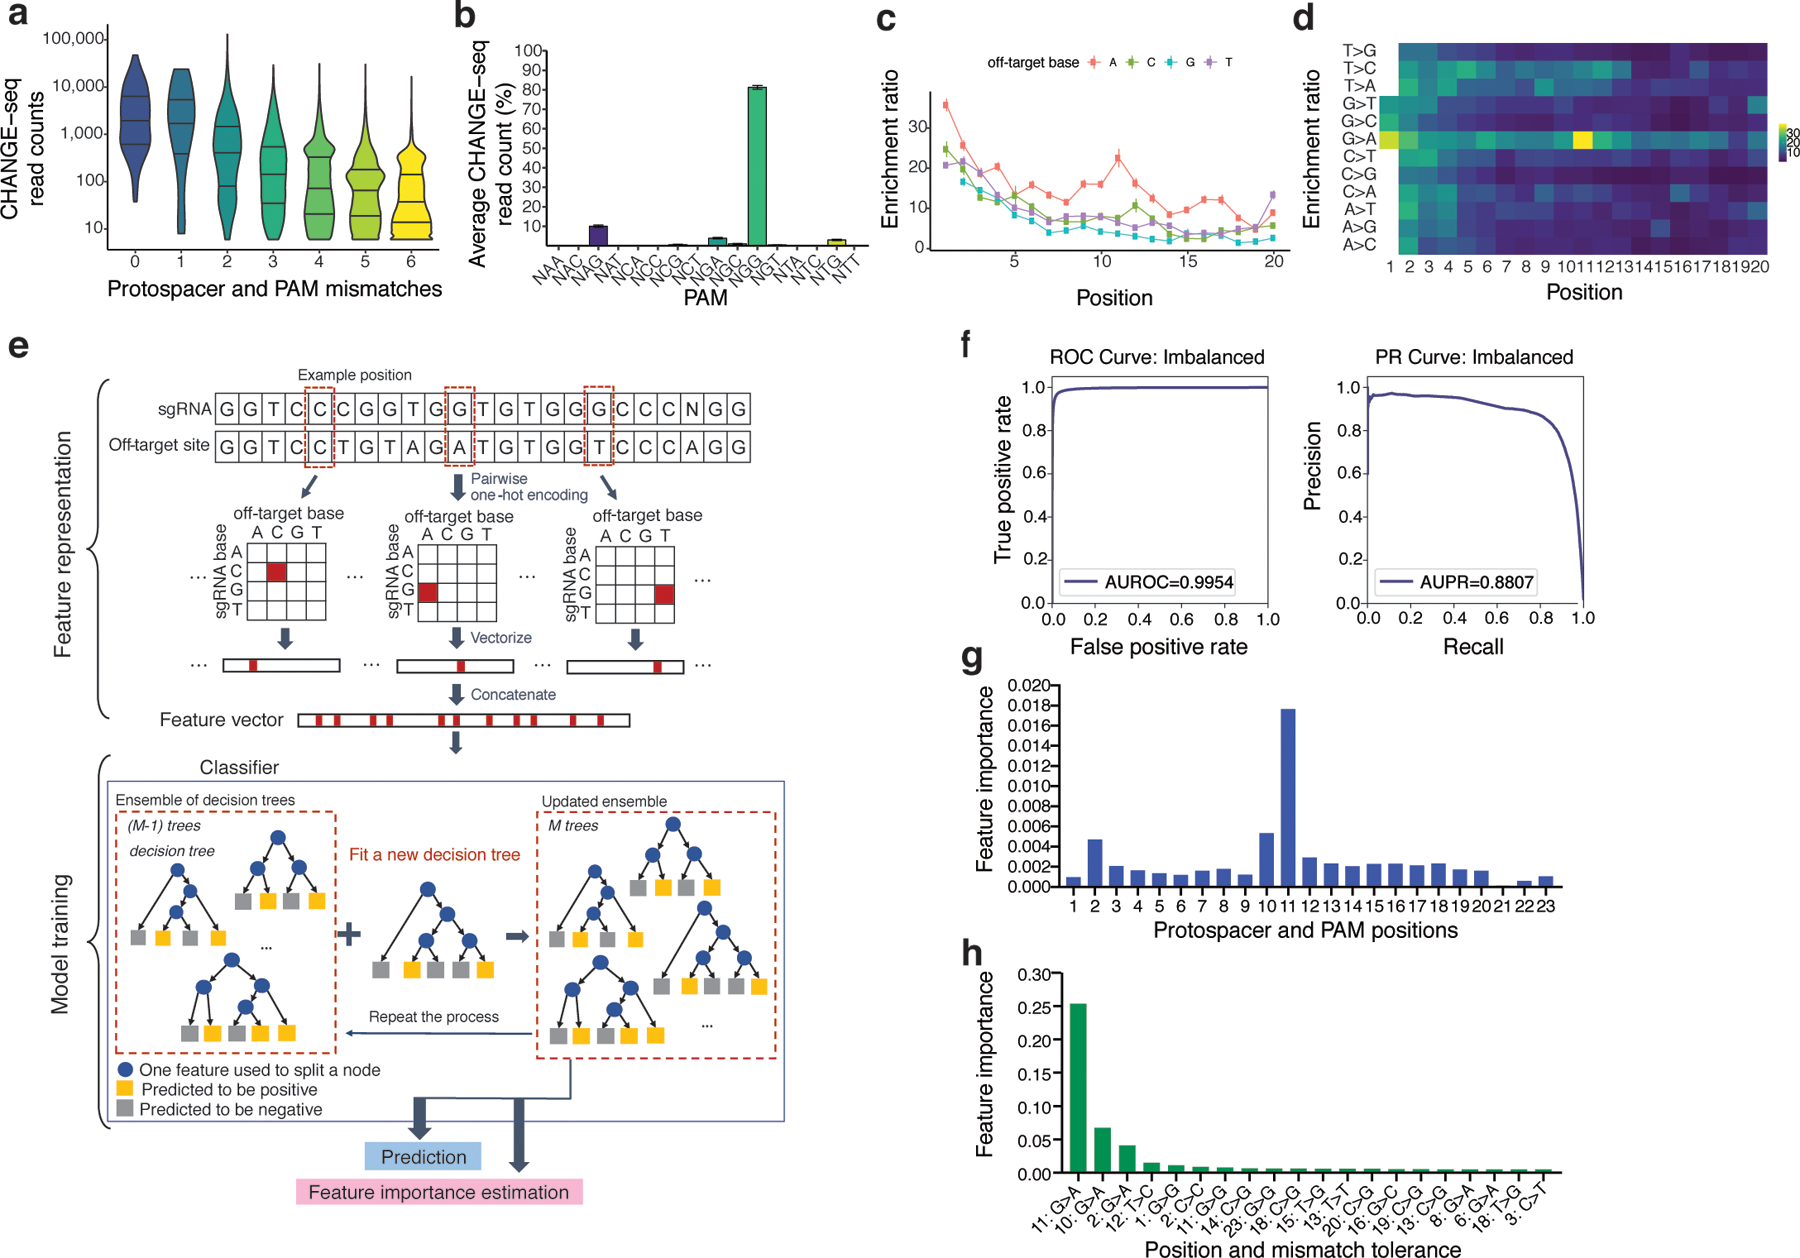
a, Violin plots showing the distribution of CHANGE-seq reads by protospacer and PAM mismatch count, with horizontal lines marking quartiles. Increasing number of mismatches relative to the on-target site decreased Cas9 in vitro cleavage activity. These data represent n=202,043 on- and off-target sites. b, Barplot of average CHANGE-seq read count percentage at off-target sites categorized by PAM sequence (n=110). Error bars represent standard error of the mean. c, Effects of protospacer mismatches on CHANGE-seq enrichment ratio categorized by non-target strand off-target base (n=201,934 off-target sites). Adenine base substitutions on the non-target strand are best tolerated. d, Effects of protospacer mismatches categorized by combination of intended and off-target base on CHANGE-seq enrichment ratio. G>A substitutions on the non-target strand are most tolerated. e, Overview of the machine learning framework used to predict off-target activity. Sequence information corresponding to each target and off-target site pair are encoded in a 1-dimensional vector format conducive to machine learning. For model training, a Gradient Tree Boosting (GTB) model is used. GTB works by iteratively updating an ensemble of decision trees, where each is a weak classifier. In addition, the model also estimates feature importance by evaluating the contribution of each feature to the prediction performance on the training samples. f, Receiver operator characteristic (ROC) curve and Precision-Recall (PR) curve of the prediction performance of a machine learning model based on the testing data (n=3,374,457). g, Top 20 important position-wise features estimated by the machine learning model. Each feature is denoted as nucleotide position in the off-target site. h, Mean feature importance in each position of the paired sequences. For each position, we calculate the average feature importance of all the 4 × 4 nucleotide pairs in the corresponding position between the sgRNA sequence and the off-target site as the mean feature importance of this position.
Finally, to predict genomic sites cleaved by Cas9 in vitro (as measured by CHANGE-seq read counts) with a machine learning approach, we trained an ensemble-learning based model, Gradient Tree Boosting31, based on sequence features present in our large-scale CHANGE-seq datasets (Fig. 3e). The classifier is based on the principle of aggregating and weighting multiple decision-tree classifiers to improve predictive capability and has advantages for interpretation of important predictive features. Overall, the machine learning procedure achieved high performance as evidenced by commonly accepted evaluation metrics for binary classification problems (Fig. 3f).
Our results suggest that sequence features alone have great power for predicting Cas9 activity. The top 3 most predictive positions in the target were the 11th, 10th, and 2nd (Fig. 3g) and the most important distinguishing features were G>A mismatches at those positions (Fig. 3h). Notably, a crystal structure of Cas9 bound to target strand DNA32 revealed stabilizing protein to target DNA phosphate backbone contacts between nucleotides 1–2, 8–9, and 11–13 which may explain why mismatches at these positions can support higher off-target activity32. Overall, high-throughput CHANGE-seq profiling may help illuminate regions with intrinsic specificity vulnerabilities as promising targets of future protein or sgRNA engineering efforts.
CHANGE-seq genome-wide activity profiles are sensitive predictors of cellular specificity
To compare CHANGE-seq in vitro genome-wide activity profiles with cellular genome-wide activity profiles, we optimized GUIDE-seq for human primary CD4+/CD8+ T-cells (Supplementary Note, Extended Data Figure 4a–f) and observed that GUIDE-seq technical replicates are highly reproducible (Extended Data Figure 4g). We performed GUIDE-seq on two sets of sites: one set randomly selected from the original 110 sites and another set prospectively chosen based on high CHANGE-seq specificity ratios.
We found that CHANGE-seq specificity ratios are accurate predictors of cellular specificity. The average number of cellular off-target sites detected by GUIDE-seq was lower for targets chosen based on favorable CHANGE-seq profiles than for targets chosen randomly (Fig. 4a, 4b, Supplementary Table 6). In pairwise comparisons between the number of off-target sites detected by GUIDE-seq, CHANGE-seq, and identified by sequence homology (Fig. 4c–e), we observed that the number of GUIDE-seq and CHANGE-seq off-targets were most strongly correlated (Fig. 4c), suggesting a straightforward approach for using CHANGE-seq to experimentally identify highly specific therapeutic targets. For example, using CHANGE-seq we identified a highly-specific and active target (TRAC site 3) towards the T-cell receptor alpha constant (TRAC) region, defined cellular genome-wide activity with GUIDE-seq, and observed the expected loss of cell surface-expression of TCRα/β as measured by flow cytometry (Extended Data Figure 5).
Fig. 4 |. CHANGE-seq genome-wide activity profiles sensitively predict cellular specificity.
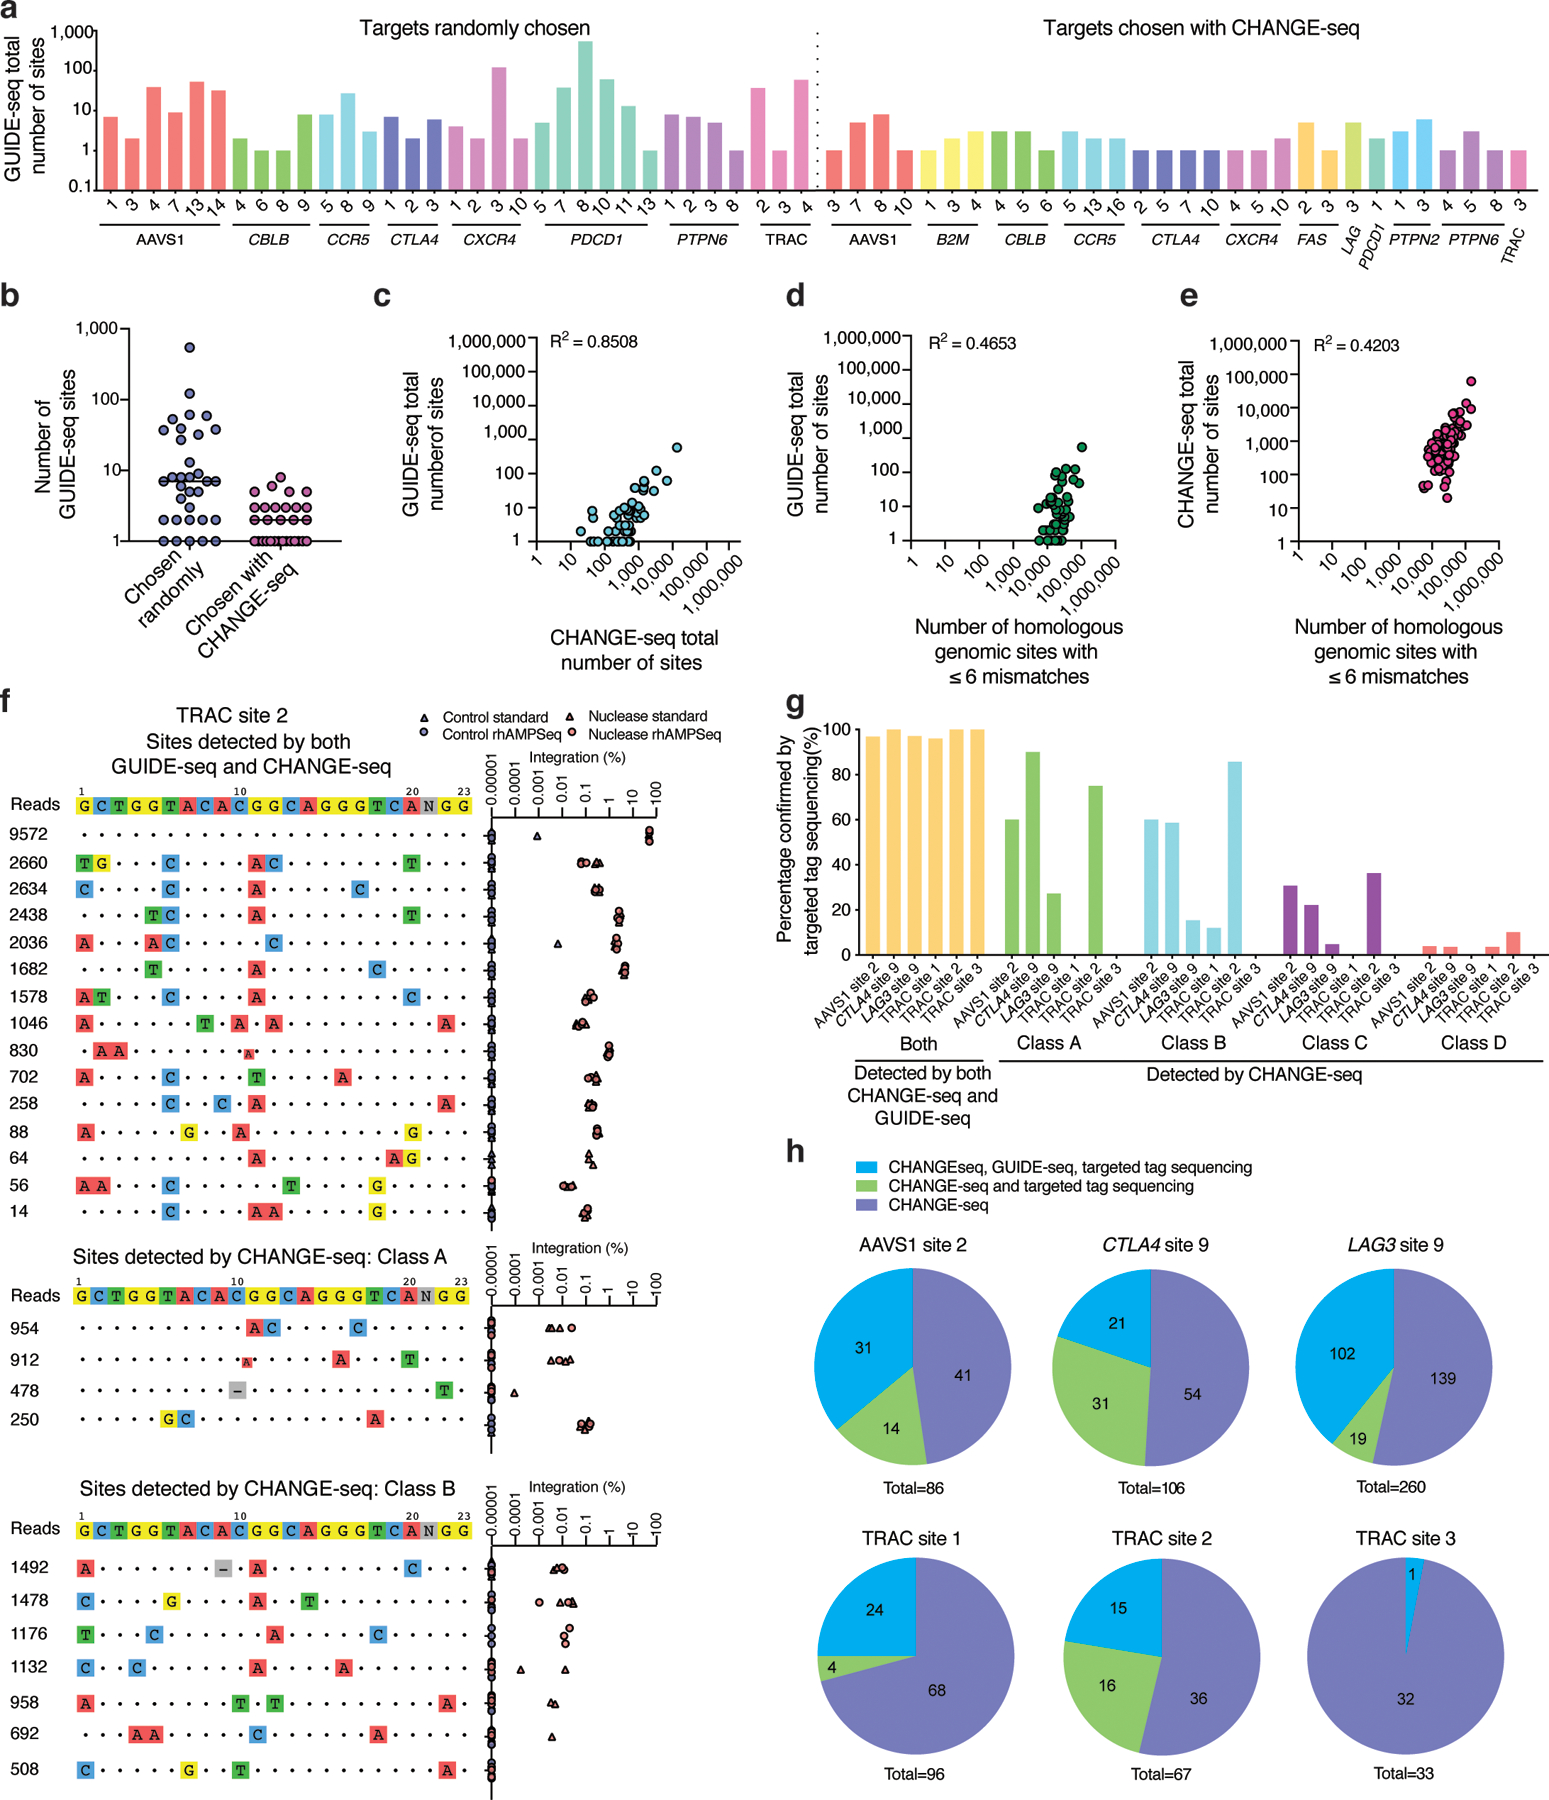
a, Barplot showing number of sites detected by GUIDE-seq for both sets of targets (chosen randomly or on the basis of CHANGE-seq), totaling 54 target sites (n=1). b, Dotplot of number of GUIDE-seq sites detected for targets chosen randomly (n=33) and targets chosen based on CHANGE-seq data (n=30), the centered line indicates the median. 9 sites are overlapping between sets. c, Scatterplot showing correlation in number of sites detected by GUIDE-seq versus CHANGE-seq. d, Scatterplots showing correlation in number of sites detected by GUIDE-seq and homologous genomic sites identified in silico (using Cas-OFFinder). e, Scatterplots showing correlation in number of sites detected by CHANGE-seq and number of homologous genomic sites. (c-e) Correlation between two samples was calculated using Pearson’s correlation coefficient. f, Targeted tag integration frequencies evaluated by standard targeted sequencing (triangle shape) and rhAMPSeq (circle shape) at off-target sites detected by both GUIDE-seq and CHANGE-seq (upper panel), and off-target sites detected by CHANGE-seq but not GUIDE-seq (middle and lower panel) for sgRNA targeted to TRAC site 2. g, Barplot showing the percentage of off-target sites confirmed by targeted tag sequencing at sites detected by CHANGE-seq and GUIDE-seq, and Class A, Class B, Class C, or Class D sites detected by CHANGE-seq and not GUIDE-seq. h, Pie charts showing fractions of CHANGE-seq sites evaluated by amplicon sequencing that are also detected by GUIDE-seq and targeted tag sequencing.
To validate the sensitivity of CHANGE-seq for identifying sites of bona fide cellular off-target mutations, we chose six target sites for further analysis: five with a broad range of CHANGE-seq off-target read counts (AAVS1 site 2, CTLA4 site 9, LAG3 site 9, TRAC site 1, TRAC site 2) and the one TRAC target (TRAC site 3) we predicted would have particularly high specificity. We completed matching GUIDE-seq experiments for these six targets and then classified CHANGE-seq detected off-target sites into five categories for further validation: those detected by both CHANGE-seq and GUIDE-seq, ‘Class A’ (1 to 3 mismatches, medium to high CHANGE-seq reads), ‘Class B’ (4 or less mismatches, high CHANGE-seq reads), ‘Class C’ (1 to 3 mismatches, low CHANGE-seq reads), and ‘Class D’ (remaining sites with 4–6 mismatches).
We selected 648 on- and off-target sites distributed across these categories for analysis by targeted tag sequencing (Supplementary Tables 7, 8), a highly sensitive measure of nuclease activity we described previously26. Targeted tag sequencing is performed via high-depth targeted sequencing of cells transfected with both Cas9 and GUIDE-seq double-stranded oligodeoxynucleotide (dsODN) tag and provides unambiguous evidence of DNA double-stranded break repair outcomes based on dsODN tag integration. At these 648 sites which we sequenced to an average depth of 140,000 reads, we confirmed that dsODN tag integration frequencies in human primary T-cells are strongly correlated with indel frequencies measured in the absence of GUIDE-seq dsODN tag (r2 of 0.8905 – 0.9996, see Extended Data Figure 6) supporting their use as a highly sensitive proxy for indel frequencies below the limits of detection of standard targeted sequencing of edited cells (~0.1%).
Of the 648 CHANGE-seq detected sites we examined, we validated 278 (42.9%) by targeted tag sequencing, including an average of 98.3% of the sites detected by both CHANGE-seq and GUIDE-seq (Fig. 4f–h). We confirmed Class A and Class B CHANGE-seq sites by targeted tag sequencing with higher frequency (mean of 42% and 38.6%, respectively) than Class C and Class D sites (mean of 15.7% and 3.5%, respectively). Notably, we verified 84 of 427 (18.3%) of off-target sites detected exclusively by CHANGE-seq and not GUIDE-seq that we analyzed by targeted tag sequencing (Fig. 4g–h, Extended Data Figure 7). Taken together, our results demonstrate that CHANGE-seq genome-wide activity profiles are strong predictors of cellular activity and that CHANGE-seq is more sensitive than GUIDE-seq for identifying bona fide cellular off-target activity.
Chromatin state influences genome editing activity
We hypothesized that in eukaryotic cells some sites detected in purified genomic DNA by CHANGE-seq but not by GUIDE-seq in live cells are constrained in the latter by chromatin state. Earlier reports suggested that nucleosome occupancy33,34 or chromatin accessibility35 can affect Cas9 activity but did not consider the influence of histone modifications (either singly or in combination), or gene expression. To explore these possibilities, we investigated relationships between CHANGE-seq and GUIDE-seq activities with 8 common histone modifications levels (ChIP-seq), and gene expression (RNA-seq), and measures of chromatin accessibility (ATAC-seq) that we generated from human primary CD4+/CD8+ T-cells. We confirmed that GUIDE-seq read counts are strongly correlated with tag integration and indel mutation frequencies in our experiments (Extended Data Figure 8), suggesting they are a reliable quantitative measure of Cas9 off-target activity. Off-target sites identified by CHANGE-seq, GUIDE-seq, and homologous sites with six or less mismatches were distributed similarly among annotated genomic regions such as introns, exons, intergenic regions, promoters and transcription start sites, and transcription termination signals (Fig. 5a). By integrating RNA-seq analysis, we found GUIDE-seq off-target sites more frequently in highly expressed genes than CHANGE-seq off-targets (Mann–Whitney U test, P = 0.029) or homologous genomic sites (Mann–Whitney U test, P = 0.0028) (Fig. 5b). Consistent with these findings, GUIDE-seq cellular off-targets had stronger open chromatin signals (ATAC-seq) and were significantly enriched for histone marks associated with active promoters (H3K4me3) and enhancers (H3K27ac) (Fig. 5c). In contrast, no enrichment was observed in regions that harbor histone marks reflecting polycomb repression or heterochromatin (H3K27me3 and H3K9me3).
Fig. 5 |. Cas9 off-target activity is enriched in active chromatin states.
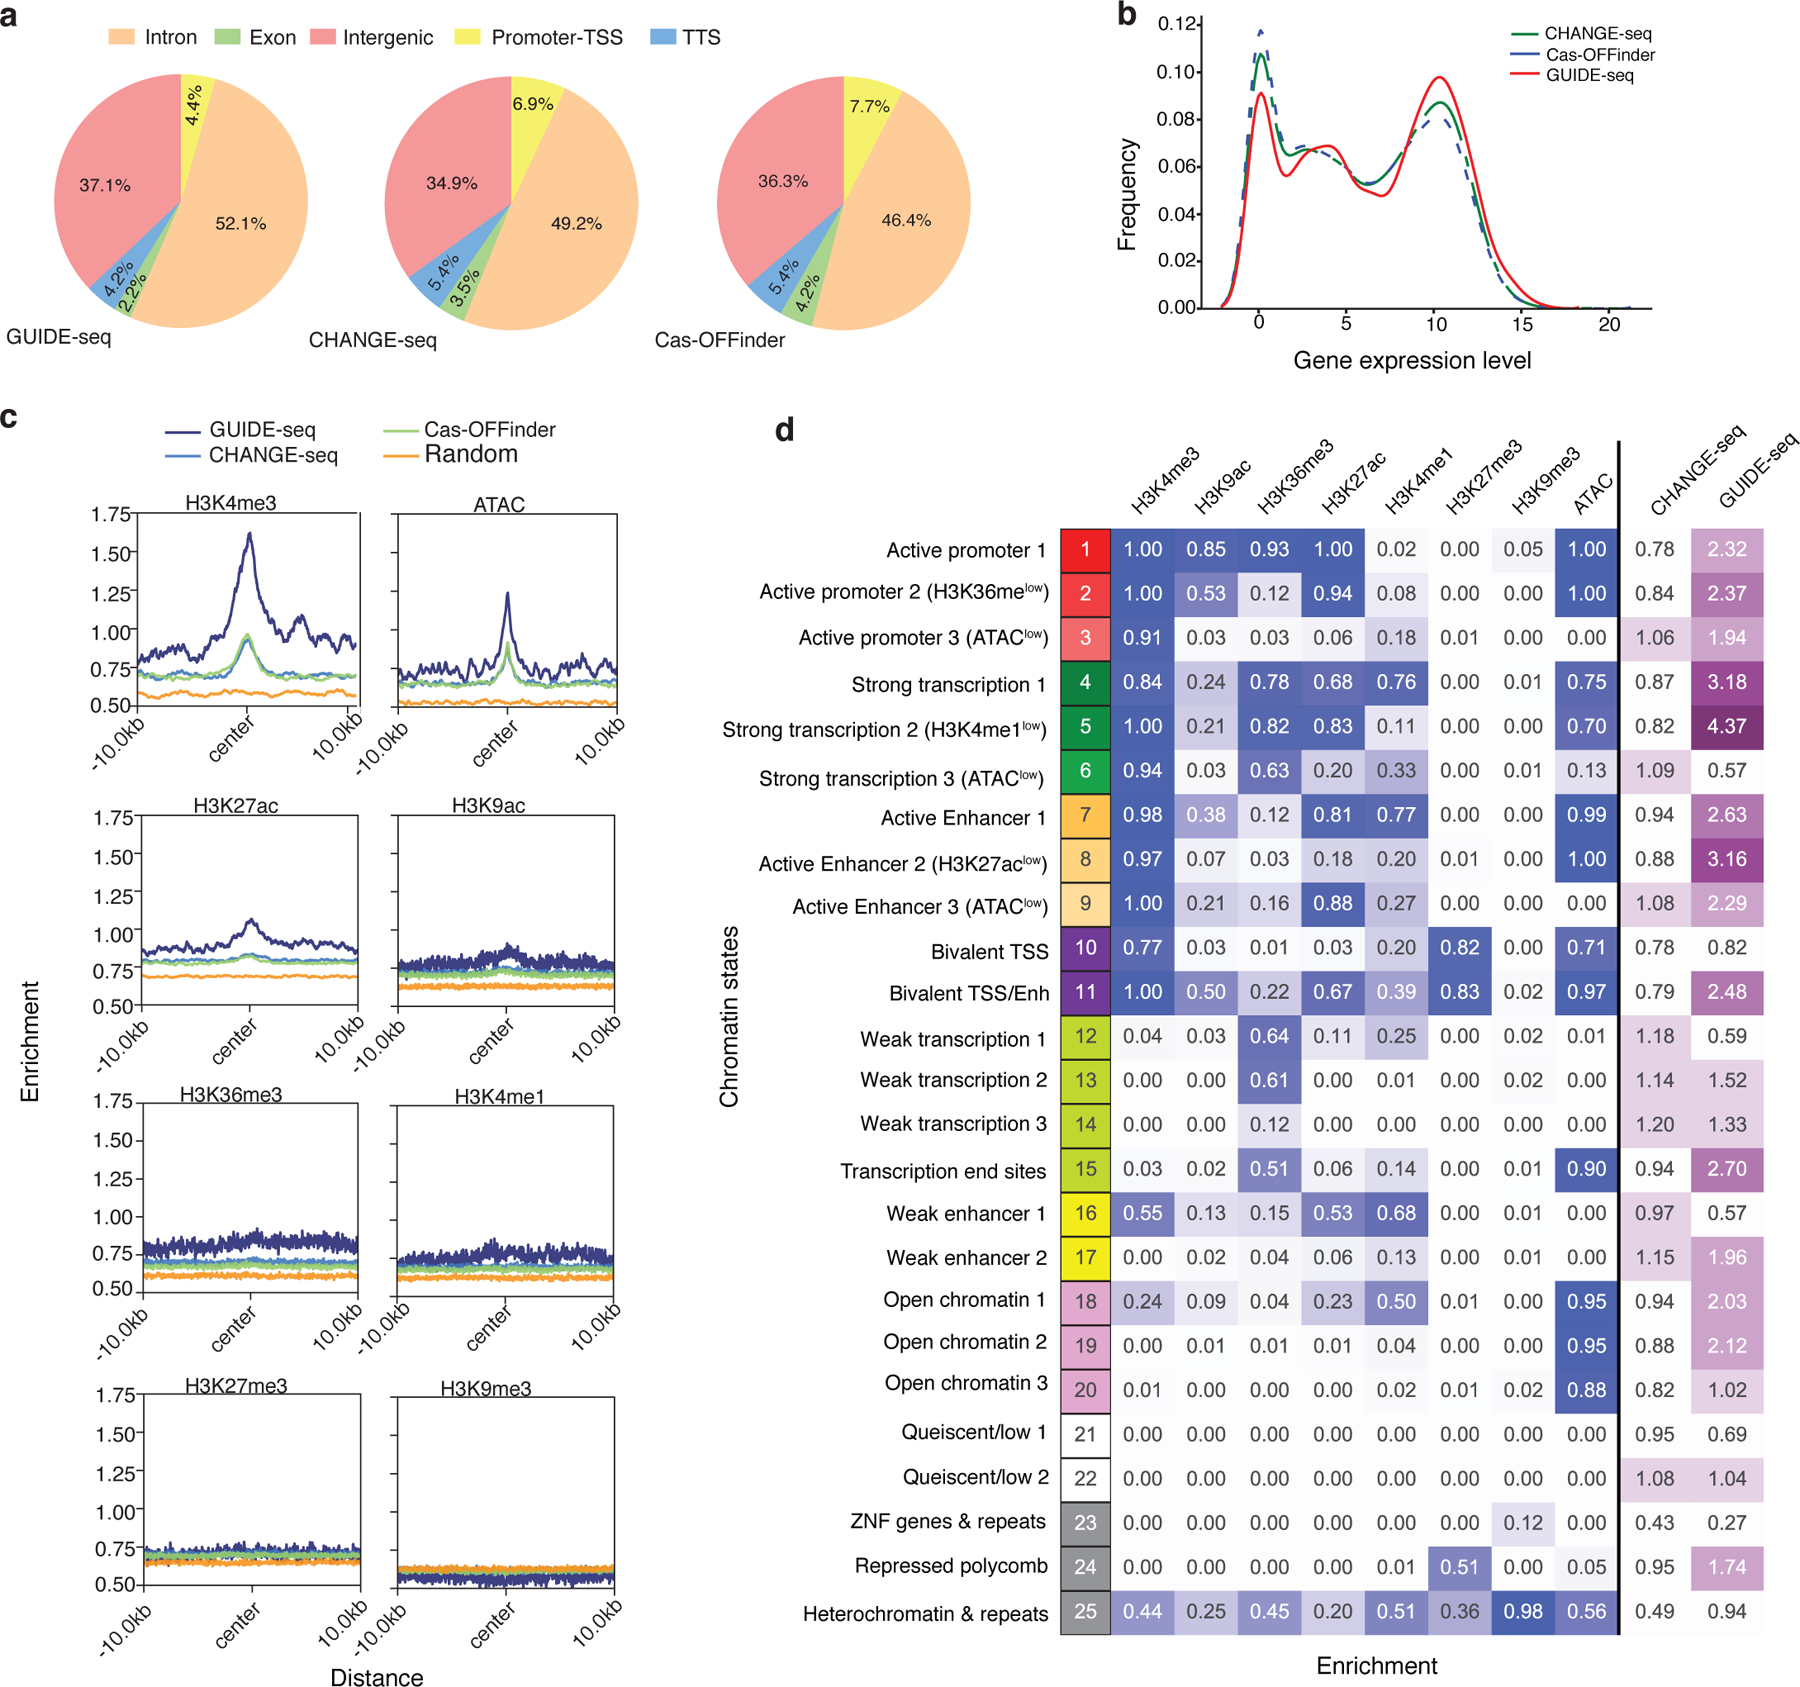
a, Pie charts showing fraction of cleavage sites identified by GUIDE-seq (left), CHANGE-seq (middle) and Cas-OFFinder (right) categorized according to their genomic features. TSS: Transcription Start Site. TTS: Transcription Termination Site. b, Kernel density plot showing the distribution of gene expression for CHANGE-seq, Cas-OFFinder, and GUIDE-seq. c, Average of histone modification ChIP-seq and ATAC-seq signal at off-target sites and flanking regions (± 10 kb). d, Heatmap showing emission probabilities (blue) of the 25-state ChromHMM model and fold enrichment of CHANGE-seq (n=11,000) and GUIDE-seq (n=1,196) sites relative to homologous genomic sites (n=11,000) with 6 or less mismatches (purple). Darker colors indicate greater emission probability or enrichment. Chromatin state annotations are shown on the left.
To examine the impact of chromatin state on Cas9 activity using combinations of epigenetic signals, we annotated the CD4+/CD8+ T-cell genome with our epigenetic data using ChromHMM, a bioinformatic algorithm that integrates multiple chromatin marks to predict epigenetic states. We assigned genomic regions to 25 different chromatin states predictive of transcriptional activities based on the combination of 8 histone modifications determined by ChIP-seq and ATAC-seq profiles. Chromatin state distributions differed between off-target sites detected in cells (GUIDE-seq) and in vitro (CHANGE-seq) but were similar between off-targets detected in vitro and homologous genomic sites identified in silico. Specifically, cellular off-targets were about 2 to 4 times more likely to be found in chromatin states associated with active promoters, strong transcription, active enhancers and open chromatin (Fig. 5d, Extended Data Figure 9). Our data revealed that chromatin openness is not the only epigenetic determinant of off-target activity, as off-target sites are enriched in chromatin states associated with active promoters and enhancers even in closed chromatin regions with low ATAC-seq signals.
Human genetic variation impacts genome editing nuclease activity
An important question for genome editing therapeutics is how individual genetic variation may affect the genome-wide activity of genome editors, but studies to date have been based on in silico analyses36,37 or conducted on genetically heterogeneous cancer cell lines26. The high-throughput capabilities of CHANGE-seq provide an opportunity to study these effects systematically using genomic DNA from karyotypically normal cells.
To understand how genetic variability can influence Cas9 genome-wide off-target activity, we selected 6 targets with average numbers of off-target sites containing genetic variation across seven distinct sources of human genomic DNA characterized extensively by the Genome-in-a-Bottle (GIAB) Consortium38. We rapidly generated an additional 84 CHANGE-seq profiles to evaluate these 6 targets across 7 genomic DNA samples in duplicate, (Fig. 6a), detecting 440 to 1888 off-target sites with high technical reproducibility (See Extended Data Figure 10a). Bland-Altman MA plots, a useful way to visualize read count differences between high-throughput sequencing data samples, showed clear evidence of single nucleotide variants (SNVs) that increase or decrease Cas9 nuclease off-target activity as measured by CHANGE-seq (Fig. 6b, Extended Data Figure 10b). Based on genotyping calls from the GIAB consortium38 and our own variant calls on genomic DNA from a healthy T-cell donor, we modelled the effects of genetic variation on CHANGE-seq read counts (see Methods). Notably, we found 110 sites out of 720 variation-containing off-target sites analyzed (~15.2%) with significant effects of genetic variation on Cas9 activity (FDR<0.05) (Fig. 6c), ranging from 6–38 sites per target (Fig. 6d) and a frequency of 7 to 29% (Fig. 6e).
Fig. 6 |. CHANGE-seq detects impact of individual human genetic variation on Cas9 genome-wide activity.
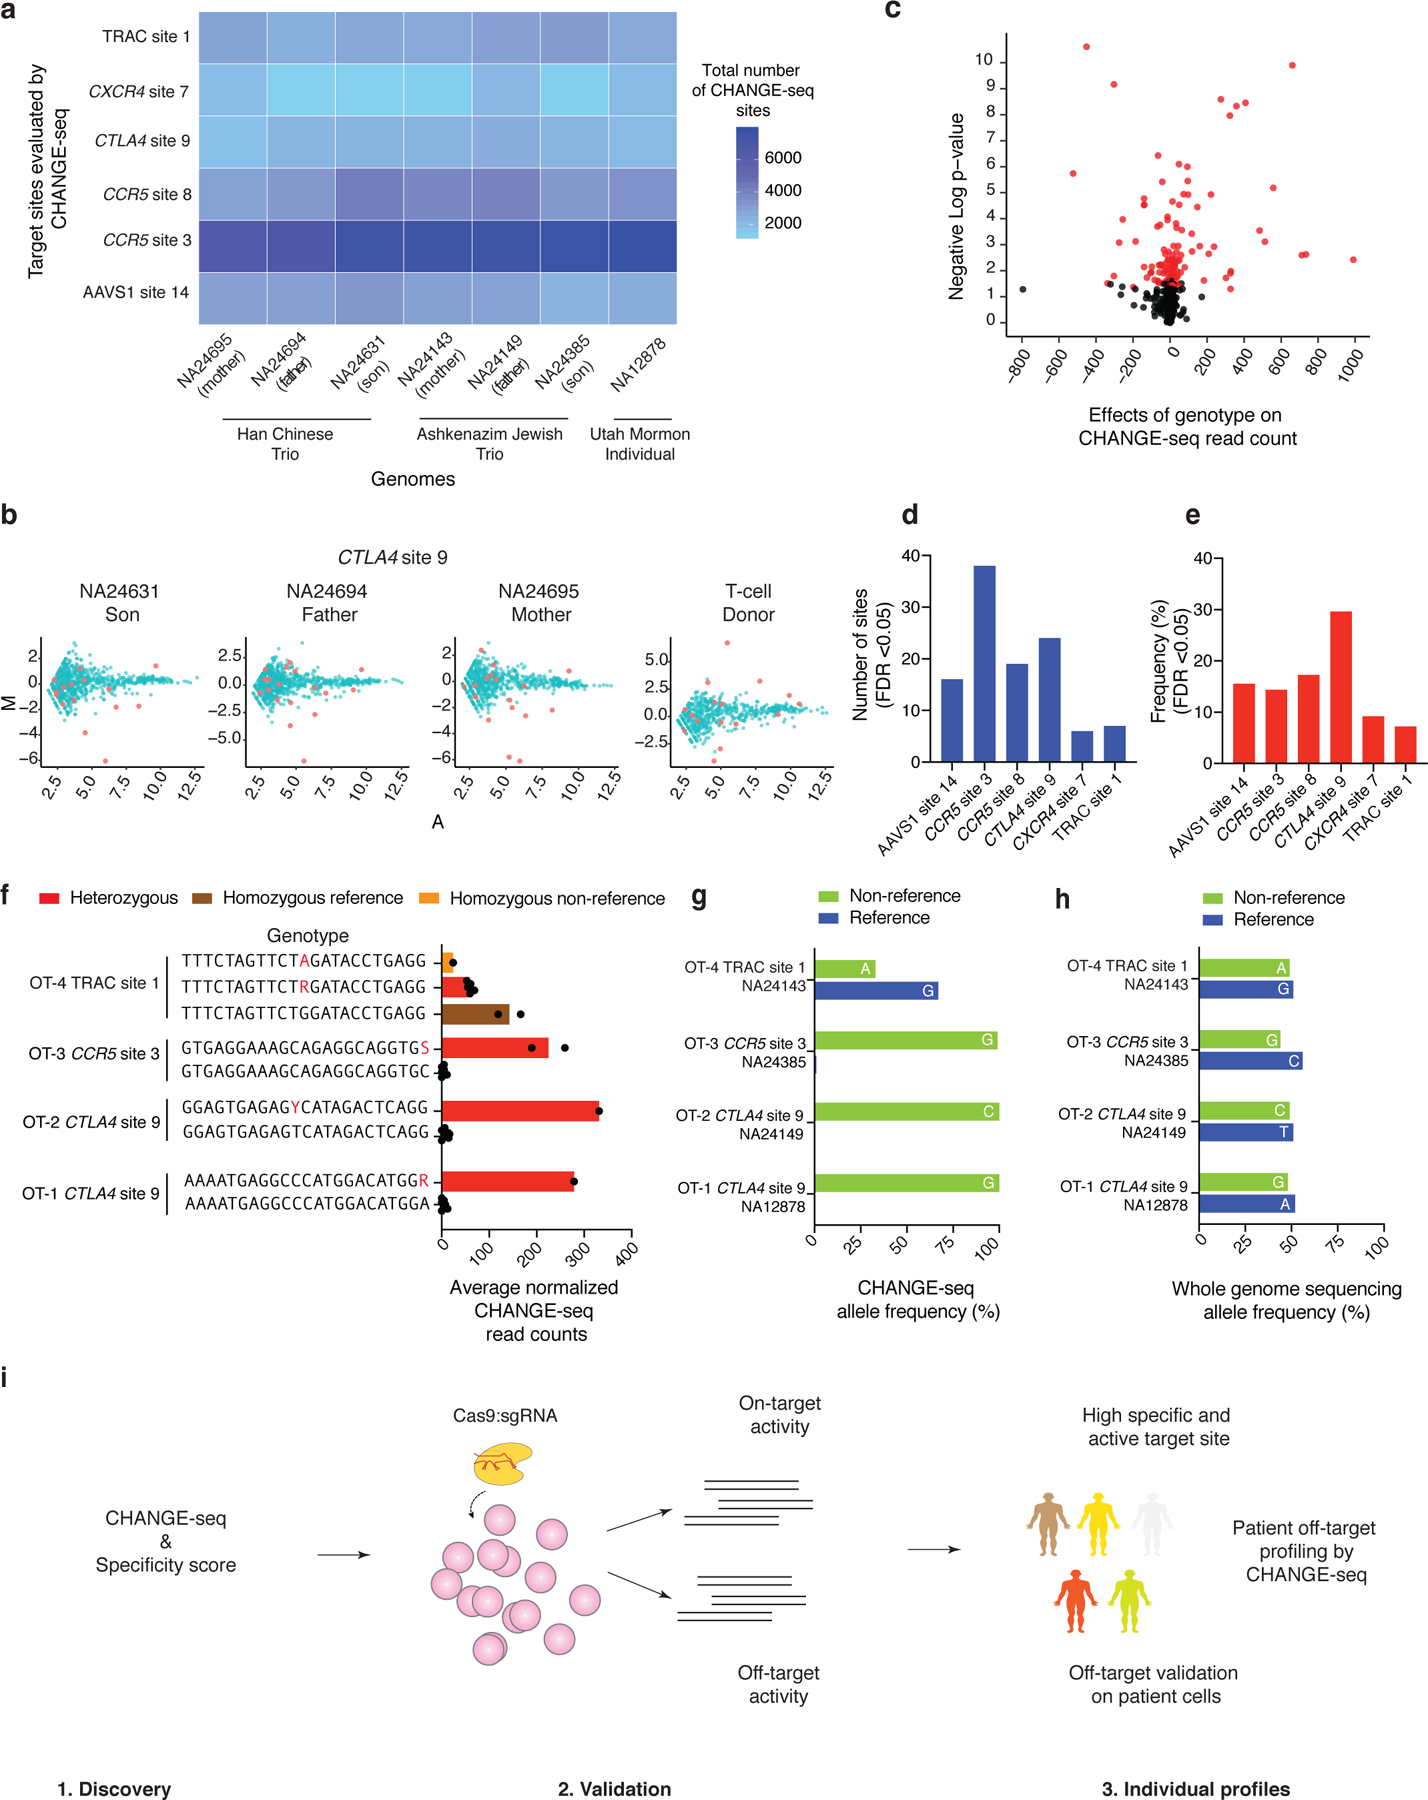
a, Heat-map showing the experimental design and total number of sites identified by high-throughput CHANGE-seq for six target sites across seven well-characterized genomes. b, MA plot of CHANGE-seq data from individuals characterized by the “Genome-in-a-bottle” project and the T-Cell donor. NA24631, NA24694 and NA24695 (Han Chinese Trio) and the T-cell donor are directly compared to NA12878. Off-target sites containing SNVs are highlighted in red. c, Volcano plot showing the off-target sites harboring SNVs. The red dots represent off-target sites with significant effects of SNVs (FDR<0.05) (n=720). For each site, we fit a simple linear regression model of normalized read count by genotype, calculated an F-statistic and p-values, and used the Benjamini-Hochberg procedure to control the false discovery rate due to multiple testing. d, Number of off-target sequences harboring SNVs with significant effect on Cas9 activity (FDR<0.05) measured by CHANGE-seq (n=110). e, Frequency of off-target sequences harboring SNVs with significant effect on Cas9 activity (FDR<0.05) measured by CHANGE-seq (n=110). f, Barplot showing off-target sites (reference and alternative sequences from the heterozygous genomes) with significant effects (FDR<0.05) from genetic variation on Cas9 activity as measured by CHANGE-seq read counts (n=8). SNVs are highlighted in red in the alternative sequence. g, Barplot showing the allele frequency as determined by CHANGE-seq for the reference and alternative sequences for the respective heterozygous genome, as an indication of the influence of SNVs present on off-targets on Cas9 activity. The reference nucleotide and the respective SNV in the non-reference sequence are highlighted in each bar. h, Barplot showing the whole genome sequencing allele frequency for the reference and alternative sequences for the respective heterozygous genome. The reference nucleotide and the respective SNV in the non-reference sequence are highlighted in each bar. i, Schematic illustrating the three phases of Cas9 genome-wide activity profiling leveraging CHANGE-seq for therapeutic applications. In phase 1, the designed sgRNAs are profiled by CHANGE-seq and scored according to their specificity ratio. In phase 2, high specific sgRNAs are tested for their activity at on and off-target sites in cells. Finally, in phase 3, sgRNAs with high specificity and high activity at on-target site are profiled by CHANGE-seq using patient gDNA, followed by off-target validation on patient cells.
We hypothesized that in heterozygous genomic DNA samples, genetic variants truly affecting Cas9 off-target activity would be preferentially observed in CHANGE-seq but not in whole genome sequencing reads. At all heterozygous off-target sites that we examined (Fig. 6f), as predicted, we observed clear allelic bias in CHANGE-seq (Fig. 6g) but not whole genome-sequencing (Fig. 6h) reads. We noted examples of genetic variants that create de novo canonical NGG PAM sequences that increase CRISPR-Cas9 activity. Taken together, our results show that genetic variation can strongly impact Cas9 in vitro cleavage activity and highlight the sensitivity of CHANGE-seq for defining personalized genome-wide activity profiles (Fig. 6i).
Discussion
With a rapid and robust Tn5 tagmentation-based protocol, CHANGE-seq enables the definition of CRISPR-Cas9 genome-wide activity at scales not previously achievable. CHANGE-seq outperforms CIRCLE-seq in terms of sequencing efficiency while preserving advantages that include DNA repair-machinery independent detection, simultaneous reading of both sides of cleavage site for reference-independent discovery, high sensitivity, and no requirements for costly DNA synthesis to practice. In this study, we rapidly generated 214 in vitro genome-wide activity profiles across 120 targets with DNA from 10 sources, underscoring the throughput of CHANGE-seq.
Our findings from large-scale CHANGE-seq datasets illustrate new biological principles of Cas9 genome-wide activity. First, we identified target sequence features, G-base frequency and nucleotide diversity, that are strongly associated with specificity. These features may be useful for prospectively choosing good targets; in future studies it will be interesting to understand whether these features are generalizable to other CRISPR-Cas nucleases. Second, our machine learning approach achieved high performance and revealed key positions and mismatch combinations that predict individual off-target site activity. In principle, these predictions of off-target site activity could be further aggregated for selection of highly-specific targets. Third, we found that the genome-wide activity of Cas9 is enriched in regions of open chromatin or active promoters, enhancers, or transcription. Our findings simultaneously explain why Cas9 specificity is better than anticipated by in vitro genome-wide activity data but also imply that bona fide cellular off-targets are more likely to disrupt functional elements. Our matched biochemical, cellular, and epigenomic dataset may become a valuable resource for training machine learning models to predict cellular off-target activity. Finally, our study highlights the potential relevance of considering the effects of individual genetic variation on genome-wide nuclease activity and provides a straightforward experimental method for detection. For future therapeutic applications, a key question will be whether detectable patient-specific off-target activity is likely to cause undesired biological adverse effects.
Biochemical approaches like CHANGE-seq are particularly valuable, because they can illuminate the genome-wide landscape of genome editing activity with exquisite sensitivity. It becomes impractical for cellular methods for detecting genome-wide activity to achieve these levels of sensitivity as their modes of detection are linearly coupled to DNA repair frequencies. Many envisioned promising cellular therapies such as genome-edited CAR-T cells for cancer immunotherapy require the modification of hundreds of millions or billions of cells, implying that it will be important to understand the genome-wide activity of editors beyond the ~0.1% threshold of cell-based approaches.
We envision that CHANGE-seq will have broad utility for both basic research and therapeutic development. For clinical genome editing applications, CHANGE-seq offers an attractive new paradigm whereby promising lead targets can be simply identified by high-throughput in vitro genome-wide activity profiling and, if needed, patient-specific genome-wide off-target activity rapidly evaluated. We expect CHANGE-seq can be adapted to the many other CRISPR-Cas genome editing nucleases or base editors that are being rapidly discovered or engineered32–37, to screen for genome-wide off-target effects in vivo39, and to further advance our understanding of broadly applicable genome editing technologies.
Online Methods
Isolation of human primary T-cells.
Research-consented and deidentified peripheral blood mononuclear cells (PBMCs) were obtained commercially (Key Biologics); CD4+/CD8+ T-cells were purified using magnetic separation on a CliniMACS Plus instrument. Briefly, the percentage of CD4+, CD8+ CD3+ and CD19+ cells in the PBMCs was assessed by flow cytometry. Cells were then washed in CliniMACS buffer with 0.5% HSA and resuspended in 190 ml of IVIG (Intravenous Immunoglobulin), followed by incubation for 15 minutes. Subsequently, cells were incubated and labeled with CD4 and CD8 microbeads (Miltenyi Biotec). Next, two washes were performed using CliniMACS buffer with 0.5% HSA, followed by CD4+/CD8+ cells selection. The percentage of CD4+, CD8+, CD3+ and CD19+ cells in the selected population was determined by flow cytometry as quality control metrics.
Cell culture.
U2-OS (ATCC) and HEK 293 cells (ATCC) were cultured in Advanced DMEM (Life Technologies), supplemented with 10% FBS (Thermo Fisher Scientific), 2 mM GlutaMax (Thermo Fisher Scientific) and penicillin-streptomycin (50 U/ml) (Thermo Fisher Scientific) at 37°C with 5% CO2. Human primary CD4+/CD8+ T-cells were cultured in X-Vivo 15 media (Lonza) supplemented with 5% human heat-inactivated serum (Fisher), 10 ng/ml IL-7 (Miltenyi), and 10 ng/ml IL-15 (Miltenyi). T-cells were stimulated with MACS GMP T-cell TransAct polymeric nanomatrix (Miltenyi) for 3 days according to the manufacturer’s instructions prior to transfection.
In vitro transcription of sgRNAs.
Oligonucleotides (IDT) containing the sgRNA target sites were annealed and cloned into the BsaI site of plasmid pCRL01 containing a T7 RNA polymerase promoter. The sgRNA transcription plasmids were linearized with HindIII restriction enzyme (NEB) and purified with MinElute (Qiagen) or SPRI magnetic beads. The linearized plasmids were used as templates for run-off in vitro transcription of the sgRNA using a MEGAshortscript kit (Ambion) according to manufacturer’s instruction as previously described27. sgRNAs were purified using a Megaclear kit (Ambion) or SPRI magnetic beads, quantified by Nanodrop and the quality of the in vitro transcription product checked by QIAxcel capillary electrophoresis.
CHANGE-seq.
For experiments comparing CHANGE-seq with CIRCLE-seq, CHANGE-seq library preparation was performed on genomic DNA from the same source in which they were previously evaluated by CIRCLE-seq (U2OS or HEK293). For high-throughput experiments performed with sgRNAs targeting T-cell relevant therapeutic targets, CHANGE-seq was performed on genomic DNA isolated from human CD4+/CD8+T-cells. Genomic DNA was isolated using Gentra PureGene Tissue Kit (Qiagen) and quantified by Qubit fluorimetry (Invitrogen). Experiments performed for determining the association of off-target sites with SNVs were performed on human genomic DNA sources (NA12878, NA24385, NA24149, NA24143, NA24631, NA24694, NA24695) characterized by the Genome in a Bottle Consortium38, obtained from Coriell as DNA. Purified genomic DNA was tagmented with a custom Tn5-transposome to an average length of 400 bp, gap repaired with HiFi HotStart Uracil+ Ready Mix (Kapa), and treated with a mixture of USER enzyme and T4 polynucleotide kinase (NEB). DNA was circularized at a concentration of 5 ng/μl with T4 DNA ligase (NEB), and treated with a cocktail of exonucleases, Lambda exonuclease (NEB), Exonuclease I (NEB) and Plasmid-Safe ATP-dependent DNase (Lucigen) to enzymatically degrade remaining linear DNA molecules. sgRNAs were re-folded prior Cas9:sgRNA complexation and a Cas9:sgRNA ratio of 1:3 was used to ensure full ribonucleoprotein complexation. In vitro cleavage reactions were performed in a 50 μl volume with Cas9 nuclease buffer, 90 nM SpCas9 protein (NEB), 270 nM in vitro transcribed sgRNA and 125 ng of exonuclease treated circularized DNA. Digested products were treated with proteinase K (NEB), A-tailed, ligated with a hairpin adapter (NEB), treated with USER enzyme and amplified by PCR using Kapa HiFi polymerase (Kapa Biosystems). Completed libraries were quantified by qPCR using Kapa Library Quantification kit (Kapa Biosystems) and sequenced with 150 bp paired-end reads on an Illumina MiSeq or NextSeq 550 instruments. CHANGE-seq analysis was performed as previous described for CIRCLE-seq19,20. A detailed user protocol for CHANGE-seq is provided (Supplementary Protocol).
Atomic force microscopy (AFM).
Prior to CHANGE-seq circularized genomic DNA deposition, a mica surface was modified using 3-aminopropyltriethoxysilane (APTES) in combination with N,N-Diisopropylethylamine (DIPEA). Freshly cleaved mica was placed into a desiccator preliminary purged with Argon gas and exposed to the vapors of APTES and DIPEA for 2 hours under vacuum. Chemicals were removed, the desiccator was purged with Argon gas, and AP-mica was cured under vacuum for 2 days. CHANGE-seq circularized genomic DNA was diluted to 1 ng/μL using Deposition Buffer (20 mM Tris pH 8.0, 20 mM NaCl, 20 mM MgCl2), deposited onto freshly prepared AP-mica, incubated for 5 min, rinsed with 3 ml of deionized HPLC grade water, air-dried and visualized with AFM instrument (Cypher, Asylum Research) in non-contact (tapping) mode in air using AFM probes with apex curvature radius < 1 nm, resonance frequency ~ 65 kHz, and force constant ~ 0.5 N/m (MikroMasch).
Cell transfection.
Transfections of human primary CD4+/CD8+ T-cells were performed with Cas9:sgRNA RNP complex containing 75 pmol of purified recombinant Cas9 (Protein Production Core Facility, St. Jude) and 3-fold molar excess of in vitro transcribed sgRNA. RNPs were added directly to 3×10⁵ cells resuspended in 20 μl of P3 solution and nucleofected with pre-programmed pulse EO-115 in 4D-Nucleofector™ System (Lonza). For GUIDE-seq, 100 pmol of end-protected double-stranded oligodeoxynucleotides (dsODNs) were added directly to the cell suspension before nucleofection. After nucleofection, cells were recovered in X-Vivo 15 media with 20% human heat-inactivated serum (Fisher), 10 ng/ml IL-7 (Miltenyi), and 10 ng/ml IL-15 (Miltenyi). After 3 days cells were either harvested for genomic DNA purification using Agencourt DNAdvance (Beckman Coulter) or further expanded for testing with flow cytometry.
Machine learning model.
We identified homologous genomic sites with 6 or fewer mismatches relative to intended sgRNA target sequences using Cas-OFFinder40 and divided them into two categories: those that are cleaved in vitro and those that remain unaffected on the basis of CHANGE-seq read counts. We considered off-target sites that have greater than 100 CHANGE-seq reads as positive samples and those with no reads as negative samples. We excluded sites with non-zero CHANGE-seq reads less than 100 as they are most likely to be subject to sampling artifacts and therefore their status as reproducibly positive or negative sites is less certain. There are many more negative samples than positive ones (about 50:1). To evaluate the performance of the model fairly, we first split the dataset into non-overlapping training samples and testing samples, and further ensured that there are no shared sgRNA targets between training and testing samples.
To utilize a machine learning method using the sequences of off-target sites and sgRNA as input, we encoded them as numerical features. We encoded each sample by keeping tracking of all the position-wise discrepancies or consistencies between the off-target site and intended target sequence which enabled us to capture the feature importance of the nucleotide pairs (mismatches or matches) in the corresponding positions between the guide RNA sequence and the off-target site. Each sample is first encoded as a three-dimensional (3D) matrix of size 23 × 4 × 4, where the first dimension of the matrix corresponds to the positions of the nucleotides in a sequence. For the j-th position for sample i, we use a 4 × 4 matrix to encode the combinatorial nucleotide information in the paired off-target site and sgRNA sequence in this position. The columns and rows in correspond to A, C, G, and T in the sgRNA sequence (denoted by ) and the off-target site (denoted by ) of sample , respectively. Let be the entry on the a-th row and b-th column of . Let and denote the k-th element of V, . We define that if and only if the nucleotide in the j-th position is in and it is in . Therefore, 1s in the diagonal entries of .represents that the nucleotides are identical between and in the corresponding position. 1s in the off-diagonal entries represent nucleotide mismatches. We then vectorize the 23 × 4 × 4 matrix into a 1D feature vector of size 368, by first vectorizing the 4 × 4 matrix for each position to be a vector of size 16 and then concatenating the vectors of all the positions. We denote the concatenated vector as . Let be the number of mismatches between and . Optionally, we include as an extra feature dimension in , resulting in a feature vector of size 369 for sample .
Next, we built an ensemble-learning based model, Gradient Tree Boosting31 (GTB), to predict whether an off-target site would be cut using the sequence-based features. We split the samples into training and testing data with a ratio of 1:1. We used two settings. First, the training and testing data are both balanced. We downsampled the negative samples such that the negative sample size and the positive sample size are equal. Second, the training and testing data are both highly imbalanced. The ratio of the negative sample size over the positive sample size is approximately 50:1. In each of the settings, we train a GTB classifier (implemented using the XGBoost library41) on the training data and evaluated the prediction performance on the testing data in terms of accuracy, AUROC (area under the Receiver Operating Characteristic curve), and AUPR (area under the Precision-Recall curve).
GUIDE-seq.
GUIDE-seq library preparation was performed as previously described12. Briefly, genomic DNA was purified with Agencourt DNAdvance using a BioMek FxP automation system (both from Beckman Coulter). Genomic DNA was sheared to average fragment size of 500 bp by Covaris E220 sonication (Covaris) and purified with SPRI magnetic beads. Genomic DNA was quantified by Qubit (Invitrogen), and 400 ng was used for GUIDE-seq library preparation. Genomic DNA was treated with End-repair Mix (Qiagen) and A-tailed with Taq polymerase (Fisher), ligated to single-tailed sequencing adapters and purified with SPRI magnetic beads. The adapter-ligated library was subjected to two rounds of nested PCR using dsODN sense- and antisense-specific primers in separate reactions for each sample, and then purified with SPRI magnetic beads. Libraries were quantified with Kapa qPCR Library Quantification kit (Kapa). Equimolar amounts of samples were pooled for GUIDE-seq libraries were sequenced with 150 bp paired end reads on Illumina NextSeq 550 or HiSeq 2500 sequencers. GUIDE-seq analysis was performed as previous described12.
Targeted sequencing.
To determine the indel frequency at 110 CRISPR-Cas9 target sites, human primary CD4+/CD8+ T-cells were transfected with Cas9:sgRNA RNP complex, in triplicates, as described above. On-target sites were amplified from T-cell genomic DNA using 2X Phusion Hot Start Flex Master Mix (NEB) (primers described in Supplementary Table 2) and 100 ng of genomic DNA as the input for each PCR. PCR products were purified with SPRI magnetic beads, normalized in concentration and pooled into different libraries. TruSeq deep sequencing libraries were constructed with 500 ng of each pooled sample using HTP Library Preparation Kit PCR-free (96 rxn) (Kapa Biosystems). Completed libraries were quantified by qPCR using Kapa Library Quantification kit (Kapa Biosystems) and sequenced with 150 bp paired-end reads on an Illumina MiSeq instrument.
NGS libraries for the GUIDE-seq optimization experiments (Supplementary Note) were prepared with a two-step PCR protocol. Target sites were amplified from 100 ng of purified genomic DNA using Phusion Hot Start Flex 2X (NEB) with primers listed in Supplementary Table 2, containing partial Illumina sequencing adaptors. Second step PCR to add full adapters and dual-indexed barcodes was performed with KAPA HiFi ready mix (KAPA), using the first PCR as DNA template. Libraries were sequenced with 150 bp paired-end on an Illumina MiSeq instrument.
To determine the indel frequency and tag integration frequency at CHANGE-seq identified off-target sites, human primary CD4+/CD8+ T-cells were transfected with Cas9:sgRNA RNP complex in the presence or absence of the GUIDE-seq dsODN tag, in triplicates, as described above. On- and off-target sites for six sgRNAs targets were amplified from T-cell genomic DNA using rhAMPSeq system (IDT), with primers listed in Supplementary Table 2, and sequencing libraries were generated according to manufacturer’s instructions. To validate the rhAMPSeq system, we performed standard amplicon sequencing for two sgRNAs targets (CTLA4 site 9 and TRAC site 2), as described above and found that indel mutation frequencies and tag integration frequencies for both methods were strongly correlated (See Extended Figure 6a). Completed libraries were quantified by qPCR using Kapa Library Quantification kit (Kapa Biosystems) and sequenced with 150 bp paired-end reads on an Illumina NextSeq 550 instrument.
Indel and targeted tag sequencing analysis.
Indel and targeted tag sequencing analysis were conducted using custom Python code and open-source bioinformatic tools. First, paired-end high-throughput sequencing reads were processed to remove adapter sequences with trimmomatic41 (version 0.36), merged into a single read with FLASH42 (version 1.2.11), and mapped to human genome reference hg38 using BWA-MEM43 (version 0.7.12). Reads that mapped to on-target or off-target sites were realigned to the intended amplicon region and to the dsODN tag sequence using a striped Smith Waterman algorithm as implemented in the Python library scikit-bio; indels and tag integrations were counted and reported with total read counts. Statistically significant differences between edited and control samples were determined using Fisher’s Exact testing.
Flow cytometry.
Control and edited CD4+/CD8+ T-cells were collected 14 days after nucleofection, washed in PBS containing 2% FBS, and then stained with anti-human TCRαβ APC (BD Biosciences) monoclonal antibody. Live cell discrimination was performed by adding fixable viability dye BV506 (Invitrogen, Carlsbad, CA) prior to sample acquisition. Samples were acquired on a BD FACS Canto II (BD Biosciences, Franklin Lakes, NJ), and list mode files were analyzed using FlowJo software ver 10.5.3 (FlowJo LLC, Ashland, OR). Positive populations were determined using FMO and isotype-matched controls.
ATAC-seq.
ATAC-seq libraries on 50,000 CD4+/CD8+ T-cells per sample were constructed as previously described44. Libraries were sequenced with 100 bp paired-end reads using an Illumina HiSeq 4000. Adapter sequences were trimmed by skewer45, and then mapped to hg38 using BWA (version 0.7.1). ATAC-seq peaks were called using MACS246 with the following parameters macs2 callpeak --nomodel --shift −100 --extsize 200.
Histone modification ChIP-seq.
Chromatin immunoprecipitation sequencing libraries on 5–10 million cross-linked CD4+/CD8+ T-cells using antibodies to H3K4me1 (ab8895, Abcam), H3K4me3 (9751, Cell signaling), H3K9ac (ab10812, Abcam), H3K27me3 (ab6002, Abcam), H3K27ac (ab4729, Abcam), H3K36me3 (ab9050, Abcam) or H3K9me3 (ab8898, Abcam) were prepared in biological replicates as described previously47. Sequencing libraries were generated using NEBNext Ultra II DNA library Prep kit (NEB, E7645). Custom TruSeq adaptors were used. Libraries were sequenced with 50 bp single-end reads using Illumina HiSeq 2500 or HiSeq 4000. The sequencing reads were mapped to hg38 using BWA. ChIP-seq peaks were called using MACS2.
RNA-seq.
CD4+/CD8+ T-cells were cultured as described above. RNA extraction was performed using the RNeasy Mini Kit (Qiagen). RNA quality was checked by Agilent High Sensitivity RNA ScreenTape, and the two samples with the highest RNA Integrity Number equivalent were chosen (RINe = 9.9). RNA libraries were prepared using Illumina TruSeq Stranded Total RNA Library Prep, including ribosomal RNA removal using Ribo-Zero. Libraries were sequenced with 75-bp paired-end reads using Illumina NovaSeq 6000. Transcript-level abundance was quantified using kallisto48 with pre-built genome index for Ensembl transcriptomes v94. To compare gene expression (i.e., ext_counts) distributions of off-target sites in GUIDE-seq, CHANGE-seq, and Cas-OFFinder, a kernel density estimation plot was made using a Python package, seaborn (https://github.com/mwaskom/seaborn/tree/v0.8.1). A Mann–Whitney U test was applied to test the null hypothesis that the gene expression of off-targets from any two methods have the same distribution. CHANGE-seq and Cas-OFFinder sites were sub-sampled to have the same number of sites as GUIDE-seq. Mann–Whitney U test was applied 100 times and the mean p-value was used.
Whole-genome sequencing.
Genomic DNA from CD4+/CD8+ T-cells was isolated using a Gentra PureGene Tissue Kit (Qiagen) and sheared on a LE220 ultrasonicator (Covaris). Libraries were prepared from sheared DNA with HyperPrep Library Preparation Kits (Roche) and quantified using the Quant-iT PicoGreen dsDNA assay (Life Technologies) or low pass sequencing with a MiSeq nano kit (Illumina). Paired end 150 cycle sequencing was performed on a NovaSeq 6000 (Illumina).
Epigenetic data analysis.
DeepTools49 was used to generate heatmaps and average signal plots for GUIDE-seq and CHANGE-seq detected off-targets, Cas-OFFinder predicted off-targets, and randomly selected 23 bp regions (bedtools shuffle). The signal tracks (fold-enrichment bigwiggle files) used in those plots were generated by MACS2 (following the method described in MACS2 GitHub wiki). Since the number of off-target sites in CHANGE-seq and Cas-OFFinder was much larger than GUIDE-seq, we randomly selected 100 off-targets per site, resulting in 11,000 genomic regions. ChromHMM50 was used to perform chromatin state annotation with 200 bp bin size and 25 predicted chromatin states. The enrichment score showing for GUIDE-seq and CHANGE-seq was normalized by Cas-OFFinder, which was defined as (C/A)/(B/D), where C was the foreground overlapping bases (e.g., overlapping bases between GUIDE-seq and promoter state); A was the background overlapping bases (e.g., overlapped bases between Cas-OFFinder off-target sites and promoter state); B was the foreground size (e.g., number of bases in GUIDE-seq); D was the background size (i.e., number of bases in Cas-OFFinder). Enrichment of individual epigenetic feature in GUIDE-seq, CHANGE-seq and Cas-OFFinder was calculated using Welch’s t-test. Barplots were constructed using the Python library seaborn.
Genetic data analysis.
Genomes with alternate reference sequences were built by using bcftools consensus to apply GIAB or human T-cell whole genome-sequencing variant call files (VCF) samples to human genome reference hg38. VCF files were pre-filtered to exclude all variants that were not point mutations to avoid changing genomic coordinate systems between samples. CHANGE-seq read counts were averaged between technical replicates, median normalized, and filtered to the set of variant-containing sites. For each site, we fit a simple linear regression model of normalized read count by genotype, calculate an F-statistic and p-values, and used the Benjamini-Hochberg procedure to control the false discovery rate due to multiple testing.
Statistics.
Statistical analysis was performed in R or python. Each figure legend denotes the statistic used. All central tendencies and error bars indications are denoted in the figure legends. Statistical methods for each analysis noted above in respective analysis sections.
Data Availability
High-throughput sequencing data generated during the study (CHANGE-seq, GUIDE-seq, ATAC-seq, histone modification ChIP-seq) is available from NCBI Sequence Read Archive and Gene Expression Omnibus under accession numbers PRJNA625995 and GSE149295, respectively.
Extended Data
Extended Data Fig. 1. Detailed overview of CHANGE-seq method.
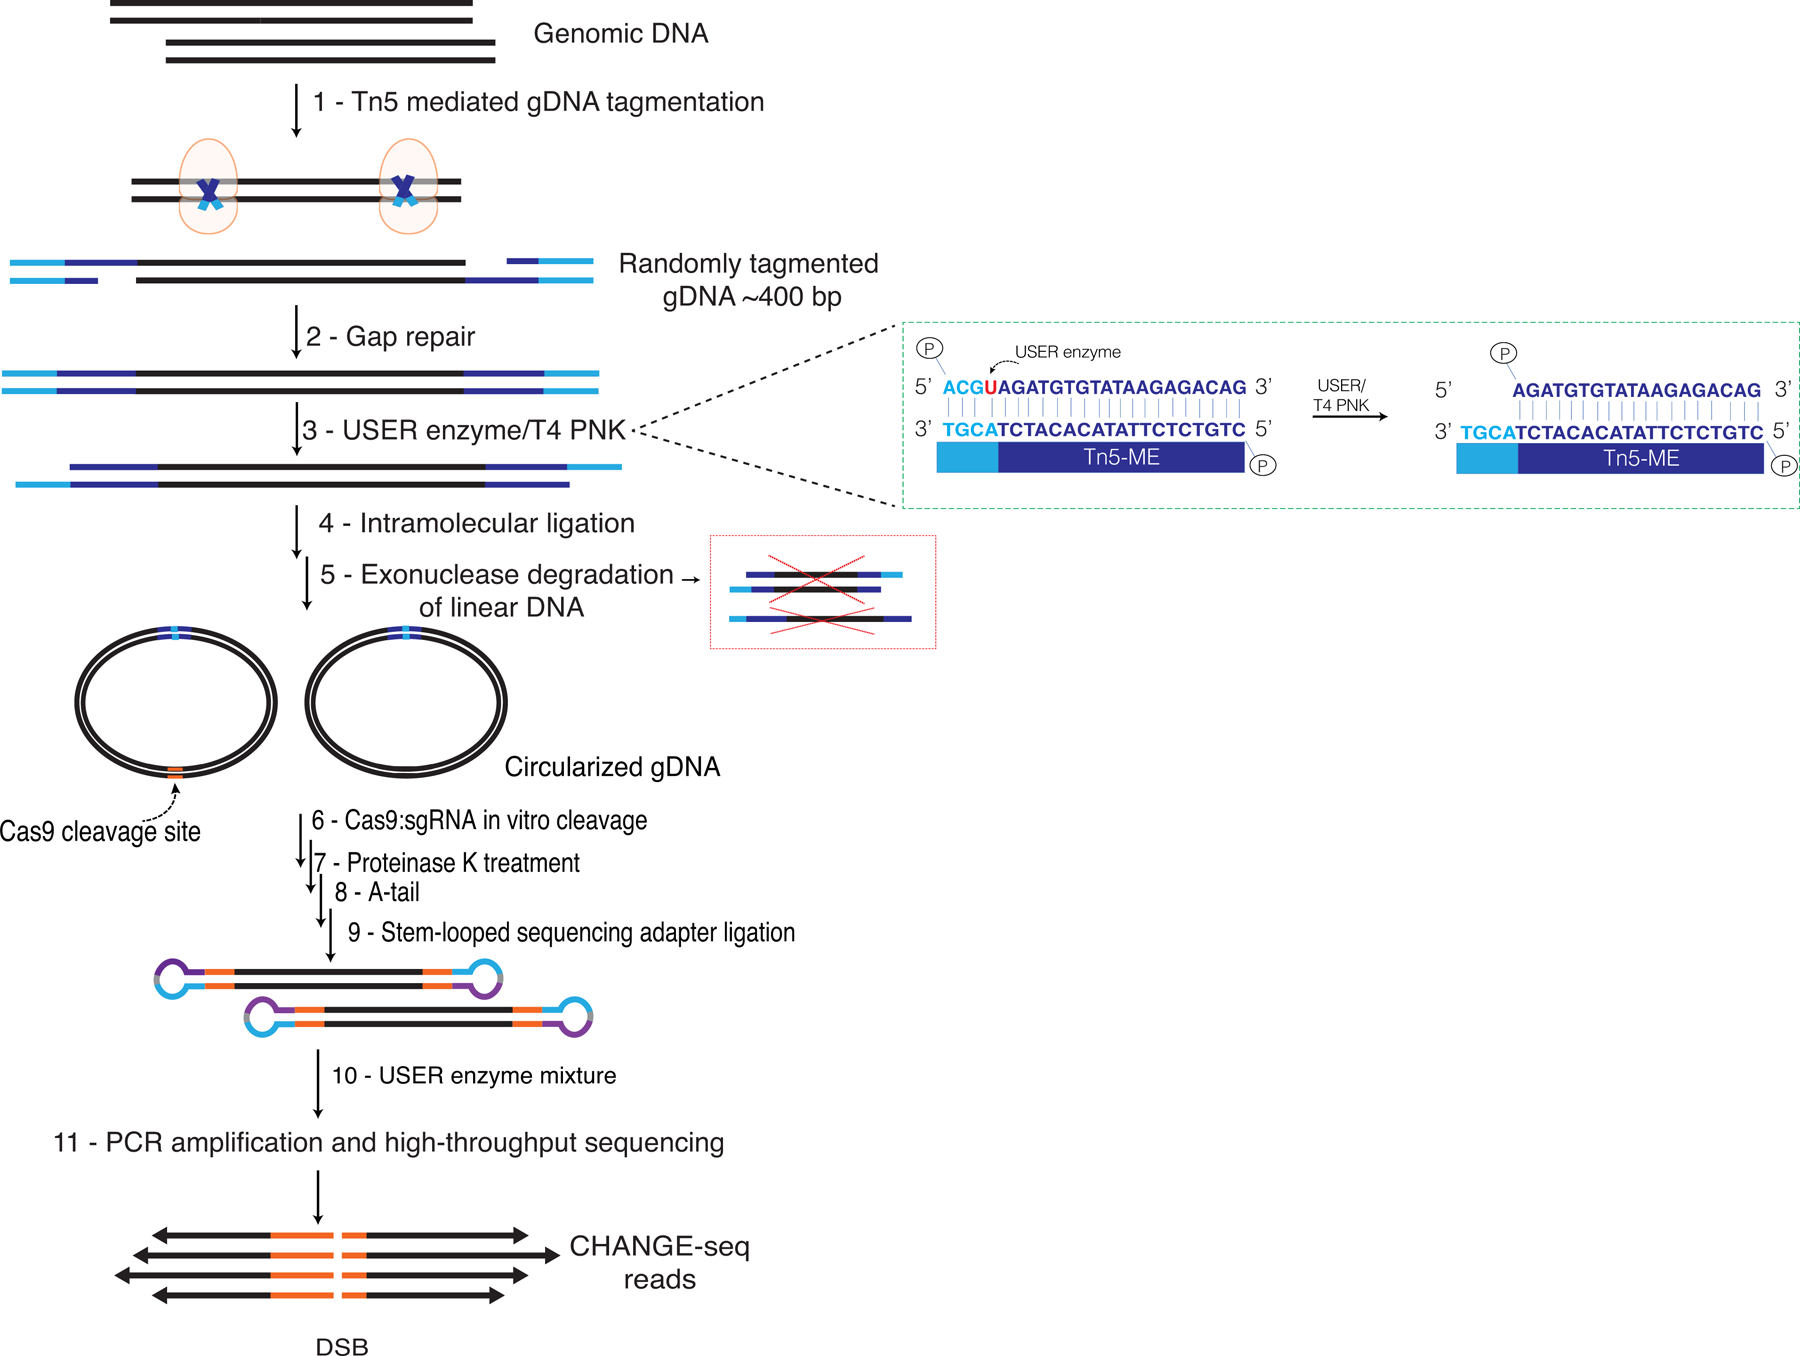
Genomic DNA is randomly tagmented to an average of ~400 bp with a custom Tn5-transposome with an uracil-containing adapter. 9-nt Tn5-generated gaps in the DNA are filled in with a high-fidelity uracil-tolerant U+ polymerase and sealed with Taq DNA ligase. 4 bp overhangs are released with a mixture of USER enzyme and T4 PNK. DNA molecules are circularized at low concentrations that favor intramolecular ligation. Unwanted linear DNA is degraded with an exonuclease cocktail (comprised of Exonuclease I, Lambda exonuclease and Plasmid-Safe ATP-dependent DNase). Purified circular DNA is treated with Cas9:sgRNA RNP and cleaved DNA ends at on- and off-target sites are released for NGS library preparation, PCR amplification, and pair-end high-throughput sequencing.
Extended Data Fig. 2. Schematic comparison of CIRCLE-seq and CHANGE-seq workflows.
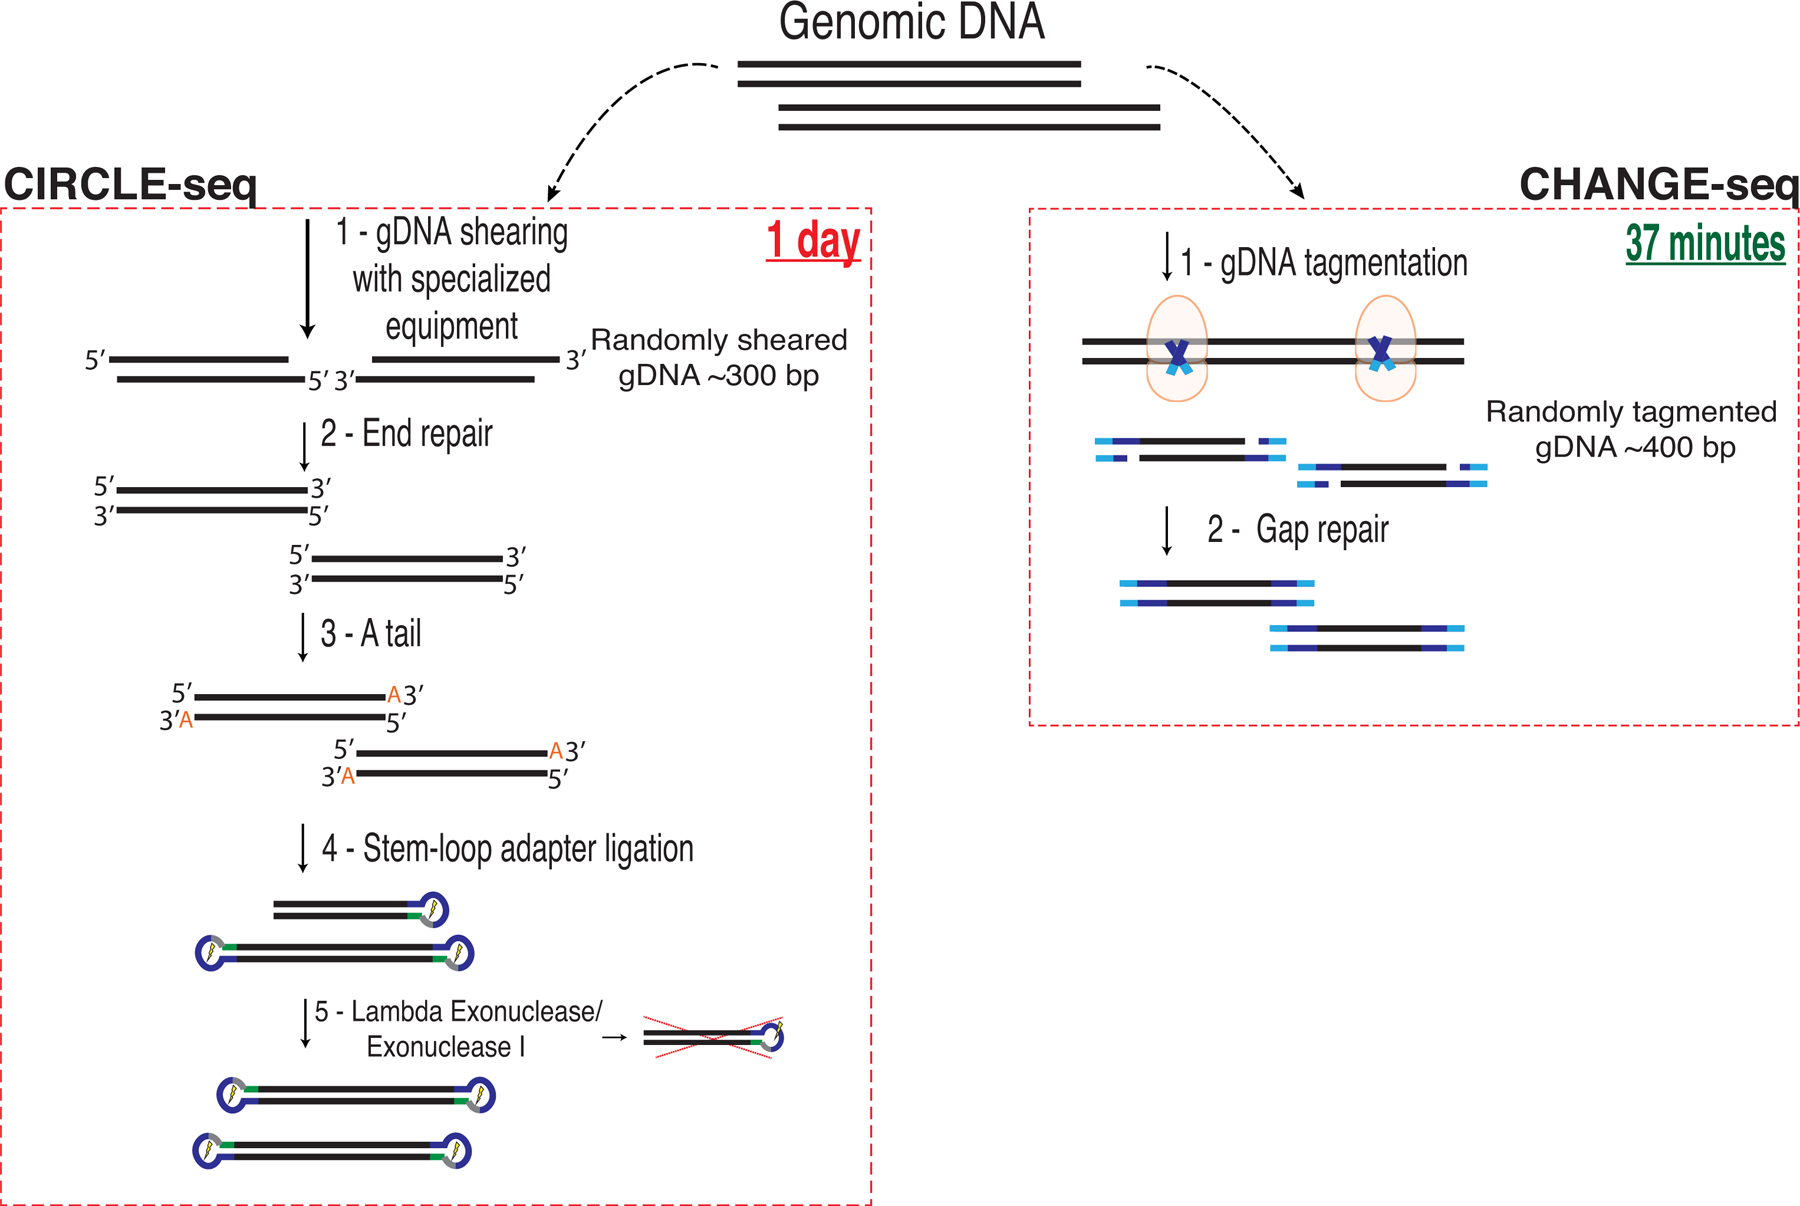
CHANGE-seq eliminates the requirement for specialized equipment for physical DNA shearing along with 9 additional enzymatic or purification steps. The simplified workflow substantially streamlines the process, decreases the requirement of input genomic DNA for circularization by approximately 5-fold and reduces the number of reactions to process each sample by 10- to 20-fold to a single reaction per sample.
Extended Data Fig. 3. CHANGE-seq detects all or nearly all sites detected by GUIDE-seq.
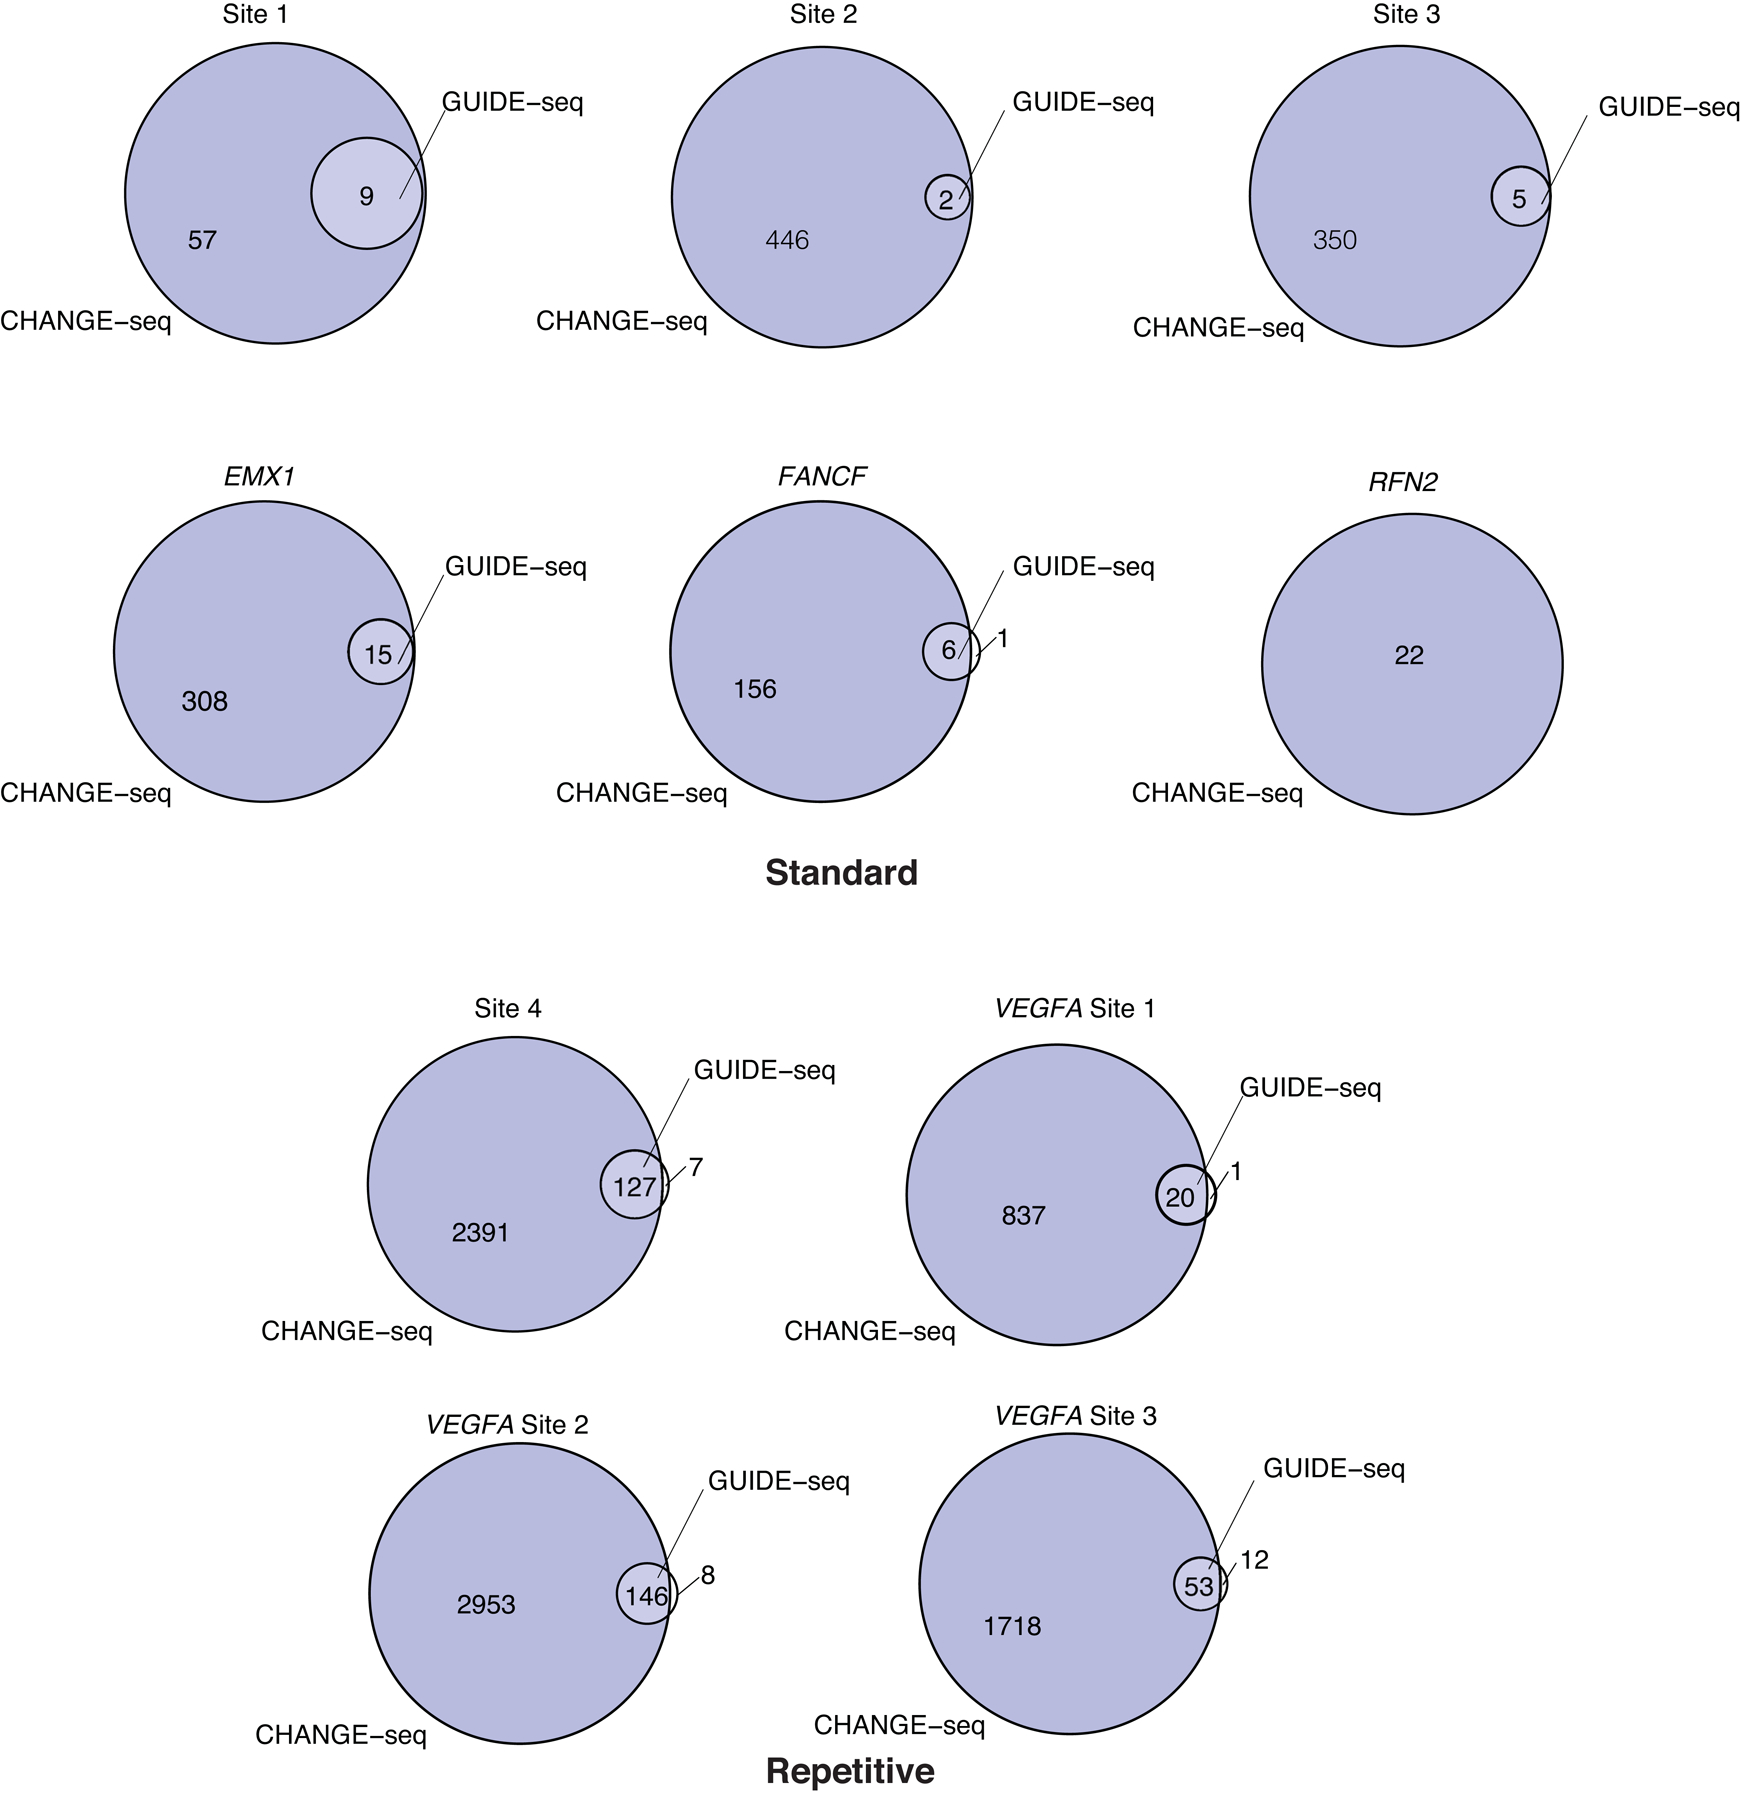
Venn diagrams showing the number of overlapping off-target sites captured by CHANGE-seq (blue) and GUIDE-seq (clear). The top six comparisons are of standard targets; the bottom four comparisons are of repetitive targets commonly used to benchmark genome-wide off-target activity detection methods.
Extended Data Fig. 4. GUIDE-seq optimization for human primary CD4+/CD8+T-cells.
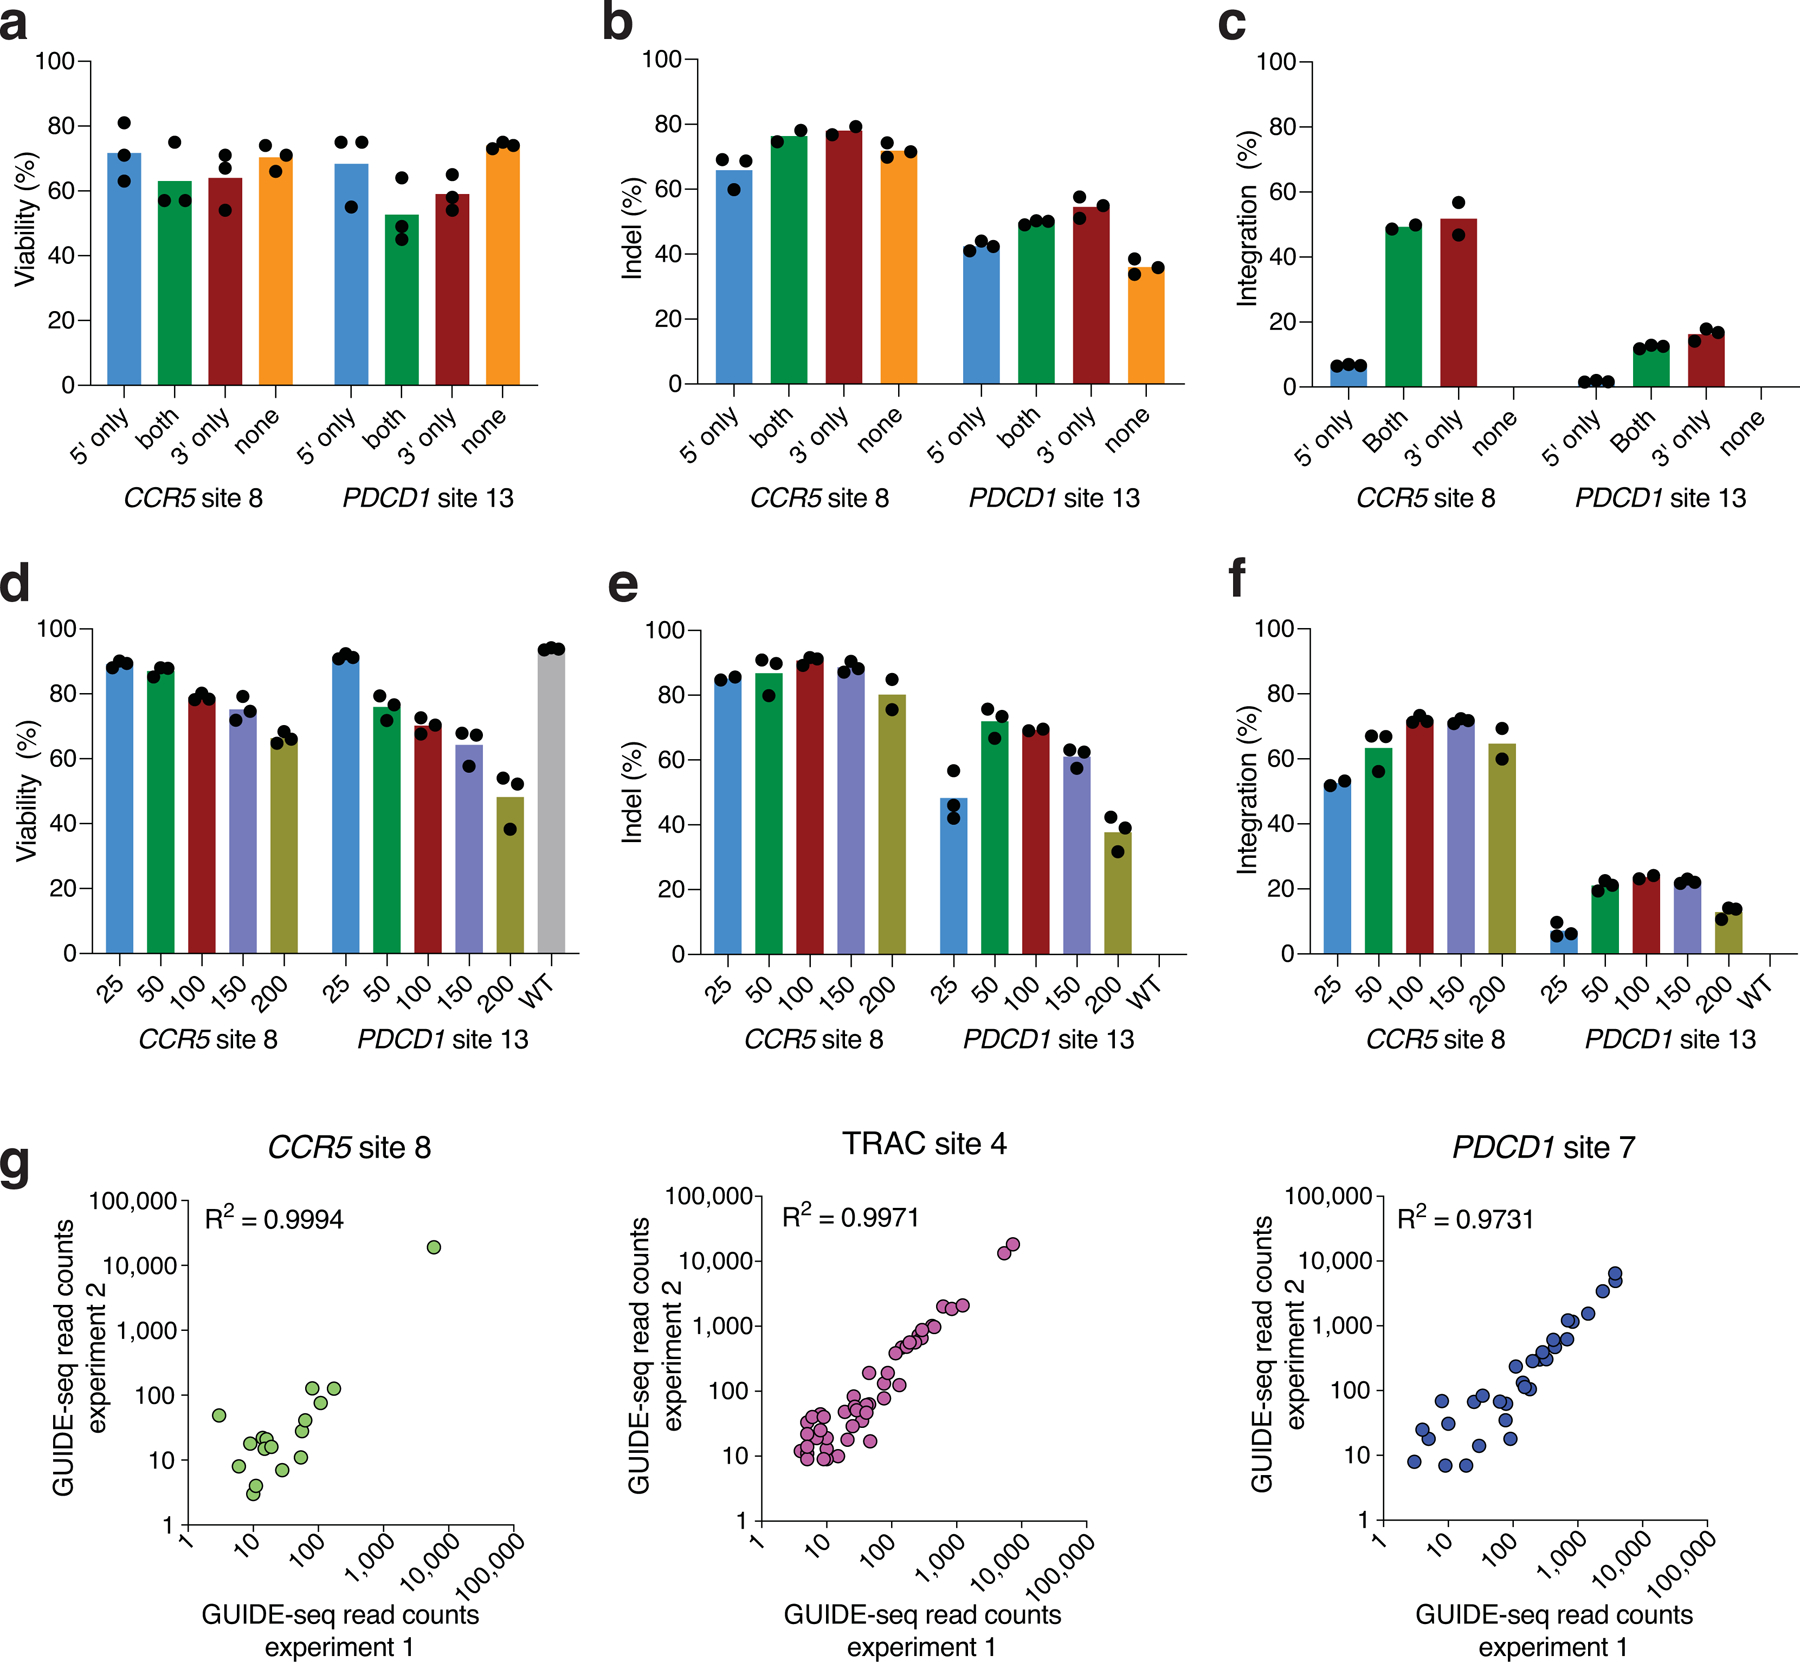
a, Viability of cell population assessed by FACS analysis with DAPI staining 3 days post nucleofection with dsODN with phosphorothioate modifications at 5’ end, 3’ end, both ends or without dsODN (n=3). b, Indel rates at the intended target sites 3 days post nucleofection with dsODN with phosphorothioate modifications modifications at 5’ end, 3’ end, both ends or without dsODN (n=3). c, Integration rates of dsODNs with phosphorothioate modifications at 5’ end, 3’ end, both ends or without dsODN (n=3). d, Viability of cell population assessed by FACS analysis with DAPI staining 3 days post nucleofection with different doses of dsODN with 3’ end modifications (n=3). e, Indels rates at the intended target sites 3 days post nucleofection with different doses of dsODN with 3’ end modifications (n=3). f, dsODN integration rates 3 days post nucleofection with different doses of dsODN with 3’ end modifications (n=3). g, Scatterplots of GUIDE-seq read counts (log scale) between two independently prepared GUIDE-seq libraries for 3 target sites, showing GUIDE-seq technical reproducibility. Correlation between two samples was calculated using Pearson’s correlation coefficient.
Extended Data Fig. 5. Detailed characterization of a specific and active sgRNA targeting the TRAC region.
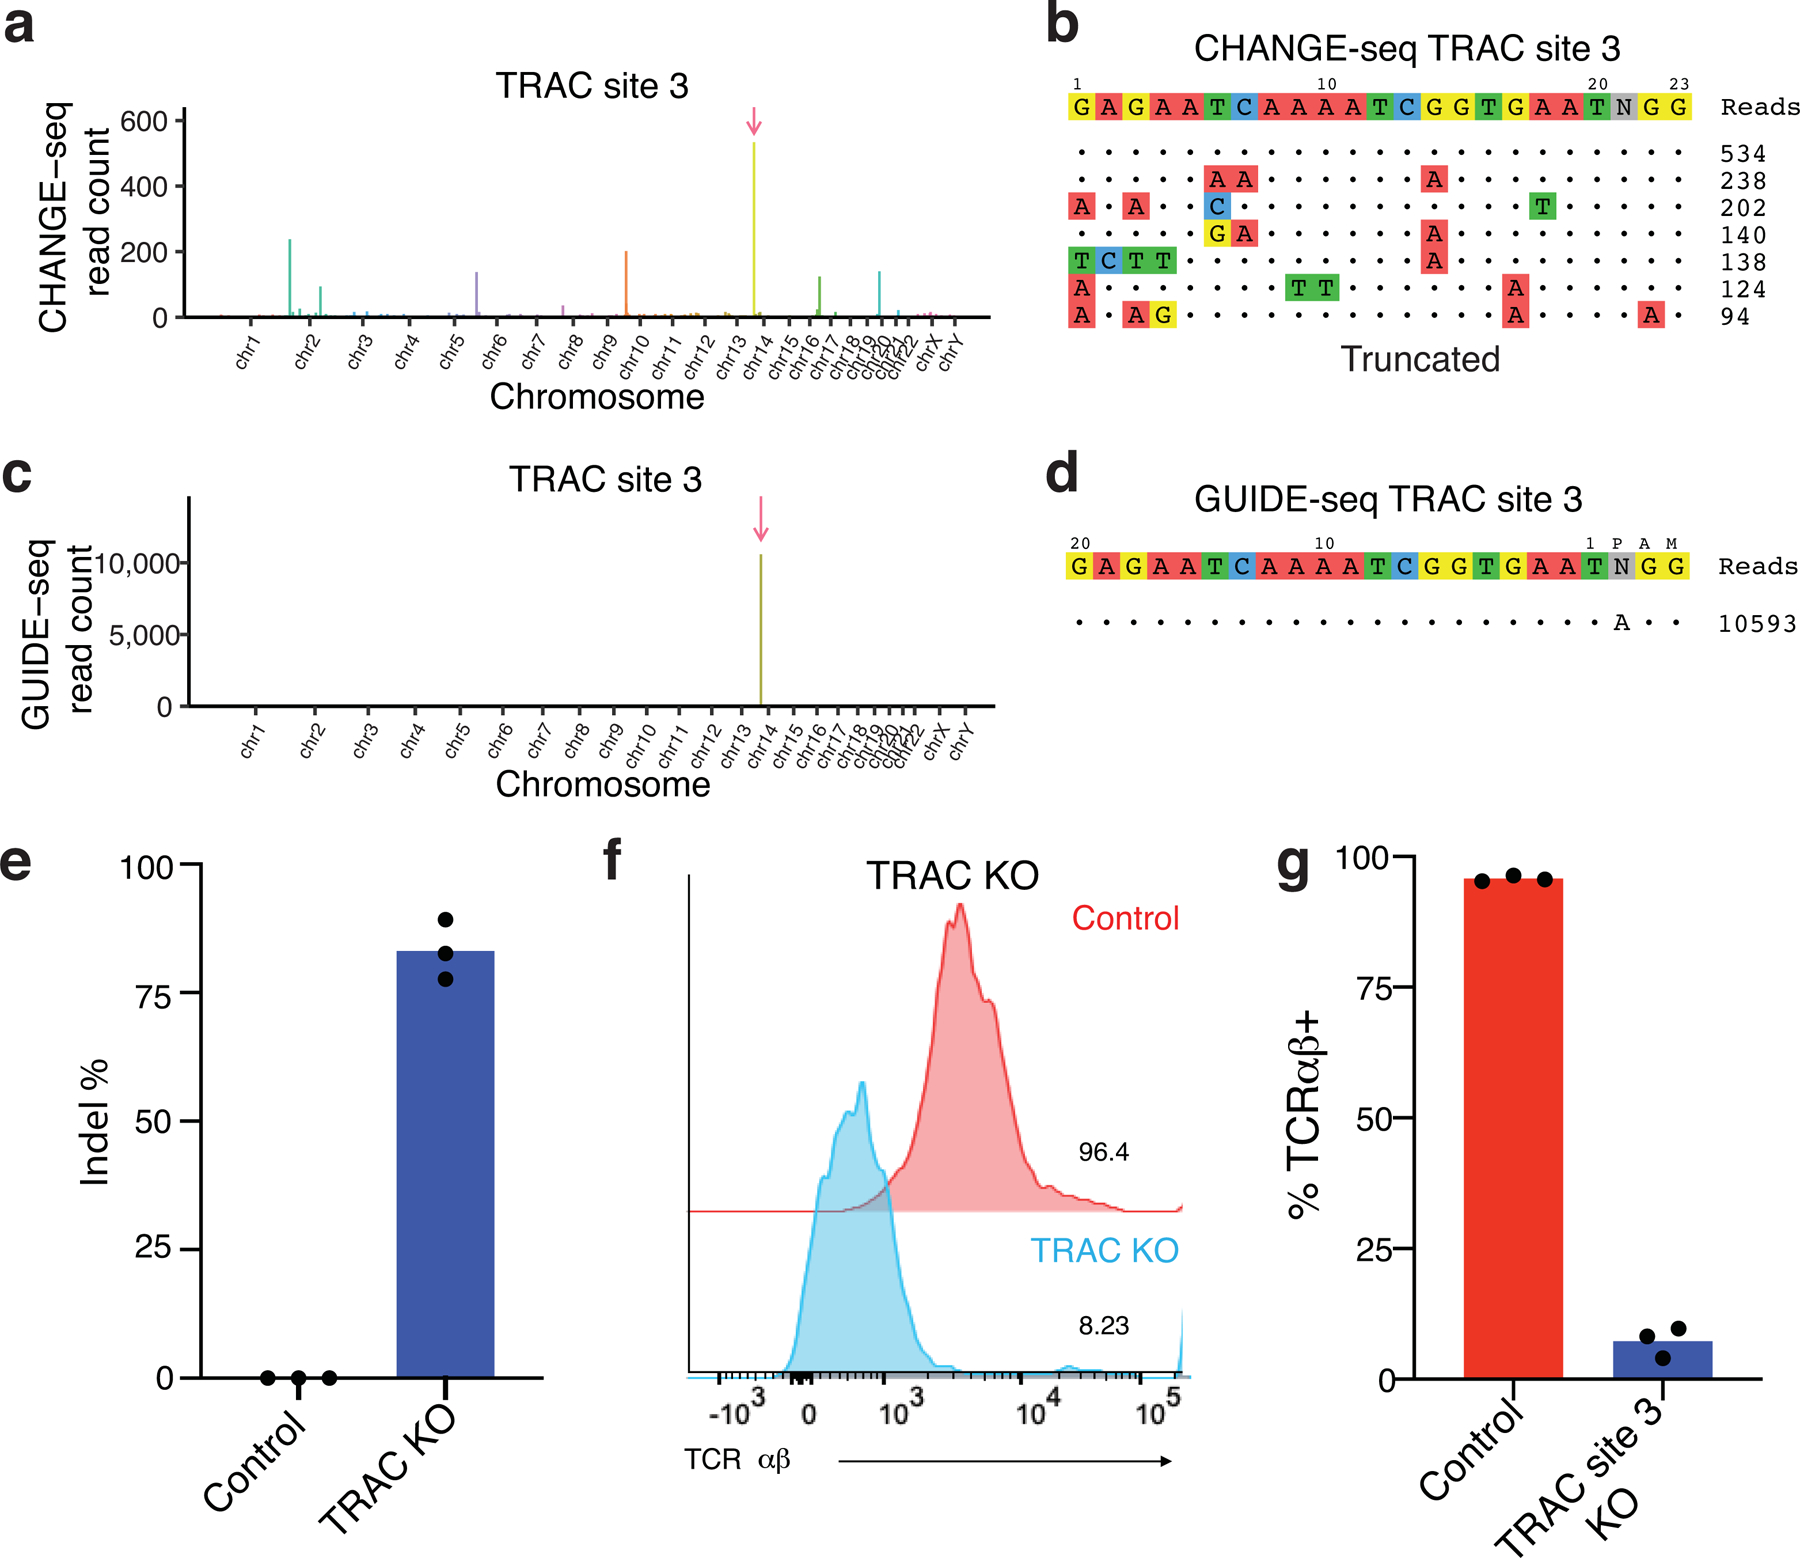
a, Manhattan plot showing the genome-wide distribution of sites identified in vitro by CHANGE-seq (arrow indicates the on-target site). b, Visualization of sites detected by CHANGE-seq. The intended target sequence is shown in the top line. Cleaved sites (on- and off-target) are shown underneath and are ordered top to bottom by CHANGE-seq read count, with mismatches to the intended target sequence indicated by colored nucleotides. Note that output is truncated to top sites with a full listing in Supplementary Table 4. c, Manhattan plot showing the on-target site detected for TRAC site 3 by GUIDE-seq, with no off-target sites being identified (arrow indicates the on-target site). d, Visualization of sites detected by GUIDE-seq. e, Indels rates at the intended target site 3 days post nucleofection (n=3). f, Flow plot showing distribution of TCR αβ expression in control (red) versus cells edited with sgRNA targeting TRAC site 3 (light blue). These experiments were performed three times with similar results. g, Barplot showing the percentage of TCR disruption 14 days after nucleofection with sgRNA:Cas9 complex measured by flow cytometry analysis (n=3).
Extended Data Fig. 6. GUIDE-seq dsODN tag independent indel frequencies are strongly correlated with tag integration frequencies.
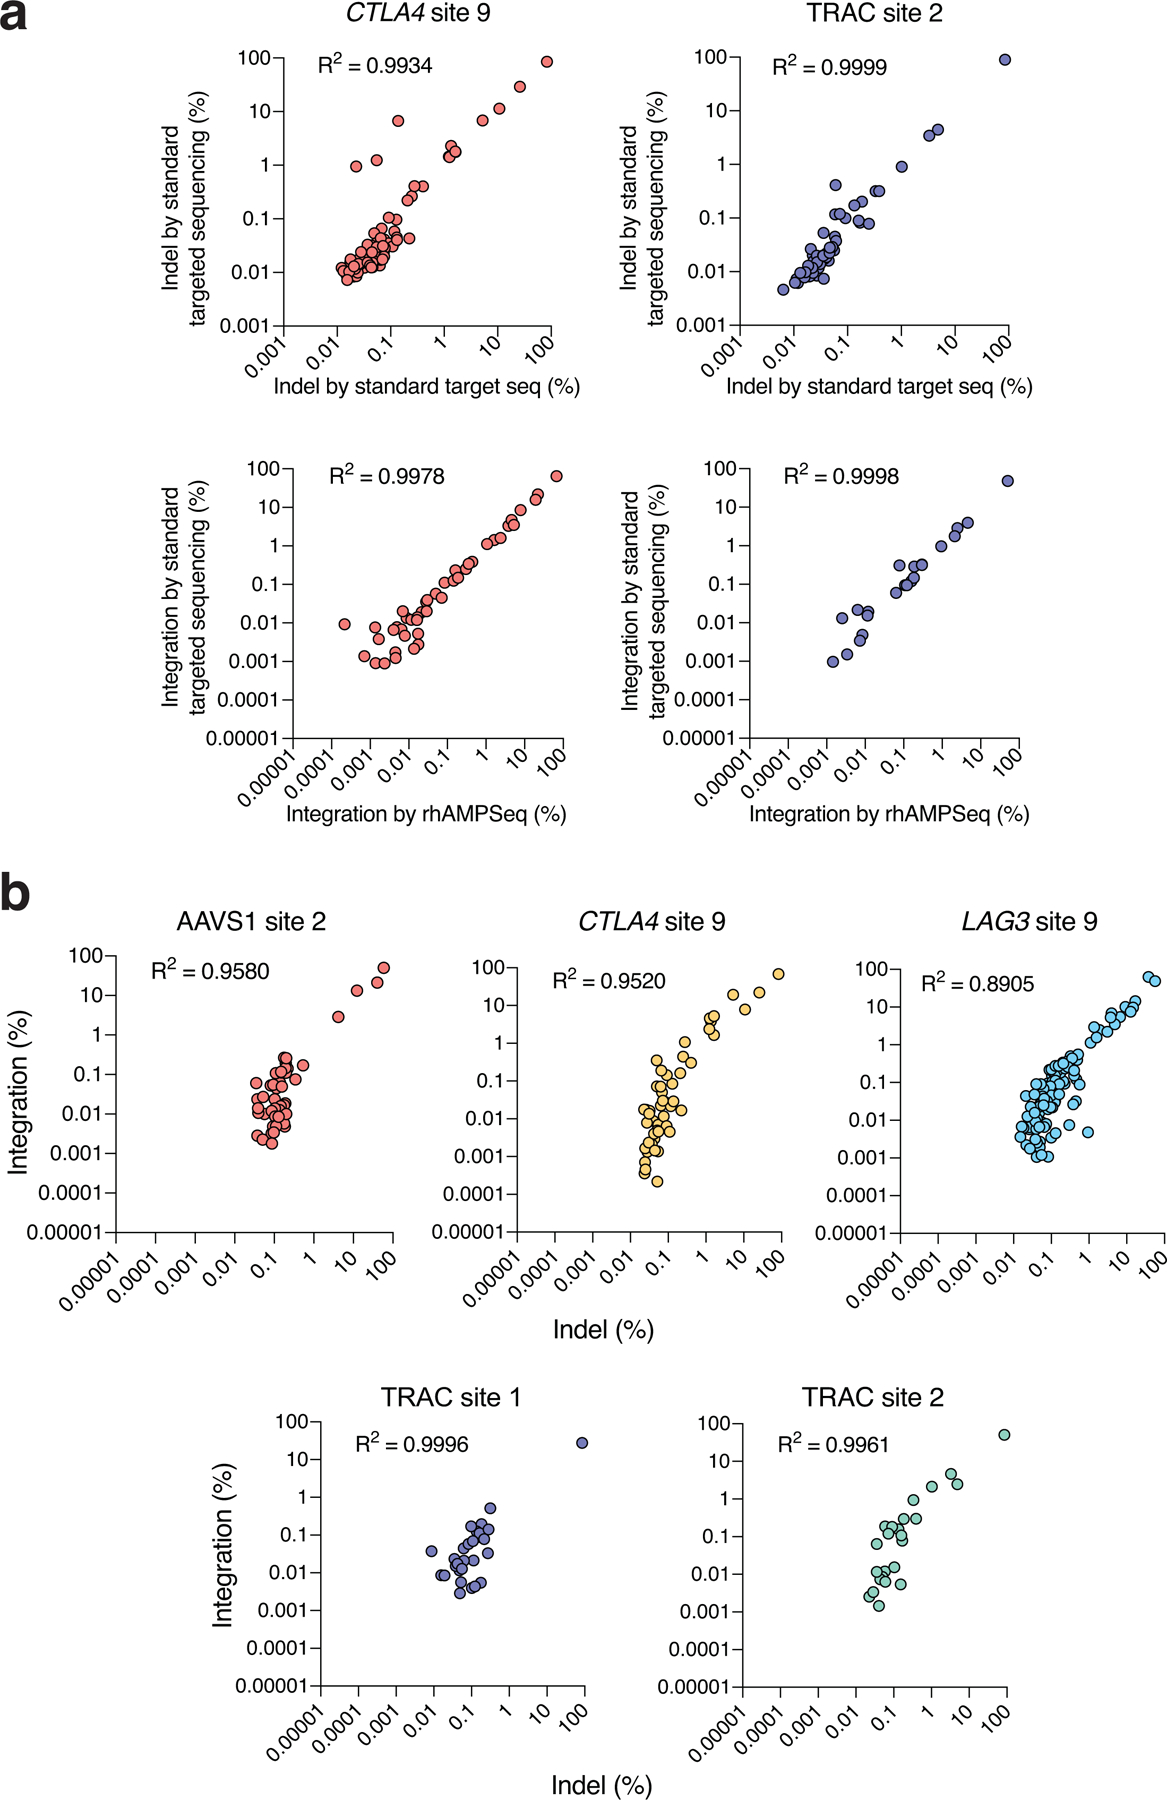
Comparison of standard targeted sequencing and rhAMPSeq, a multiplex targeted sequencing method used in our study to validate on- and off-target site mutations. Scatterplots of indel mutation frequencies (top) and tag integration frequencies (bottom), between standard amplicon sequencing and rhAMPSeq, for sgRNAs targeted against CTLA4 site 9 and TRAC site 2 (See Methods). b, Scatterplots showing correlation between indel frequencies (in cells edited with Cas9 RNPs and no dsODN tag) and tag integration frequencies (in cells edited with Cas9 RNP and dsODN tag) at on- and off-target sites measured by targeted amplicon sequencing. (a-b) Correlation between two samples was calculated using Pearson’s correlation coefficient.
Extended Data Fig. 7. Targeted tag sequencing validation of CHANGE-seq detected off-target sites.
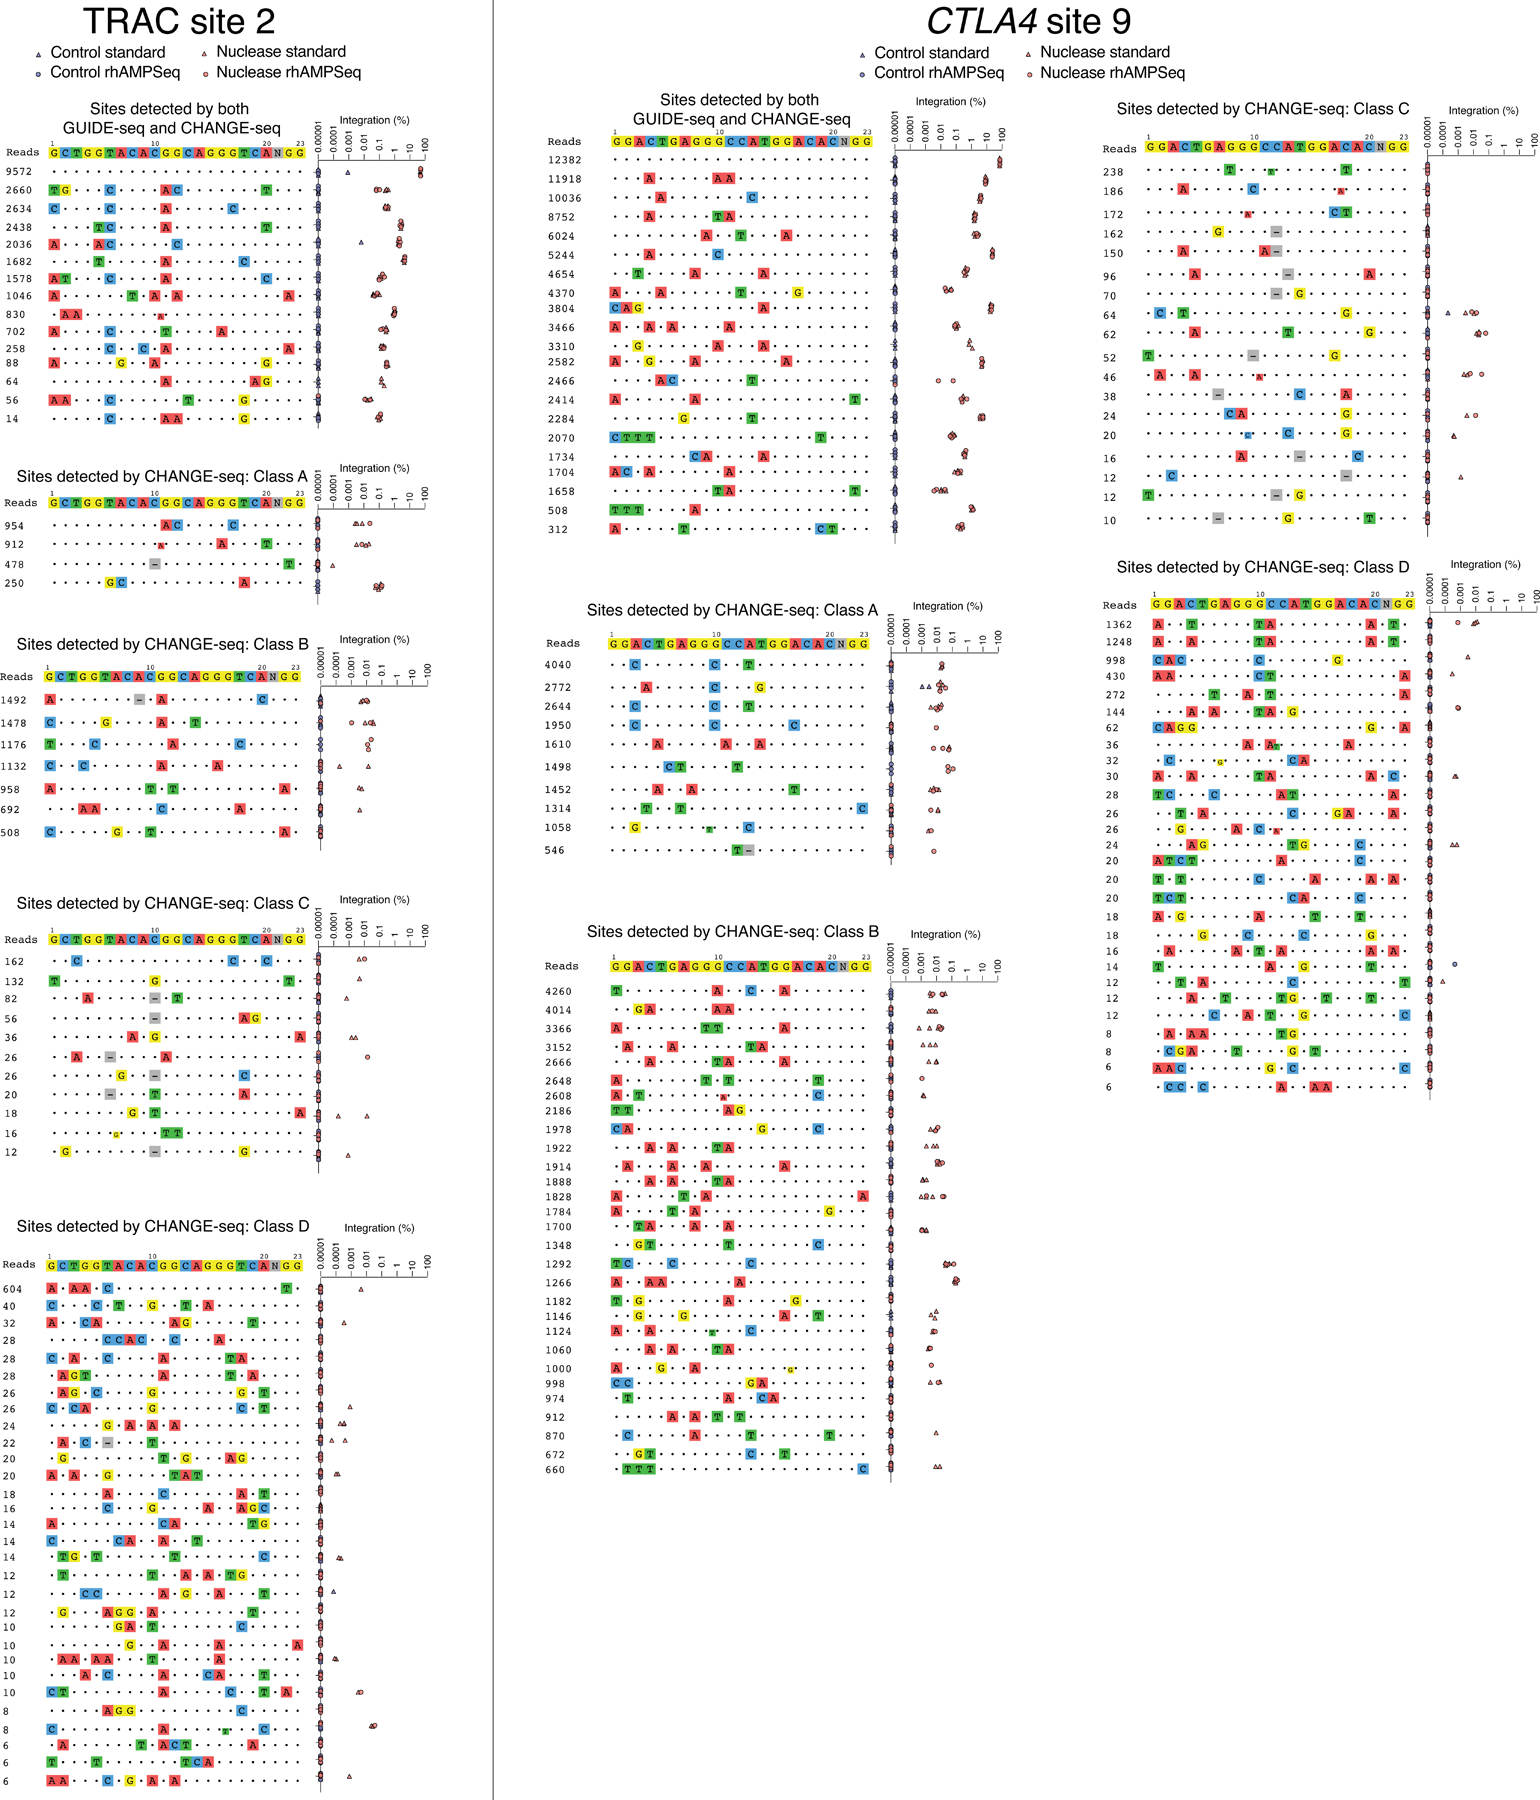
Targeted tag integration frequencies evaluated by standard targeted sequencing (triangle shape) and or rhAMPSeq (circle shape) (See Methods) at on- and off-target sites detected by both GUIDE-seq and CHANGE-seq, or detected by CHANGE-seq only (classes A-D), for sgRNAs targeted to TRAC site 2 and CTLA4 site 9. Panels for sites identified by both GUIDE-seq and CHANGE-seq and classes A and B for TRAC site 2 duplicated from main Fig. 4f for completeness.
Extended Data Fig. 8. GUIDE-seq read counts are strongly correlated with indel and tag integration frequencies in human primary T-cells.
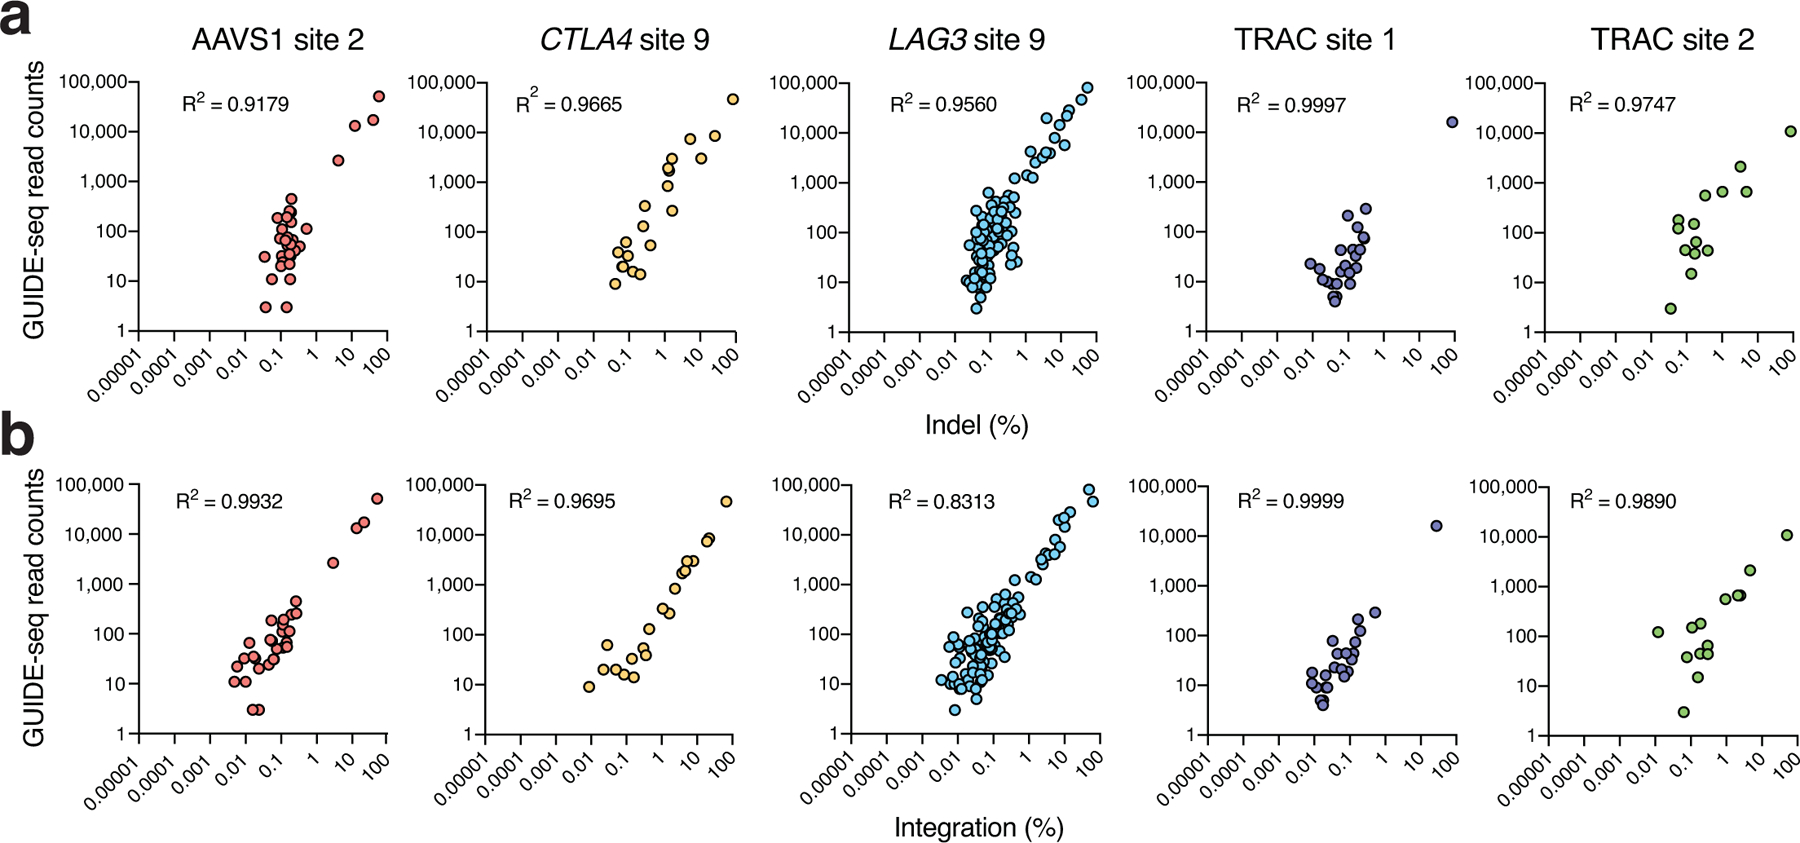
a, Scatterplots showing correlation between indel frequencies and GUIDE-seq read counts at on- and off-target sites, and b, tag integration and GUIDE-seq read counts at on- and off-target sites. (a-b) Correlation between two samples was calculated using Pearson’s correlation coefficient.
Extended Data Fig. 9. Influence of chromatin state on CRISPR-Cas9 genome-wide off-target activity.
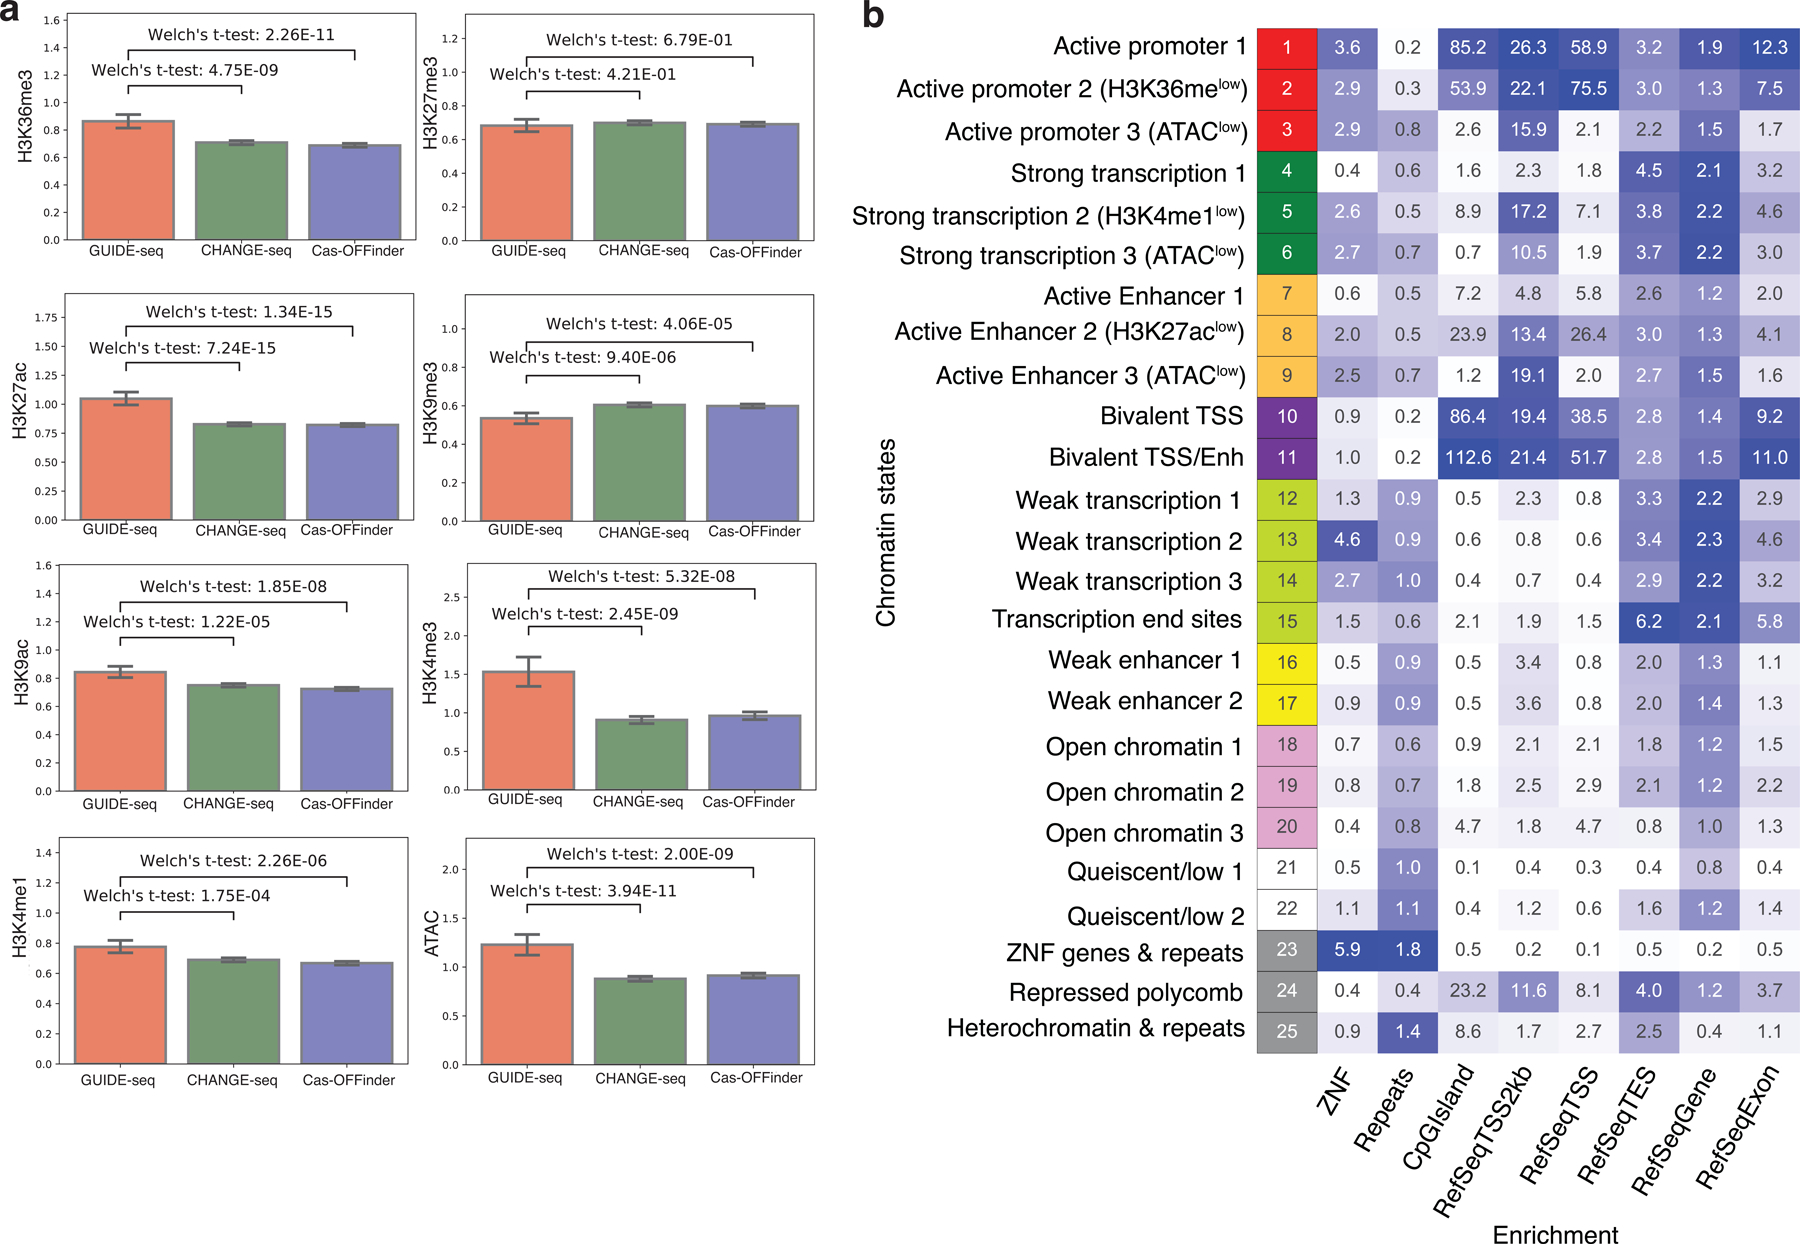
a, Barplots showing the enrichment of individual epigenetic feature in GUIDE-seq (n=1,196), CHANGE-seq (n=11,000) and Cas-OFFinder (n=11,000). Statistical significance was calculated using two-tailed Welch’s t-test. Error bars indicate 95% confidence interval, estimated from 1000 bootstrap samples. b, Heatmap showing fold enrichment for various genomic annotations computed by ChromHMM for validation of chromatin state annotations. Darker colors represent higher fold enrichment.
Extended Data Fig. 10. CHANGE-seq enables detection of effects of individual genetic variation on genome-wide activity of genome editors.
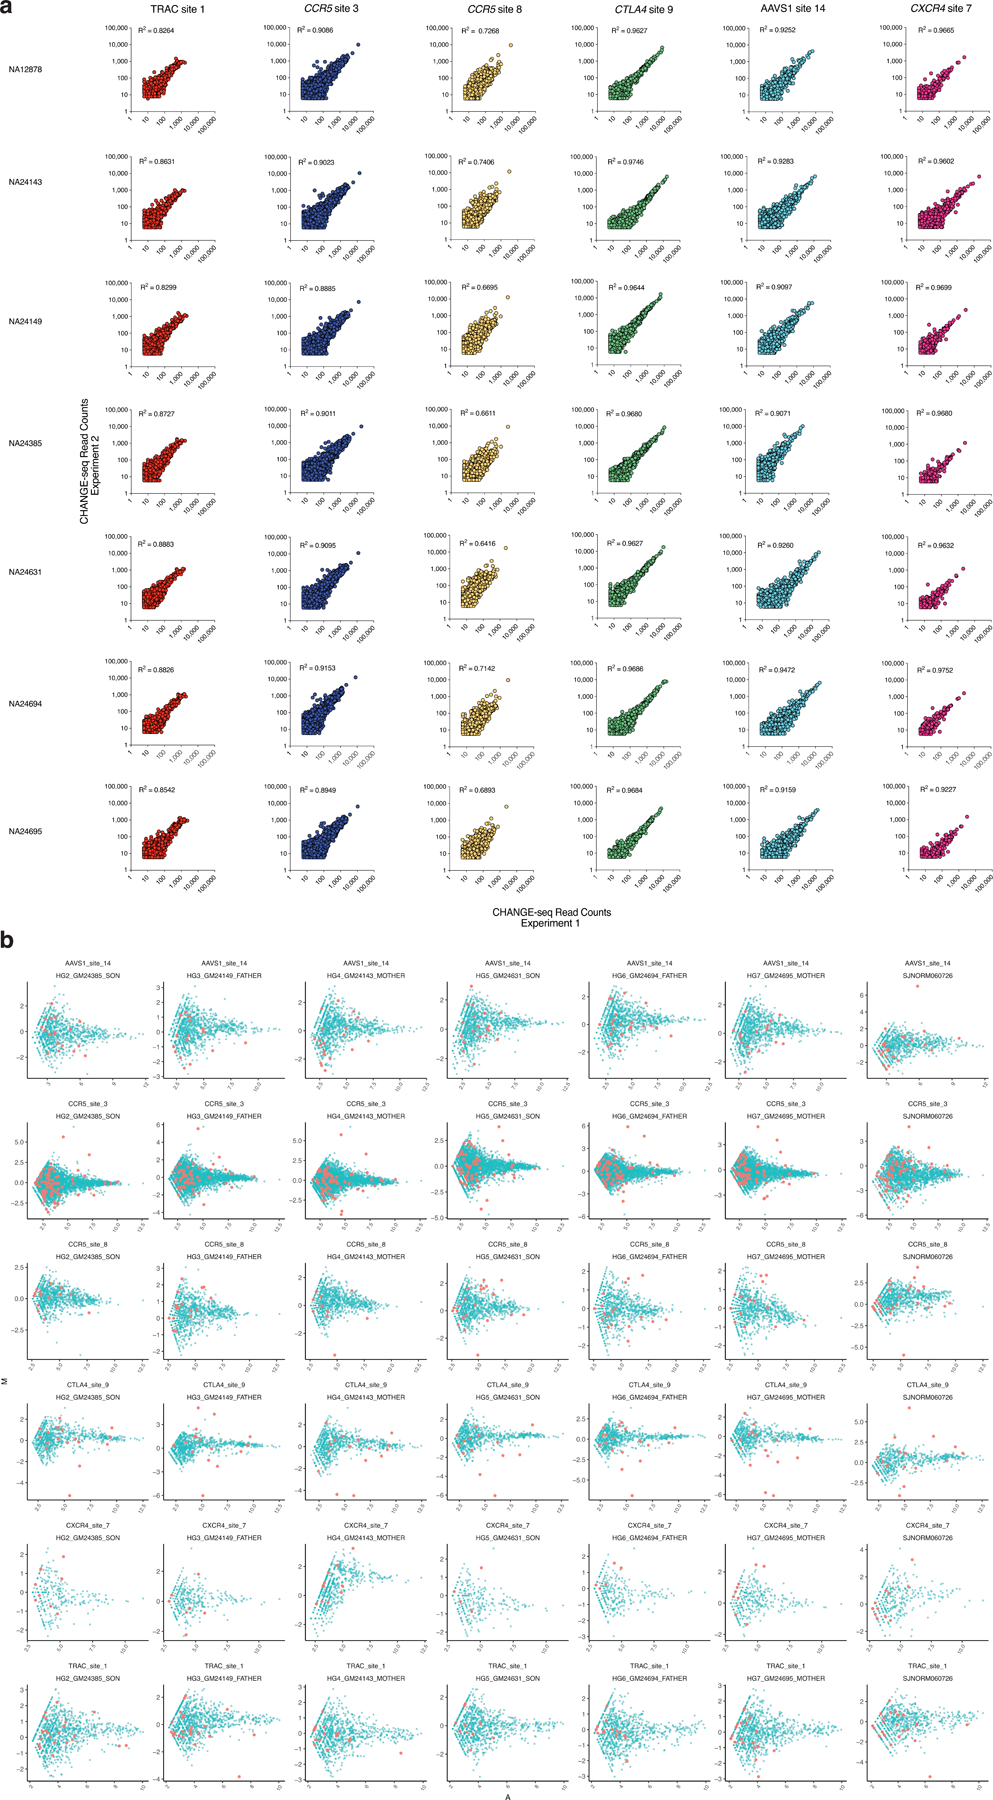
a, Scatterplots of CHANGE-seq read counts (log scale) between two CHANGE-seq libraries independently prepared from the same source of genomic DNA, evaluating 6 target sites in 7 different genomes, showing that CHANGE-seq is highly reproducible. Correlation between two samples was calculated using Pearson’s correlation coefficient. b, Pairwise M/A plots for visualizing read count differences. The ratio (M) versus the average (A) of CHANGE-seq read counts (log scale) performed on the indicated GIAB or human T-cell sample versus a GM12878 GIAB reference sample. Each point represents an off-target site, and off-target sites that contain a non-reference single-nucleotide variant (SNV) are labelled in red.
Supplementary Material
Acknowledgements
We thank Y. Chao from the St. Jude Protein Production Core Facility for recombinant Tn5 production, G. Wu for variant calling, and S. Olsen from the St. Jude Hartwell Center for whole genome sequencing and RNA-seq, and J. Zook for discussions on Genome-in-a-bottle data. Standard mapping and variant calling were performed by the Center for Applied Bioinformatics, a centralized shared resource, partly funded by NIH award P30CA021765. This work was supported by St. Jude Children’s Research Hospital and ALSAC, National Institutes of Health Common Fund Somatic Cell Genome Editing award U01EB029373 (to S.Q.T.), St. Jude Children’s Research Hospital Collaborative Research Consortium on Novel Gene Therapies for Sickle Cell Disease (SCD) and the Doris Duke Charitable Foundation (2017093). E.S acknowledges support under the Cooperative Research Agreement between the University of Maryland and the National Institute of Standards and Technology Center for Nanoscale Science and Technology, Award 70NANB14H209, through the University of Maryland.
Footnotes
NIST disclaimer: Selected commercial equipment, instruments or materials are identified to specify the adequacy of experimental conditions or reported results. Such identification does not imply recommendation or endorsement by the National Institute of Standards and Technology, nor does it imply that the equipment, instruments or materials identified are necessarily the best available for the purpose.
Open-source code for analyzing CHANGE-seq or CIRCLE-seq (https://github.com/tsailabSJ/changeseq), GUIDE-seq (https://github.com/aryeelab/guideseq), and performing related machine learning analysis (https://github.com/ma-compbio/ChangeLocator) are available through the GitHub.
Competing Interests Statement
C.R.L. and S.Q.T. have filed a patent application on CHANGE-seq. S.Q.T. is a co-inventor on patents covering CIRCLE-seq and GUIDE-seq. S.Q.T. is a member of the scientific advisory board of Kromatid.
References
- 1.Jinek M et al. A Programmable dual-RNA–guided DNA endonuclease in adaptive bacterial immunity. Science 337, 816–821 (2012). [DOI] [PMC free article] [PubMed] [Google Scholar]
- 2.Mali P et al. RNA-guided human genome engineering via Cas9. Science 339, 823–826 (2013). [DOI] [PMC free article] [PubMed] [Google Scholar]
- 3.Cong L et al. Multiplex genome engineering using CRISPR/Cas systems. Science 339, 819–823 (2013). [DOI] [PMC free article] [PubMed] [Google Scholar]
- 4.Eyquem J et al. Targeting a CAR to the TRAC locus with CRISPR/Cas9 enhances tumour rejection. Nature 543, 113 (2017). [DOI] [PMC free article] [PubMed] [Google Scholar]
- 5.Hacein-Bey-Abina S et al. LMO2-associated clonal T cell proliferation in two patients after gene therapy for SCID-X1. Science 302, 415–419 (2003). [DOI] [PubMed] [Google Scholar]
- 6.Kleinstiver BP et al. High-fidelity CRISPR–Cas9 nucleases with no detectable genome-wide off-target effects. Nature 529, 490–495 (2016). [DOI] [PMC free article] [PubMed] [Google Scholar]
- 7.Slaymaker I et al. Rationally engineered Cas9 nucleases with improved specificity. Science 351, 84 (2016). [DOI] [PMC free article] [PubMed] [Google Scholar]
- 8.Kocak DD et al. Increasing the specificity of CRISPR systems with engineered RNA secondary structures. Nat. Biotechnol 37, 657–666 (2019). [DOI] [PMC free article] [PubMed] [Google Scholar]
- 9.Vakulskas CA et al. A high-fidelity Cas9 mutant delivered as a ribonucleoprotein complex enables efficient gene editing in human hematopoietic stem and progenitor cells. Nat. Med 24, 1216–1224 (2018). [DOI] [PMC free article] [PubMed] [Google Scholar]
- 10.Chen JS et al. Enhanced proofreading governs CRISPR–Cas9 targeting accuracy. Nature (2017). 10.1038/nature24268 [DOI] [PMC free article] [PubMed]
- 11.Fu Y et al. High-frequency off-target mutagenesis induced by CRISPR-Cas nucleases in human cells. Nat. Biotechnol 31, 822–826 (2013). [DOI] [PMC free article] [PubMed] [Google Scholar]
- 12.Tsai SQ et al. GUIDE-seq enables genome-wide profiling of off-target cleavage by CRISPR-Cas nucleases. Nat. Biotechnol 33, 187 (2015). [DOI] [PMC free article] [PubMed] [Google Scholar]
- 13.Anderson KR et al. CRISPR off-target analysis in genetically engineered rats and mice. Nat. Methods 1 (2018). 10.1038/s41592-018-0011-5 [DOI] [PMC free article] [PubMed] [Google Scholar]
- 14.Cradick TJ, Fine EJ, Antico CJ & Bao G CRISPR/Cas9 systems targeting β-globin and CCR5 genes have substantial off-target activity. Nucleic Acids Res 41, 9584–9592 (2013). [DOI] [PMC free article] [PubMed] [Google Scholar]
- 15.Hsu PD et al. DNA targeting specificity of RNA-guided Cas9 nucleases. Nat. Biotechnol 31, nbt.2647 (2013). [DOI] [PMC free article] [PubMed] [Google Scholar]
- 16.Xie K & Yang Y RNA-guided genome editing in plants using a CRISPR–Cas system. Mol. Plant 6, 1975–1983 (2013). [DOI] [PubMed] [Google Scholar]
- 17.Cho S et al. Analysis of off-target effects of CRISPR/Cas-derived RNA-guided endonucleases and nickases. Genome Res 24, 132–141 (2014). [DOI] [PMC free article] [PubMed] [Google Scholar]
- 18.Crosetto N et al. Nucleotide-resolution DNA double-strand break mapping by next-generation sequencing. Nat. Methods 10, 361–365 (2013). [DOI] [PMC free article] [PubMed] [Google Scholar]
- 19.Yan WX et al. BLISS is a versatile and quantitative method for genome-wide profiling of DNA double-strand breaks. Nat. Commun 8, 15058 (2017). [DOI] [PMC free article] [PubMed] [Google Scholar]
- 20.Wang X et al. Unbiased detection of off-target cleavage by CRISPR-Cas9 and TALENs using integrase-defective lentiviral vectors. Nat. Biotechnol 33, 175–178 (2015). [DOI] [PubMed] [Google Scholar]
- 21.Frock RL et al. Genome-wide detection of DNA double-stranded breaks induced by engineered nucleases. Nat. Biotechnol 33, 179–186 (2015). [DOI] [PMC free article] [PubMed] [Google Scholar]
- 22.Hu J et al. Detecting DNA double-stranded breaks in mammalian genomes by linear amplification-mediated high-throughput genome-wide translocation sequencing. Nat. Protoc 11, 853–871 (2016). [DOI] [PMC free article] [PubMed] [Google Scholar]
- 23.Wienert B et al. Unbiased detection of CRISPR off-targets in vivo using DISCOVER-Seq. Science 364, 286–289 (2019). [DOI] [PMC free article] [PubMed] [Google Scholar]
- 24.Kim D et al. Digenome-seq: genome-wide profiling of CRISPR-Cas9 off-target effects in human cells. Nat. Methods 12, 237–243 (2015). [DOI] [PubMed] [Google Scholar]
- 25.Cameron P et al. Mapping the genomic landscape of CRISPR-Cas9 cleavage. Nat. Methods 14, 600–606 (2017). [DOI] [PubMed] [Google Scholar]
- 26.Tsai SQ et al. CIRCLE-seq: a highly sensitive in vitro screen for genome-wide CRISPR-Cas9 nuclease off-targets. Nat. Methods 14, 607–614 (2017). [DOI] [PMC free article] [PubMed] [Google Scholar]
- 27.Lazzarotto CR et al. Defining CRISPR–Cas9 genome-wide nuclease activities with CIRCLE-seq. Nat. Protoc 13 (2018). 10.1038/s41596-018-0055-0 [DOI] [PMC free article] [PubMed] [Google Scholar]
- 28.Berg D, Davies J, let & Rochaix J Transposition of R factor genes to bacteriophage lambda. Proc. Natl. Acad. Sci 72, 3628–3632 (1975). [DOI] [PMC free article] [PubMed] [Google Scholar]
- 29.Reznikoff WS Transposon Tn5. Annu. Rev. Genet 42, 269–286 (2008). [DOI] [PubMed] [Google Scholar]
- 30.Adey A et al. Rapid, low-input, low-bias construction of shotgun fragment libraries by high-density in vitro transposition. Genome Biol 11, R119 (2010). [DOI] [PMC free article] [PubMed] [Google Scholar]
- 31.Friedman JH Greedy function approximation: A gradient boosting machine. Ann. Statistics 29, (2001). [Google Scholar]
- 32.Nishimasu H et al. Crystal structure of Cas9 in complex with guide RNA and target DNA. Cell 156, 935–949 (2014). [DOI] [PMC free article] [PubMed] [Google Scholar]
- 33.Horlbeck MA et al. Nucleosomes impede Cas9 access to DNA in vivo and in vitro. Elife 5, e12677 (2016). [DOI] [PMC free article] [PubMed] [Google Scholar]
- 34.Yarrington RM, Verma S, Schwartz S, Trautman JK & Carroll D Nucleosomes inhibit target cleavage by CRISPR-Cas9 in vivo. Proc. Natl. Acad. Sci. Usa 115, 9351–9358 (2018). [DOI] [PMC free article] [PubMed] [Google Scholar]
- 35.Kim D & Kim J-S DIG-seq: a genome-wide CRISPR off-target profiling method using chromatin DNA. Genome Res 28, 1894–1900 (2018). [DOI] [PMC free article] [PubMed] [Google Scholar]
- 36.Scott DA & Zhang F Implications of human genetic variation in CRISPR-based therapeutic genome editing. Nat. Med 23, nm.4377 (2017). [DOI] [PMC free article] [PubMed] [Google Scholar]
- 37.Lessard S et al. Human genetic variation alters CRISPR-Cas9 on- and off-targeting specificity at therapeutically implicated loci. Proc. Natl. Acad. Sci 114, E11257–E11266 (2017). [DOI] [PMC free article] [PubMed] [Google Scholar]
- 38.Zook JM et al. An open resource for accurately benchmarking small variant and reference calls. Nat. Biotechnol 37, 561–566 (2019). [DOI] [PMC free article] [PubMed] [Google Scholar]
- 39.Akcakaya P et al. In vivo CRISPR editing with no detectable genome-wide off-target mutations. Nature 561, 416–419 (2018). [DOI] [PMC free article] [PubMed] [Google Scholar]
References
- 40.Bae S, Park J, Kim JS Cas-OFFinder: a fast and versatile algorithm that searches for potential off-target sites of Cas9 RNA-guided endonucleases. Bioinformatics 30, 1473–1475 (2014). [DOI] [PMC free article] [PubMed] [Google Scholar]
- 41.Bolger AM, Lohse M, Usadel B Trimmomatic: a flexible trimmer for Illumina sequence data. Bioinformatics 30, 2114–2120 (2014). [DOI] [PMC free article] [PubMed] [Google Scholar]
- 42.Magoč T & Salzberg SL FLASH: fast length adjustment of short reads to improve genome assemblies. Bioinform. Oxf. Engl 27, 2957–63 (2011). [DOI] [PMC free article] [PubMed] [Google Scholar]
- 43.Li H & Durbin R Fast and accurate short read alignment with Burrows-Wheeler transform. Bioinform. Oxf. Engl 25, 1754–60 (2009). [DOI] [PMC free article] [PubMed] [Google Scholar]
- 44.Corces RM et al. An improved ATAC-seq protocol reduces background and enables interrogationof frozen tissues. Nat. Methods 14, 959–962 (2017). [DOI] [PMC free article] [PubMed] [Google Scholar]
- 45.Jiang H, Lei R, Ding S-W & Zhu S Skewer: a fast and accurate adapter trimmer for next-generation sequencing paired-end reads. Bmc Bioinformatics 15, 182 (2014). [DOI] [PMC free article] [PubMed] [Google Scholar]
- 46.Zhang Y et al. Model-based Analysis of ChIP-Seq (MACS). Genome Biol 9, R137 (2008). [DOI] [PMC free article] [PubMed] [Google Scholar]
- 47.Cheng Y et al. Principles of regulatory information conservation between mouse and human. Nature 515, 371 (2014). [DOI] [PMC free article] [PubMed] [Google Scholar]
- 48.Bray NL, Pimentel H, Melsted P & Pachter L Near-optimal probabilistic RNA-seq quantification. Nat. Biotechnol 34, 525–527 (2016). [DOI] [PubMed] [Google Scholar]
- 49.Ramírez F, Dündar F, Diehl S, Grüning BA & Manke T deepTools: a flexible platform for exploring deep-sequencing data. Nucleic Acids Res 42, W187–W191 (2014). [DOI] [PMC free article] [PubMed] [Google Scholar]
- 50.Ernst J & Kellis M ChromHMM: automating chromatin-state discovery and characterization. Nat. Methods 9, 215 (2012). [DOI] [PMC free article] [PubMed] [Google Scholar]
Associated Data
This section collects any data citations, data availability statements, or supplementary materials included in this article.
Supplementary Materials
Data Availability Statement
High-throughput sequencing data generated during the study (CHANGE-seq, GUIDE-seq, ATAC-seq, histone modification ChIP-seq) is available from NCBI Sequence Read Archive and Gene Expression Omnibus under accession numbers PRJNA625995 and GSE149295, respectively.


