Abstract
Background/Aim: We aimed to analyze the diagnostic value of total tau (T- tau), S-100 calcium-binding protein B (S100B) and neuron-specific enolase (NSE) as blood-based biomarkers in acute ischemic stroke (AIS) or transient ischemic attack (TIA), and their correlation with symptom severity, infarct size, etiology and outcome. Patients and Methods: A total of 102 patients with stroke and 35 with TIA were analyzed. Subacute (63.8±50.1 h) plasma T-tau was measured with the single-molecule array (Simoa) method and NSE and S100B were evaluated for comparison. We evaluated biomarkers associations with: (i) diagnosis of AIS or TIA, (ii) cerebral infarction volume in the brain computed tomography, (iii) stroke etiology, (iv) clinical stroke severity and (iv) functional outcome after three months. Results: T-tau was higher in patients with stroke [1.0 pg/ml (IQR=0.3-2.2)] than with TIA [0.5 pg/ml (IQR=0.2-1.0), p=0.02]. The levels of S100B were also increased in stroke [0.082 μg/l (IQR=0.049-0.157)] patients compared to TIA patients [0.045 μg/l (IQR=0.03-0.073), p<0.001]. However, when the results were adjusted for confounders, significance was lost. Serum levels of NSE among patients with AIS [11.85 μg/l (IQR=9.30-16.14)] compared to those with TIA [10.96 μg/l (IQR=7.98-15.33), p=0.30] were equal. T-tau and S100B concentrations significantly correlated with cerebral infarction volume (r=0.412, p<0.001) and (r=0.597, p<0.001), also after corrections (p<0.001). mRS scores at three-month follow-up correlated with T-tau (r=0.248, p=0.016) and S100B concentrations (r=0.205, p=0.045). Conclusion: For the diagnosis of TIA vs. AIS, blood T-tau and S100B concentrations discriminated only modestly. Additionally, groups were not separable after measuring of T-tau and S100B levels in the blood. T-tau and S100B concentrations correlated with the infarct size, but were not alone predictive for functional outcome at 3 months.
Keywords: Biomarkers, plasma, serum, Tau, NSE, S100B, stroke, TIA, Simoa
T-tau protein is a microtubule-associated protein (MAP), expressed in the brain especially in the unmyelinated cortical axons (1). It is mostly found in neurons and to a lesser extent in astrocytes and oligodendrocytes. In nerve cells it has a critical role in the structural stabilization and formation of the neuronal cytoskeleton (2-4). Increased levels of tau protein have been detected in the cerebrospinal fluid (CSF) of patients with neurodegenerative diseases, e.g. Alzheimer’s (5) and Creutzfeldt-Jakob disease (6), as well as in the CSF of those with severe head injuries (7). After neuro-axonal injury, such as acute ischemic stroke (AIS) or transient ischemic attack (TIA), tau proteins are also released to the extracellular space and can be detected both in CSF and blood (8), suggesting its role as a biomarker with specificity for brain injury (9).
Previously published studies have demonstrated, that T-tau protein is up-regulated in CSF following acute brain injuries including stroke (10-13). In stroke patients, CSF tau protein levels were found elevated 2-3 days after index event, peaked at one week and returned to baseline levels after 3-5 months (11,12). Hjarmarsson and colleagues pointed, that CSF levels of T-tau protein, taken 5-10 days after stroke, significantly correlated with clinical stroke severity (14). Moreover, De Vos et al. evidenced, that CSF levels of T-tau are in line to the plasma levels of protein and Modified Rankin Scale (mRS) 12 months after stroke events (8).
A small number of studies have also shown that serum T-tau is higher in stroke patients compared to TIA patients or controls (9,14-16). T-tau was detected in blood with a conventional ELISA method only in 47.8% of ischemic stroke patients (17) and the presence of T-tau protein in serum itself had better prognostic value than its exact concentration regarding clinical outcome or stroke severity (10). The recently developed ultra-sensitive digital assay technology (Simoa), with over 1,000-fold better sensitivity compared to conventional immunoassays regarding protein expression, has recently become available for plasma T-tau measurements (18,19).
Serum astroglial protein S100B has also been demonstrated to have a significant association to clinical neurological deficit, infarct volume, functional disability after AIS and has a role as a prognostic marker (20-22). However, it is not brain specific and S100B is increased in serum even after sport-related traumas (23). Neuron-specific enolase (NSE) is found in neurons and neuroendocrine cells (24). Earlier studies have shown, that NSE blood levels are lower in controls than in patients with AIS, but correlations between NSE values and stroke severity, infarction volume and functional outcome have been found to vary between different studies (21,25-27).
In this EmbodeteCT substudy, we examined the diagnostic value of blood T-tau, determined with the Simoa method, and evaluated its capacity to differentiate acute stroke patients from TIA patients. T-tau correlations with severity of stroke, cerebral infarction volume and clinical outcome were also analyzed. Serum biomarkers related to astrogliosis (S100B) and neuronal injury (NSE) were investigated for comparison. We assumed, that plasma T-tau levels would have stronger associations with AIS or TIA than serum S100B and NSE levels.
Patients and Methods
Ethics statement. The study (EmbodeteCT Study) protocol was reviewed and approved by the Kuopio University Hospital Research Ethics Board (No.: 82/2004). Before participation to the study, written informed consent was obtained from the patient or their welfare guardians. All clinical investigations have been done along with principles expressed in the Declaration of Helsinki.
Study design and patients. This study sample consisted of the same patients from the prospective single-center observational EmbodeteCT Eastern Finland Study (28,35). Acute AIS/TIA patients admitted to Kuopio University Hospital between March 2005 and November 2009 because of suspected cardioembolic etiology, but without known atrial fibrillation (AF), were candidates to the study (28-30). A total of 162 patients were recruited and had AIS or TIA of cryptogenic or suspected cardiogenic etiology without AF during the enrollment. Three of patients refused to participate after giving informed consent and 22 did not provide a venous blood sample for biomarker analyses.
A plain computed tomography (CT) was done on admittance to rule out the hemorrhage in the brain and a combined examination of the brain, heart, aorta, and cervicocranial arteries with computed tomography (CACC-CT) and the collection of blood samples 1-12 days after symptom onset were performed during the randomization. Brain CT was routinely controlled in the subacute phase to visualize the brain infarct. However, 24 patients had also magnetic resonance imaging (MRI) of the brain, because infarction was not visible on repeated CT imaging. AIS was defined as an episode of focal neurological symptoms lasting more 24 h with an acute lesion on CT or MRI and no intracranial bleeding. TIA was diagnosed as symptoms lasting less than 24 h and caused by brain ischemia without any lesion on CT or MRI (31). The etiology of AIS/TIA was divided into five different categories according to the trial of ORG 10172 in acute stroke treatment (TOAST) classification (32). The clinical and functional outcome was evaluated in hospital by a neurologist at the follow-up visit three months after stroke and a blood sample was collected again. A control group was not available.
Outcome measures were; the clinical outcome using the Modified Rankin Scale (mRS), with scores ranging from 0 to 6 at 90 days follow-up and determination of the infarct size.
Imaging. Patients were investigated with contrast-enhanced CACC-CT scan (Somatom Sensation 16® or Somatom Definition AS®; Siemens Medical Solutions, Forchheim, Germany) of the aortic arch, cervical arteries and intracranial arteries, immediately followed by scanning of the ascending aorta and heart. The volume of the brain infarct was measured from 4.5-5 mm transversal slices of the brain CT in the subacute phase and calculated by using Simpson’s rule (33). When infarction was not found on repeated CT imaging, MRI of the brain was performed (1.5T, Siemens Avanto, Erlanger, Germany).
Measurement of biomarkers: Blood samples were drawn into gel separator tubes for serum and ethylenediaminetetraacetic acid (EDTA) for plasma. Study blood samples were performed approximately 63.8±50.1 h after hospital admission; range=1-12 days. With regard to acute phase, 88% of the patients were sampled within five days from stroke onset. The gel separator tubes were centrifuged 20-60 min after sampling. Serum and plasma was separated, aliquoted and stored at −80˚C pending biochemical analysis.
Samples for S100B and NSE were analyzed on a Modular E170 instrument (Roche Diagnostics, Mannheim, Germany) with reagents from the same manufacturer. Plasma T-tau was measured with a novel immunoassay using digital array technology (Quanterix Corp) (18), as described (34-36). The limit of detection (LOD) for the tau assay was 0.02 pg/ml. The lower limit of quantification (LLOQ) was 1.22 pg/ml when compensated for a four-fold sample dilution. The intra-assay coefficient of variation was 6.8% for quality control (QC) samples with concentrations of 2.6 pg/ml and 1.1% with concentrations of 27.1 pg/ml. The samples were analyzed using the same batch of reagents by board-certified laboratory technicians who were blinded to clinical information.
Statistical analysis. Discrete variables are expressed counts (percentages) and continuous variables as means or medians (interquartile range (IQR). To test normality of the data, a Shapiro-Wilk test was performed. Total tau, NSE and S100B values were log10 transformed in order to achieve a normal distribution, and these were used for all analyses. Student’s t-test and Mann-Whitney U-test were used to compare continuous variables, where appropriate. Two-tailed Pearson correlation coefficient and Spearman’s rank correlation coefficient were used to investigate the association between continuous normally distributed and non-normally distributed variables, respectively.
The chi-square test with Pearson’s or Fisher’s correlation was used to compare nominal variables. Receiver operating characteristic (ROC) curves were used in the sensitivity and specificity analyses and to determine the optimal biomarker thresholds for discriminating between AIS and TIA. To assess the independent association of biomarkers with dichotomous endpoint (i.e. AIS vs. TIA), we computed multivariate logistic regression models adjusted for established predictors. Ordinal regression models were used to test the association between biomarkers and 3-month outcome (i.e. modified Rankin Scale category). Analysis of variance and linear regression models were used to compare biomarker levels in different etiological groups. All regression models were adjusted by age, gender and NIHSS. Tests were two-sided and p-values <0.05 were considered to indicate statistical significance. The data were analyzed using IBB SPSS® for Windows, version 25.0 (SPSS Inc., Chicago, IL, USA).
Results
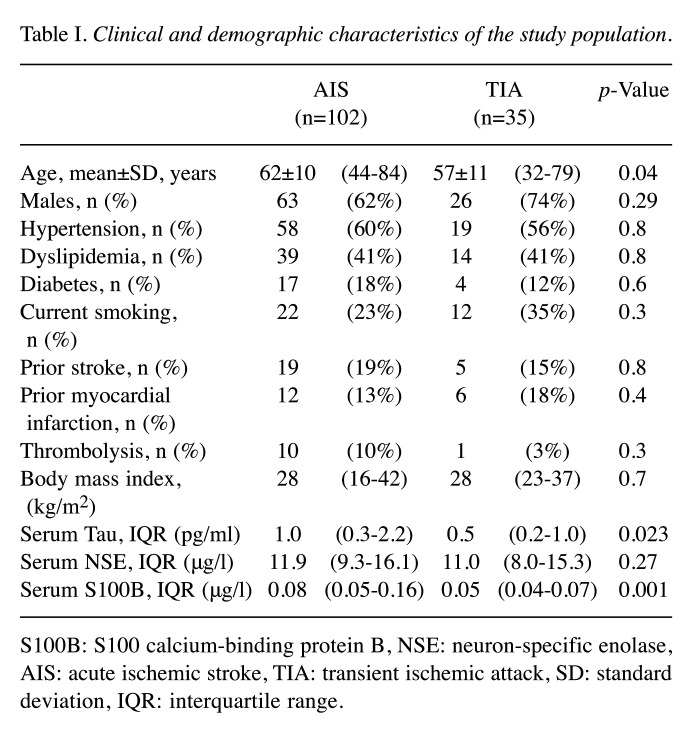
In this cohort, 102 (74%) patients had AIS and 35 (26%) were found to have TIA. Baseline characteristics and the biomarker concentrations for AIS and TIA patients are presented in Table I. A total of 68% of the study patients were males. AIS patients (62±10 years) were older than TIA (mean=57±11 years) patients (p=0.04). The median concentrations in the subacute phase were 0.84 pg/ml (IQR=0.28-1.80) for T-tau (n=133), 0.069 μg/l (IQR=0.042-0.124) for S100B (n=137) and 11.58 μg/l (IQR=8.77-15.75) for NSE (n=137). Both the subacute phase and follow-up samples were available for T-tau for 39 patients and for S100B and NSE for 41 patients. Significant differences were not observed between the subacute phase levels of T-tau [0.73 pg/ml (IQR=0.34-1.43)], S100B [0.065 μg/l (IQR=0.041-0.124)] and NSE [11.5 μg/l (IQR=7.78-16.7)] compared to the three-month follow-up levels of T-tau [0.79 pg/ml (IQR=0.36-1.49)], S100B [0.046 μg/l (IQR=0.04-0.06)] and NSE [11.5 μg/l (IQR=8.86-15.239)].
Table I. Clinical and demographic characteristics of the study population.
S100B: S100 calcium-binding protein B, NSE: neuron-specific enolase, AIS: acute ischemic stroke, TIA: transient ischemic attack, SD: standard deviation, IQR: interquartile range.
Age significantly correlated with the S100B levels (r=0.174, p=0.04), but not with T-Tau and NSE levels. A clear relationship between the blood levels of these three analyses at admission was observed. T-tau correlated with S100B (r=0.427, p<0.001) and with NSE levels (r=0.331, p<0.001). In addition, S100B correlated significantly with NSE levels (r=0.230, p=0.007).
The mean NIHSS was 3.7 among AIS patients. T-tau was elevated [1.0 pg/ml (IQR=0.3-2.2)] in stroke patients compared to patients with TIA [0.5 pg/ml (IQR=0.2-1.0), p=0.02]. Also, serum concentrations of S100B were increased in stroke patients [0.082 μg/l (IQR=0.049-0.157)] compared to TIA patients [0.045 μg/l (IQR=0.037-0.073), p<0.001]. Notably, the levels of NSE in stroke patients [11.85 μg/l (IQR=9.30-16.14)] did not differ significantly compared to TIA patients [10.96 μg/l (IQR=7.98-15.33), p=0.30]. Eleven patients (8%) had thrombolysis with recombinant tissue plasminogen activator (tPA). S100B serum levels were significantly higher in patients who received tPA compared to those who did not (p=0.03).
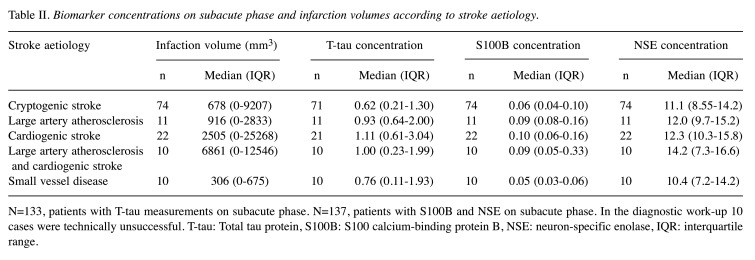
Among patients with AIS, biomarker concentrations varied between ischemic stroke categories in the subacute phase. Cardioembolic stroke (CE) patients had the highest T-tau, S100B and NSE concentrations. T-tau levels in the cryptogenic stroke group were lower than in those with CE stroke (p=0.029). T-tau concentrations also differed between groups with small vessel disease (SVD) and large vessel disease (LVD) (p=0.037) and groups with SVD and CE (p=0.011) (Figure 3). Serum S100B concentrations were different between LVD and SVD groups (p=0.026), CE and cryptogenic groups (p=0.019) and CE and SVD groups (p=0.004) (Figure 2). Serum NSE levels were similar in different etiological categories. However, statistical significance between etiological groups was not retained adjustment for age and NIHSS. Infarct volume and subacute phase biomarker concentrations in relation to the different stroke etiology are shown in Table II.
Figure 3. Comparison of the mean plasma total tau on admission, according to the trial of ORG 10172 classification. Patient numbers in different etiological groups: cryptogenic n=71, large artery atherosclerosis n=11, cardiogenic n=21, large artery atherosclerosis and cardiogenic n=10, small vessel disease n=10 and and 10 cases were technically unsuccessful. Significant differences were observed between cryptogenic strokes and cardio embolic strokes (CE) (p=0.029). T-tau concentrations differed also between groups with small vessel disease (SVD) and large vessel disease (p=0.037) and groups with SVD and CE (p=0.011). However, statistical significances between different etiological groups did not remain after corrections.
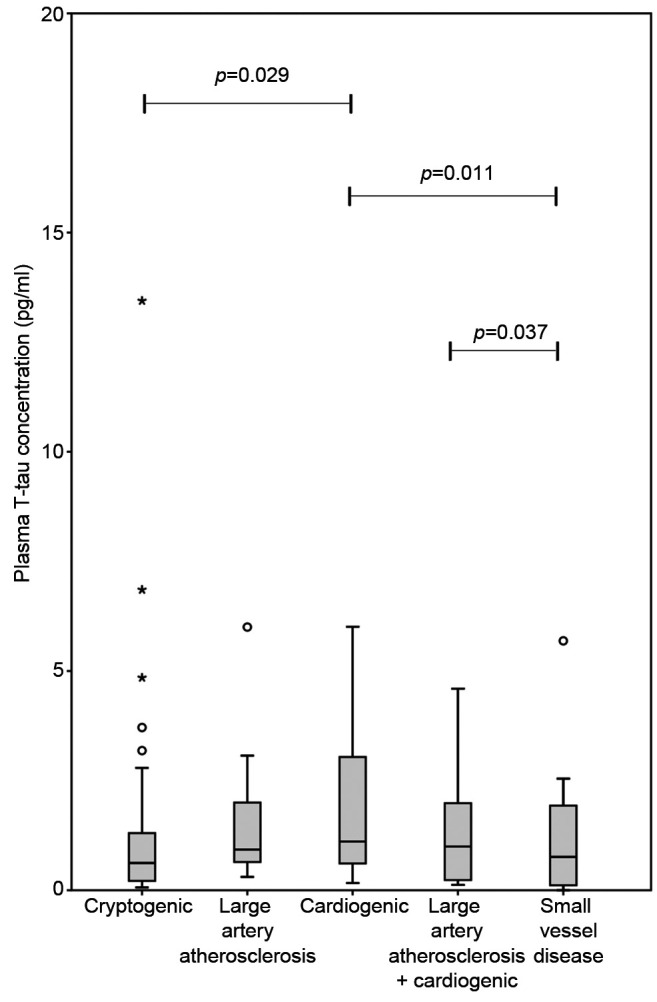
Figure 2. Comparison of the mean serum S100B on subacute phase according to the trial of ORG 10172 classification. Patient numbers in different etiological groups: cryptogenic n=74, large artery atherosclerosis n=11, cardiogenic n=22, large artery atherosclerosis and cardiogenic n=10 and small vessel disease n=10 and 10 cases were technically unsuccessful. Significant differences were observed between large vessel disease and small vessel disease (SVD) (p=0.026). S100B levels differed also between groups with cardio embolism (CE) and cryptogenic strokes (p=0.019) and groups with CE and SVD (p=0.004). However, statistical significances between different etiological groups were lost after adjustment for established predictors.
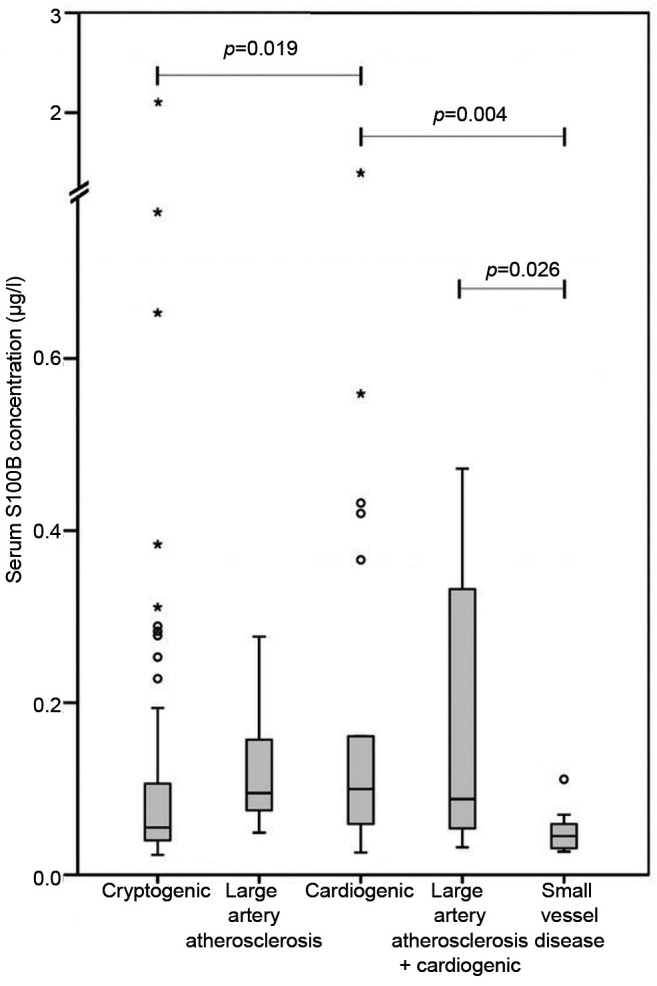
Table II. Biomarker concentrations on subacute phase and infarction volumes according to stroke aetiology.
Biomarker concentrations on subacute phase and infarction volumes according to stroke aetiology.
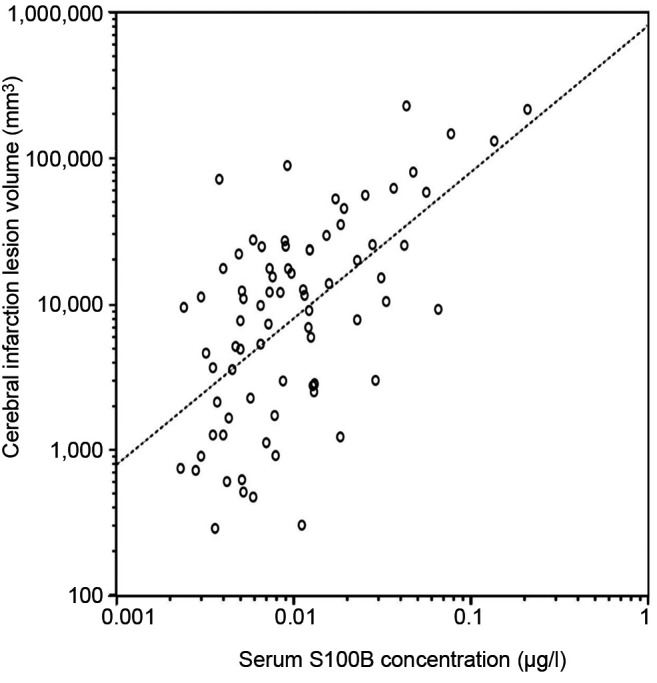
Infarct size acquired from head CT correlated with the concentrations of T-tau (r=0.412, p<0.001) (Figure 5) and S100B (r=0.597, p<0.001) (Figure 6). Patients without prominent ischemic lesion on CT imaging (n=58) had T-tau concentrations of 0.62 pg/ml (IQR=0.21-1.18) and S100B concentrations of 0.049 μg/l (IQR=0.036-0.082). Patients with a noticeable infarct on CT (n=78) had T-tau concentrations of 1.11 pg/ml (IQR=0.36-2.54) and S100B concentrations of 0.089 μg/l (IQR=0.051-0.18). The difference was statistically different for both T-tau (p=0.01) and S100B (p<0.001). A total of 24 of the 58 patients, who had no sign of infarction on CT were also imaged with MRI. T-tau levels between the 12 patients without infarct on MRI [0.39 pg/ml (IQR=0.21-0.71)] and the 12 patients with infarct [0.68 pg/ml (IQR=0.12-1.96), p=0.64] were identical. No difference was found in S100B and NSE concentrations in those groups either.
Figure 5. Natural logarithmic association of infarction volume with plasma total tau concentration levels in stroke and transient ischemic attack patients on subacute phase. A significant positive correlation (Pearson r=0.412, p<0.001) was found and it remained after adjustment for age, NIHSS and sex.
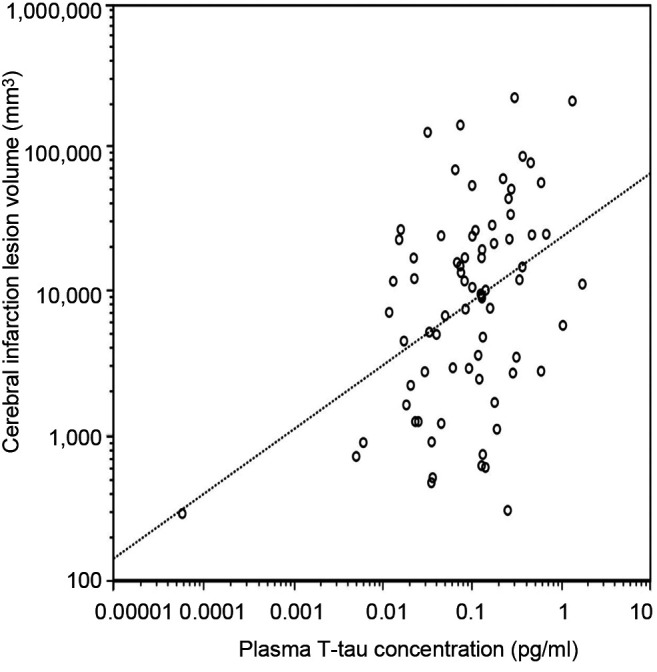
Figure 6. Natural logarithmic association of infarction volume with serum S100B concentration levels in stroke and transient ischemic attack patients on subacute phase. A significant positive correlation (Pearson r=0.597, p<0.001) was found and it remained after adjustment for confounding factors.
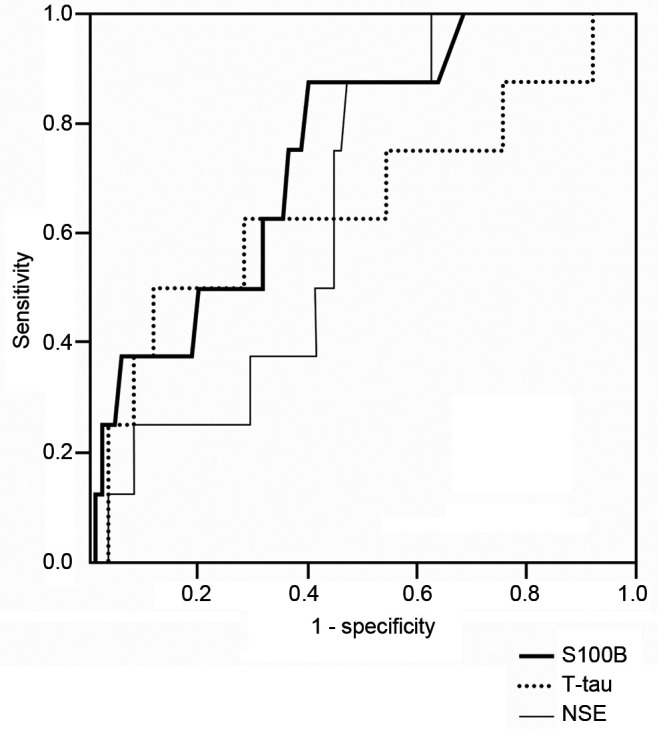
Receiver operating characteristic (ROC) curves were calculated to determine the potential of biomarkers to discriminate between the two groups. The highest sensitivity and specificity value to separate AIS vs. TIA was obtained using a T-tau cut-off point 0.503 pg/ml and a S100B cut-off point 0.046 μg/l. The area under the ROC curve (AUROC) was 0.63 for T-tau and 0.69 for S100B (Figure 1). Sensitivity and specificity were 68% and 54% for T-tau and 80% and 54% for S100B. AUROC for NSE between AIS and TIA patients was only 0.56. T-tau (r=0.236, p=0.02), S100B (r=0.352, p<0.001) and NSE (0.267, p=0.007) associated with NIHSS values on admission.
Figure 1. Receiver operating characteristic curve for biomarkers to differentiate between acute ischemic stroke (AIS) and transient ischemic attack (TIA).
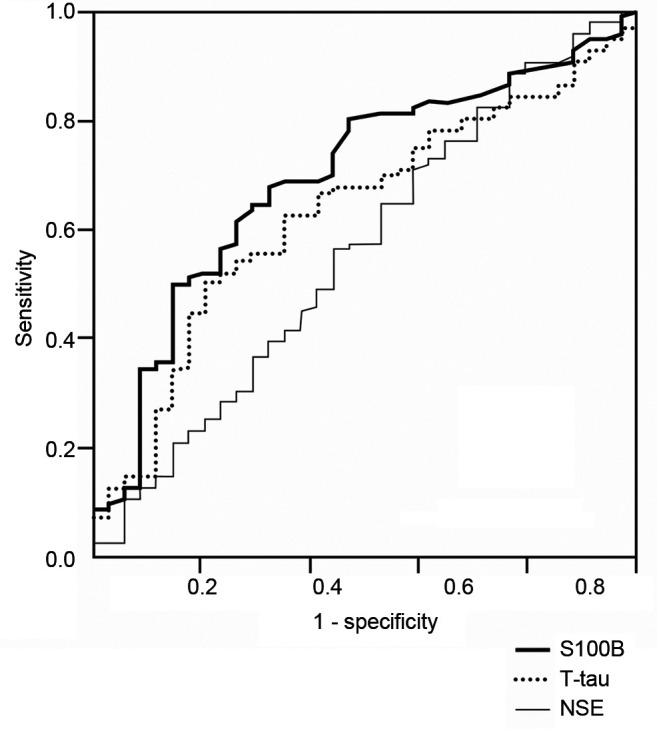
A total of 93 out of the 133 patients (with subacute T-tau values) attended the follow-up visit. At 3 months Modified Rankin Scale (mRS) correlated modestly, with the subacute phase concentrations of T-tau (r=0.248, p=0.016) and S100B (r=0.205, p=0.045), while the correlation with cerebral infarction volumes was somewhat higher (r=0.341, p=0.006). NIHSS (n=93; 70%) after three months correlated also with T-tau (r=0.281, p=0.007) and S100B (r=0.340, p=0.001) concentrations. However, neither T-tau nor S100B alone were capable to increase prognostic performance for poor clinical outcome after adjustment for confounding factors. When the patients were divided in favorable outcome (mRS scores 0-2) and poor outcome (mRS scores 3-6) groups, the S100B concentration was different between the groups (p=0.028) (Figure 4), but in regression analysis it lost its significance (p=0.11). In multivariable linear regression model, odds ratio per log unit increase for poor outcome in S100B was 1.806. AUROC to differentiate between good and poor outcome was 0.75 for S100B and 0.65 for T-tau.
Figure 4. Receiver operating characteristic curve for total tau (T-tau), S100 calcium-binding protein B (S-100B) and neuro-specific enolase (NSE) to differentiate between favorable and poor outcomes.
Discussion
In this study, which is a part of a larger prospective study of AIS and TIA patients, we compared plasma T-tau levels that were analyzed and quantified using a novel high-sensitivity technique head-to-head with S100B and NSE levels. We used blood samples, because, it is a non-invasive method and easier to perform in clinical practice and a digital ELISA method to measure T-Tau in blood samples has come available recently (19,20). Like De Vos et al. (8), we were able to quantify plasma T-tau in all patients. We demonstrated, that blood T-tau and S100B levels were higher with AIS patients compared to that of patients with TIA. These results concur with those of previous studies, which demonstrated, that these biomarkers in CSF were elevated in patients with acute ischaemic stroke as a result of brain injury (14,37). All these blood biomarker levels associated with stroke severity were measured with NIHSS. T-tau and S100B correlated with brain infarct volume in CT and functional outcome at 3 months. However, T-tau and S100B levels, taken two and a half days after stroke, were not capable to increase prognostic performance in addition to established predictors. None of these biomarkers, taken on the subacute phase, was alone capable of separating TIA from stroke. T-tau and S100B concentrations were significantly higher in patients who had had a stroke due to LVD or CE etiology than in patients with cryptogenic stroke or SVD etiology.
As in our study, four prior studies have demonstrated that T-tau levels are elevated and measurable in the blood of patients with AIS (8,10,15-17). However, in these studies, tau protein was found in the serum or in plasma in only 40-50% of AIS patients. Bitsch et al. analyzed the temporal pattern of T-tau protein in serum with a conventional ELISA in 30 patients after AIS. T-tau was measurable in blood five days after ischemia of 7/20 patients with infarction on MRI and in 2/10 patients with TIA (17). On the basis of those findings, they hypothesized that the presence of the tau protein in blood might be due to the spontaneous recanalization of the vessel or caused by the thrombolytic therapy. On the contrary, we did not find any difference in T-tau levels between patients who received tPA and those who did not, which is in line with two other studies (15,16). Therefore, the phenomenon in which previous studies found tau protein in serum or in plasma in only half of the patients seems to be a technical problem and can be solved through the highly sensitive methods shown here.
Although we were able to measure T-tau in all stroke patients about two and a half days after the ischemic event, it was not possible to differentiate between stroke patients vs. TIA patients and correlations of T-tau levels to stroke severity and functional outcome were quite low. However, we could have missed the peak of T-tau release in plasma, because the kinetics of T-tau is bi-modal in some patients and the half-life of T-tau is approximately ten hours (34). Despite these limitations, our major aim was to study plasma levels of T-tau via digital ELISA as a preliminary study. Randall and colleaques measured T-tau in serum in the patients with hypoxic brain injury after cardiac arrest and the range of T-tau levels was large. The first peak appeared in their study within 24 h of cardiac arrest and the second peak after 24-48 h (34). Presumably those peaks represent neuronal damage because of hypoxia, followed by delayed cell death due to secondary processes. In contrast, another neuro-axonal biomarker, serum neurofilament light (sNfL), has been shown to distinguish between AIS and TIA (35,38).
We found that patients with AIS had only 2-fold higher plasma T-tau levels than patients with TIA. The current study is the first to report the difference in T-tau levels between AIS and TIA patients and as a non-invasive method, blood T-tau measurements with SIMOA, might have the capacity to differentiate between ischemic events and stroke mimics. A recently published study demonstrated, that plasma T-Tau quantified with digital ELISA can discriminate AIS patients from normal control patients with 85.7% sensitivity/54.6% specificity (37). Patients in the current study suffered from mild strokes, which is reflected to low T-tau plasma levels at admission as well as low NIHSS values. One prior study investigated biomarker levels in CSF in AIS patients, including T-tau, and found a four-fold increase in T-tau levels in AIS patients compared to healthy controls (13). Additionally, they reported, that T-tau concentrations were fourfold higher in patients with high NIHSS values compared to those with low ones.
Our data show no significant change in biomarker levels between acute phase and follow-up as assessed after three months. In accordance, De Vos and colleagues found, using the same method, that plasma T-tau peaked seven days after stroke and returned to baseline after three months (8). Additionally, T-tau levels in CSF have been reported to peak one to three weeks after the index event (11). We did not observe any change between subacute phase and the late phase of T-tau levels. This might suggest that, T-tau is not a marker to reflect ongoing axonal degeneration or secondary inflammatory processes (39,40), which is related to poor stroke outcome. Accordingly, Härtig et al. suggested that, microtubule-associated proteins like T-tau and sNfL reflect different mechanism after focal cerebral ischemia (41).
A significant correlation between NIHSS and T-tau levels in the blood has been shown in three earlier studies (8,14,37). Additionally, they also found a clear relationship between blood T-tau levels and infarction volume measured from CT or MRI. Our results are comparable to these findings and show correlations between T-tau, NIHSS and infarct size in CT imaging even after corrections. Moreover, in the study by De Vos and colleagues, the relationship between T-tau and infarction volume was strongest (r=0.753) when the blood samples were taken one week after the stroke. We also found correlations between different blood markers. This can be explained by the fact that ischemia lesion consists of different kind of cells and proteins derived from those cells can be detected in the blood with sensible methods.
Similar to two other studies (8,15), our study demonstrated a significant, but weaker, association between T-tau and mRS at 3 months, but this association was not significant after adjusting for age, NIHSS and infarct size. On the other hand, the patients in our study had clearly milder strokes compared to the patients in those two other studies, in which NIHSS scores were on admission 13 and 6.8, respectively. In addition, the other mentioned studies did not report results after correction for confounding factors. Thus, as a disadvantage so far, T-tau does not increase prognostic performance after known predictors like NIHSS and infarct size. When the patients were dichotomized to favorable- and poor-outcome groups, only S100B levels differed significantly, but in regression analysis lost its significance. Copeptin, is the only biomarker which has been shown to improve the performance of validated clinical models in the prediction of the functional outcome after AIS (42,43).
We found the highest T-tau and S100B levels in the LVD and CE groups. In addition, T-tau and S100B levels varied between CE and cryptogenic stroke groups, suggesting many other causes than emboli in patients with cryptogenic stroke. However, these associations did not remain significant after adjustments and T-tau and S100B were not alone capable to differentiate between etiologic groups. Low biomarker concentrations in the SVD etiological group again supports the idea that, these biomarkers reflect axonal damage, as lacunar strokes are smallest in size.
Limitations. We are aware of several limitations concerning our study. First, the EmbodeteCT study primarly ruled out a large number of patients and focused on patients with suspected cardioembolic AIS/TIA and excluded patients with known AF. Since our study excluded patients with symptoms indicating atherosclerosis, lacunar infarcts and hypercoagulable states, this study represents only a small subpopulation of all AIS/TIA patients. One must keep this in mind, when evaluating these results in the context to all consecutive patients with AIS.
Second, we measured biomarker levels at two time points only; on subacute phase once and at the three-month follow-up visit. Based on the evidence from the other study, we likely have missed the T-tau peaks in blood and our results may underestimate the capacity of plasma T-tau to differentiate between AIS and TIA. Third, we determined the infarct size acquired from CT imaging instead of MRI. Forth, there were many years between blood sampling and T-tau analyses. However, all samples were stored at –80˚C pending analysis and T-tau has been shown to be stable over time and freeze-thaw cycles (44). Lastly, our follow-up rate was fairly low and we could not get clinical outcome information from all patients at 3 months.
Conclusion
The most sensitive method, digital ELISA, allows the quantification of T-tau in plasma samples at low levels. Despite this, T-tau plasma levels obtained approximately two and half days after stroke onset were not alone capable to differentiate between AIS and TIA patients. Unexpectedly, T-tau was not superior to S100B. The T-tau concentrations correlated with stroke severity assessed either clinically or from neuroimaging. In addition, there was an association between T-tau and clinical outcome after three months, but it was not an independent predictor in addition to NIHSS and stroke volume. Our study did not include repeated measurements of T-tau in plasma over the time after index event and the future studies should aim to demonstrate the temporal profile of T-tau after AIS. Brain MRI should be used as neuroimaging. Thus, the optimal time points to measure T-tau in blood and it’s diagnostic and prognostic performance could be identified.
Funding
KB is supported by the Swedish Research Council (#2017-00915), the Alzheimer Drug Discovery Foundation (ADDF), USA (#RDAPB-201809-2016615), the Swedish Alzheimer Foundation (#AF-742881), Hjärnfonden, Sweden (#FO2017-0243), the Swedish state under the agreement between the Swedish government and the County Councils, the ALF-agreement (#ALFGBG-715986), and the European Union Joint Program for Neurodegenerative Disorders (JPND2019-466-236). Kuopio University Hospital EVO grant 5063519.
Conflicts of Interest
HZ and KB are co-founders of Brain Biomarker Solutions in Gothenburg AB, a GU Ventures-based platform company at the University of Gothenburg. HZ has served on the advisory boards of Roche Diagnostics, CogRx, Wave, Samumed and Denali. KB has served on the advisory boards or as a consultant for Abcam, Axon, Biogen, Lilly, MagQu, Novartis, Pfizer and Roche Diagnostics. JO, RV, PJ, PM, KP, MK, MH, KH, SH and MT have nothing to declare in regard to this study.
Authors’ Contributions
JO, PJ, MH and RV recruited patients and analyzed clinical, radiological and cardiological data for the Embodect Eastern Finland study. HZ, KB, KH, PM, KP, and SH were involved in assay development and sample analysis. JO drafted the initial version and MT and JO performed the statistical analysis and drew the figures. All Authors reviewed and edited the manuscript.
Acknowledgements
The Authors thank statistician Tuomas Selander for his assistance regarding regression analyses.
References
- 1.Trojanowski JQ, Schuck T, Schmidt ML, Lee VM. Distribution of tau proteins in the normal human central and peripheral nervous system. J Histochem Cytochem. 1989;37:209–215. doi: 10.1177/37.2.2492045. [DOI] [PubMed] [Google Scholar]
- 2.Shin RW, Iwaki T, Kitamoto T, Tateishi J. Hydrated autoclave pretreatment enhances tau immunoreactivity in formalin-fixed normal and Alzheimer’s disease brain tissues. Lab Invest. 1991;64:693–702. [PubMed] [Google Scholar]
- 3.Avila J, Lucas JJ, Perez M, Hernandez F. Role of tau protein in both physiological and pathological conditions. Physiol Rev. 2004;84:361–384. doi: 10.1152/physrev.00024.2003. [DOI] [PubMed] [Google Scholar]
- 4.Morris M, Maeda S, Vossel K, Mucke L. The many faces of tau. Neuron. 2011;70:410–426. doi: 10.1016/j.neuron.2011.04.009. [DOI] [PMC free article] [PubMed] [Google Scholar]
- 5.Blennow K, Hampel H, Weiner M, Zetterberg H. Cerebrospinal fluid and plasma biomarkers in Alzheimer disease. Nat Rev Neurol. 2010;6:131–144. doi: 10.1038/nrneurol.2010.4. [DOI] [PubMed] [Google Scholar]
- 6.Otto M, Wiltfang J. Differential diagnosis of neurodegenerative diseases with special emphasis on Creutzfeldt-Jakob disease. Restor Neurol Neurosci. 2003;21:191–209. [PubMed] [Google Scholar]
- 7.Franz G, Beer R, Kampfl A, Engelhardt K, Schmutzhard E, Ulmer H. Amyloid beta 1-42 and tau in cerebrospinal fluid after severe traumatic brain injury. Neurology. 2003;60:1457–1461. doi: 10.1212/01.wnl.0000063313.57292.00. [DOI] [PubMed] [Google Scholar]
- 8.De Vos A, Bjerke M, Brouns R, De Roeck N, Jacobs D, Van den Abbeele L. Neurogranin and tau in cerebrospinal fluid and plasma of patients with acute ischemic stroke. BMC Neurol. 2017;17:170. doi: 10.1186/s12883-017-0945-8. [DOI] [PMC free article] [PubMed] [Google Scholar]
- 9.Kuroda M, Shimizu M, Inoue N, Ikeno I, Nakagawa H, Yokoi A, Niida Y, Konishi M, Kaneda H, Igarashi N, Yamahana J, Taneichi H, Kanegane H, Ito M, Saito S, Furuichi K, Wada T, Nakagawa M, Yokoyama H, Yachie A. Serum tau protein as a marker of disease activity in enterohemorrhagic Escherichia coli O111-induced hemolytic uremic syndrome. Neurochem Int. 2015;85-86:24–30. doi: 10.1016/j.neuint.2015.04.003. [DOI] [PubMed] [Google Scholar]
- 10.Bielewicz J, Kurzepa J, Czekajska-Chehab E, Stelmasiak Z, Bartosik-Psujek H. Does serum Tau protein predict the outcome of patients with ischemic stroke. J Mol Neurosci. 2011;43:241–245. doi: 10.1007/s12031-010-9403-4. [DOI] [PubMed] [Google Scholar]
- 11.Hesse C, Rosengren L, Andreasen N, Davidsson P, Vanderstichele H, Vanmechelen E. Transient increase in total tau but not phospho-tau in human cerebrospinal fluid after acute stroke. Neurosci Lett. 2001;297:187–190. doi: 10.1016/s0304-3940(00)01697-9. [DOI] [PubMed] [Google Scholar]
- 12.Hesse C, Rosengren L, Vanmechelen E, Vanderstichele H, Jensen C, Davidsson P. Cerebrospinal fluid markers for Alzheimer’s disease evaluated after acute ischemic stroke. J Alzheimers Dis. 2002;2:199–206. doi: 10.3233/jad-2000-23-402. [DOI] [PubMed] [Google Scholar]
- 13.Kaerst L, Kuhlmann A, Wedekind D, Stoeck K, Lange P, Zerr I. Cerebrospinal fluid biomarkers in Alzheimer’s disease, vascular dementia and ischemic stroke patients: a critical analysis. J Neurol. 2013;260:2722–2727. doi: 10.1007/s00415-013-7047-3. [DOI] [PMC free article] [PubMed] [Google Scholar]
- 14.Hjalmarsson C, Bjerke M, Andersson B, Blennow K, Zetterberg H, Aberg ND. Neuronal and glia-related biomarkers in cerebrospinal fluid of patients with acute ischemic stroke. J Cent Nerv Syst Dis. 2014;6:51–58. doi: 10.4137/JCNSD.S13821. [DOI] [PMC free article] [PubMed] [Google Scholar]
- 15.Wunderlich MT, Lins H, Skalej M, Wallesch C, Goertler M. Neuron-specific enolase and tau protein as neurobiochemical markers of neuronal damage are related to early clinical course and long-term outcome in acute ischemic stroke. Clin Neurol Neurosurg. 2008;108:558–563. doi: 10.1016/j.clineuro.2005.12.006. [DOI] [PubMed] [Google Scholar]
- 16.Lasek-Bal A, Jedrzejowska-Szypulka H, Rozycka J, Bal W, Kowalczyk A, Holecki M. The presence of Tau protein in blood as a potential prognostic factor in stroke patients. J Physiol Pharmacol. 2016;67:691–696. [PubMed] [Google Scholar]
- 17.Bitsch A, Horn C, Kemmling Y, Seipelt M, Hellenbrand U, Stiefel Serum tau protein level as a marker of axonal damage in acute ischemic stroke. Eur Neurol. 2002;47:45–51. doi: 10.1159/000047946. [DOI] [PubMed] [Google Scholar]
- 18.Rissin DM, Fournier DR, Piech T, Kan CW, Campbell TG, Song L. Simultaneous detection of single molecules and singulated ensembles of molecules enables immunoassays with broad dynamic range. Anal Chem. 2011;83:2279–2285. doi: 10.1021/ac103161b. [DOI] [PMC free article] [PubMed] [Google Scholar]
- 19.Rissin DM, Kan CW, Campbell TG, Howes SC, Fournier DR, Song L. Single-molecule enzyme-linked immunosorbent assay detects serum proteins at subfemtomolar concentrations. Nat Biotechnol. 2010;28:595–599. doi: 10.1038/nbt.1641. [DOI] [PMC free article] [PubMed] [Google Scholar]
- 20.Abraha HD, Butterworth RJ, Bath PM, Wassif WS, Garthwaite J, Sherwood RA. Serum S-100 protein, relationship to clinical outcome in acute stroke. Ann Clin Biochem. 1997;34(Pt 5):546–550. doi: 10.1177/000456329703400510. [DOI] [PubMed] [Google Scholar]
- 21.Fassbender K, Schmidt R, Schreiner A, Fatar M, Muhlhauser F, Daffertshofer M. Leakage of brain-originated proteins in peripheral blood: temporal profile and diagnostic value in early ischemic stroke. J Neurol Sci. 1997;148:101–105. doi: 10.1016/s0022-510x(96)05351-8. [DOI] [PubMed] [Google Scholar]
- 22.Foerch C, Otto B, Singer OC, Neumann-Haefelin T, Yan B, Berkefeld J. Serum S100B predicts a malignant course of infarction in patients with acute middle cerebral artery occlusion. Stroke. 2004;35:2160–2164. doi: 10.1161/01.STR.0000138730.03264.ac. [DOI] [PubMed] [Google Scholar]
- 23.Stalnacke BM, Ohlsson A, Tegner Y, Sojka P. Serum concentrations of two biochemical markers of brain tissue damage S-100B and neurone specific enolase are increased in elite female soccer players after a competitive game. Br J Sports Med. 2006;40:313–316. doi: 10.1136/bjsm.2005.021584. [DOI] [PMC free article] [PubMed] [Google Scholar]
- 24.Barone FC, Clark RK, Price WJ, White RF, Feuerstein GZ, Storer BL. Neuron-specific enolase increases in cerebral and systemic circulation following focal ischemia. Brain Res. 1993;623:77–82. doi: 10.1016/0006-8993(93)90012-c. [DOI] [PubMed] [Google Scholar]
- 25.Cunningham RT, Young IS, Winder J, O’Kane MJ, McKinstry S, Johnston CF. Serum neurone specific enolase (NSE) levels as an indicator of neuronal damage in patients with cerebral infarction. Eur J Clin Invest. 1991;21:497–500. doi: 10.1111/j.1365-2362.1991.tb01401.x. [DOI] [PubMed] [Google Scholar]
- 26.Oh SH, Lee JG, Na SJ, Park JH, Choi YC, Kim WJ. Prediction of early clinical severity and extent of neuronal damage in anterior-circulation infarction using the initial serum neuron-specific enolase level. Arch Neurol. 2003;60:37–41. doi: 10.1001/archneur.60.1.37. [DOI] [PubMed] [Google Scholar]
- 27.Anand N, Stead LG. Neuron-specific enolase as a marker for acute ischemic stroke: a systematic review. Cerebrovasc Dis. 2005;20:213–219. doi: 10.1159/000087701. [DOI] [PubMed] [Google Scholar]
- 28.Sipola P, Hedman M, Onatsu J, Turpeinen A, Halinen M, Jakala P, Vanninen R. Computed tomography and echocardiography together reveal more high-risk findings than echocardiography alone in the diagnostics of stroke etiology. Cerebrovasc Dis. 2013;35:521–530. doi: 10.1159/000350734. [DOI] [PubMed] [Google Scholar]
- 29.Taina M, Vanninen R, Hedman M, Jakala P, Karkkainen S, Tapiola T. Left atrial appendage volume increased in more than half of patients with cryptogenic stroke. PLoS One. 2013;8:e79519. doi: 10.1371/journal.pone.0079519. [DOI] [PMC free article] [PubMed] [Google Scholar]
- 30.Onatsu J, Taina M, Mustonen P, Hedman M, Muuronen A, Arponen O, Korhonen M, Jakala P, Vanninen R, Pulkki K. Soluble urokinase-type plasminogen activator receptor predicts all-cause 5-year mortality in ischemic stroke and TIA. In Vivo. 2017;31:381–386. doi: 10.21873/invivo.11070. [DOI] [PMC free article] [PubMed] [Google Scholar]
- 31.Sacco RL, Kasner SE, Broderick JP, Caplan LR, Connors JJ, Culebras A, Elkind MS, George MG, Hamdan AD, Higashida RT, Hoh BL, Janis LS, Kase CS, Kleindorfer DO, Lee JM, Moseley ME, Peterson ED, Turan TN, Valderrama AL. An updated definition of stroke for the 21st century: a statement for healthcare professionals from the American Heart Association/American Stroke Association. Stroke. 2013;44:2064–2089. doi: 10.1161/STR.0b013e318296aeca. [DOI] [PMC free article] [PubMed] [Google Scholar]
- 32.Adams HP Jr., Bendixen BH, Kappelle LJ, Biller J, Love BB, Gordon DL, Marsh EE 3rd. Classification of subtype of acute ischemic stroke. Definitions for use in a multicenter clinical trial. TOAST. Trial of Org 10172 in Acute Stroke Treatment. Stroke. 1993;24:35–41. doi: 10.1161/01.str.24.1.35. [DOI] [PubMed] [Google Scholar]
- 33.Graham TP Jr., Jarmakani JM, Atwood GF, Canent RV Jr. Right ventricular volume determinations in children. Normal values and observations with volume or pressure overload. Circulation. 1973;47:144–153. doi: 10.1161/01.cir.47.1.144. [DOI] [PubMed] [Google Scholar]
- 34.Randall J, Mortberg E, Provuncher GK, Fournier DR, Duffy DC, Rubertsson S. Tau proteins in serum predict neurological outcome after hypoxic brain injury from cardiac arrest: results of a pilot study. Resuscitation. 2013;84:351–356. doi: 10.1016/j.resuscitation.2012.07.027. [DOI] [PubMed] [Google Scholar]
- 35.Onatsu J, Vanninen R, Jakala P, Mustonen P, Pulkki K, Korhonen M, Hedman M, Zetterberg H, Blennow K, Höglund K, Herukka SK, Taina M. Serum neurofilament light chain concentration correlates with infarct volume but not prognosis in acute ischemic stroke. J Stroke Cerebrovasc Dis. 2019;28:2242–2249. doi: 10.1016/j.jstrokecerebrovasdis.2019.05.008. [DOI] [PubMed] [Google Scholar]
- 36.Rohrer JD, Woollacott IO, Dick KM, Brotherhood E, Gordon E, Fellows A. Serum neurofilament light chain protein is a measure of disease intensity in frontotemporal dementia. Neurology. 2016;87:1329–1336. doi: 10.1212/WNL.0000000000003154. [DOI] [PMC free article] [PubMed] [Google Scholar]
- 37.O’Connell GC, Alder ML, Smothers CG, Still CH, Webel AR. Diagnosis of ischemic stroke using circulating levels of brain-specific proteins measured via high-sensitivity digital ELISA. Brain Res. 2020;1739:146861. doi: 10.1016/j.brainres.2020.146861. [DOI] [PMC free article] [PubMed] [Google Scholar]
- 38.De Marchis GM, Katan M, Barro C, Fladt J, Traenka C, Seiffge DJ. Serum neurofilament light chain in patients with acute cerebrovascular events. Eur J Neurol. 2017 doi: 10.1111/ene.13554. [DOI] [PubMed] [Google Scholar]
- 39.Shichita T, Sugiyama Y, Ooboshi H, Sugimori H, Nakagawa R, Takada I. Pivotal role of cerebral interleukin-17-producing gammadeltaT cells in the delayed phase of ischemic brain injury. Nat Med. 2009;15:946–950. doi: 10.1038/nm.1999. [DOI] [PubMed] [Google Scholar]
- 40.Yan J, Greer JM, Etherington K, Cadigan GP, Cavanagh H, Henderson RD. Immune activation in the peripheral blood of patients with acute ischemic stroke. J Neuroimmunol. 2009;206:112–117. doi: 10.1016/j.jneuroim.2008.11.001. [DOI] [PubMed] [Google Scholar]
- 41.Hartig W, Krueger M, Hofmann S, Preissler H, Markel M, Frydrychowicz C. Up-regulation of neurofilament light chains is associated with diminished immunoreactivities for MAP2 and tau after ischemic stroke in rodents and in a human case. J Chem Neuroanat. 2016;78:140–148. doi: 10.1016/j.jchemneu.2016.09.004. [DOI] [PubMed] [Google Scholar]
- 42.De Marchis GM, Katan M, Weck A, Fluri F, Foerch C, Findling O. Copeptin adds prognostic information after ischemic stroke: results from the CoRisk study. Neurology. 2013;80:1278–1286. doi: 10.1212/WNL.0b013e3182887944. [DOI] [PubMed] [Google Scholar]
- 43.Katan M, Fluri F, Morgenthaler NG, Schuetz P, Zweifel C, Bingisser R. Copeptin: a novel, independent prognostic marker in patients with ischemic stroke. Ann Neurol. 2009;66:799–808. doi: 10.1002/ana.21783. [DOI] [PubMed] [Google Scholar]
- 44.Keshavan A, Heslegrave A, Zetterberg H, Schott JM. Stability of blood-based biomarkers of Alzheimer’s disease over multiple freeze-thaw cycles. Alzheimers Dement. 2018;10:448–451. doi: 10.1016/j.dadm.2018.06.001. [DOI] [PMC free article] [PubMed] [Google Scholar]


