Abstract
Background/Aim: Oral cancer may become advanced because of delay in diagnosis. In order to promote oral cancer screening, simple and highly reliable screening methods that can be implemented at general dental clinics are required. Herein we investigated differential salivary gene expression between oral squamous cell carcinoma (OSCC) patients and healthy volunteers (HV) to identify new biomarkers for OSCC detection. Materials and Methods: Candidate genes were selected by microarrays, nuclear undecaprenyl pyrophosphate synthase 1 (NUS1) and reticulocalbin 1 (RCN1) were selected for further investigation. We used real-time quantitative reverse transcription PCR (qRT-PCR) to determine NUS1 and RCN1 expression levels in saliva and tissues. Results: qRT-PCR analysis of clinical samples revealed that OSCC patients had significantly higher expression of salivary NUS1 and RCN1 than HV. Conclusion: A combination of NUS1 and RCN1 accurately distinguished patients from controls, and this combination can be implemented as a screening test for OSCC.
Keywords: Biomarkers, nuclear undecaprenyl pyrophosphate synthase 1(NUS1), reticulocalbin 1(RCN1), oral squamous cell carcinoma, early detection, cancer
Oral cancers account for approximately 2% of all cancers, and the most common histological type is oral squamous cell carcinoma (OSCC), which accounts for 90% of all oral cancers (1). The survival rate for patients with early-stage OSCC is about 90%; however, despite marked advancements in diagnostic and therapeutic techniques in recent years, the survival rate is only about 30% for advanced stage cancers, which have a poor prognosis (2). In addition, surgical resection is the first choice, although postoperative oral tissue loss in locally advanced cancer cases causes impairment in important functions such as swallowing and speech, resulting in a marked reduction in patients’ quality of life (3). Furthermore, despite the ease of diagnosis, typically by examination of the oral cavity, many cases go undetected and progress to advanced stages (4) because the disease is asymptomatic in the early stages, and adequate routine mucosal examinations are not regularly performed by health care practitioners (5). Therefore, establishment of a screening method that can be easily performed, even in general dental clinics, will facilitate early diagnosis and treatment and an improved cure rate.
In recent years, the search for cancer biomarkers in saliva has intensified. Recent research reports have shown that saliva contains as much information on a person’s health as do blood and urine (6,7). Saliva can be noninvasively, painlessly, and repeatedly collected in any environment, and unlike blood, it can be collected by the patients themselves.
We hypothesized that a comparison of gene expression between the saliva of OSCC patients and that of healthy subjects would allow us to identify new biomarkers for OSCC detection. We, therefore, compared mRNA expression between cancerous and non-cancerous tissues in OSCC patients, as well as between the saliva of OSCC patients and that of healthy subjects, and identified mRNAs with at least a 2-fold change in expression. Then, we further investigated two of these mRNAs as potential biomarkers for use in OSCC screening.
Materials and Methods
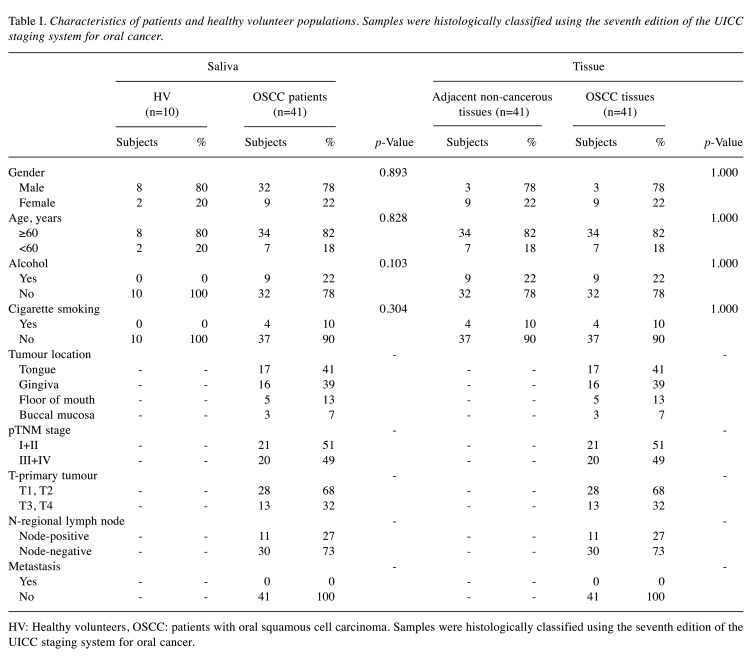
Patients. This study was approved by the Aichi Gakuin University ethics committee (approval number: 66, 74). According to the Declaration of Helsinki, all patients and healthy volunteers provided the written consent for use of their samples in the current research. This study included 41 OSCC patients and 10 healthy volunteers (HV) who visited the Oral and Maxillofacial Surgery Department at the Aichi-Gakuin University Dental Hospital and Japanese Red Cross Nagoya Daiichi Hospital from December 2015 to March 2019. OSCC patients included those with primary cancer who underwent surgical treatment, including tumour resection, neck dissection, and primary reconstruction with microsurgery. HV were hospital staff who had no smoking or drinking habits and were selected to match the sex ratio and age group of the selected OSCC patients. The number of HVs was judged to be sufficient by 10 people based on other saliva-based study (8). The breakdown of OSCC patients is shown in Table I. From these subjects, 51 saliva (OSCC patients: n=41, HV: n=10) and 82 tissue samples (OSCC tissues: n=41, adjacent non-cancerous tissues; n=41) were analysed (Figure 1).
Table I. Characteristics of patients and healthy volunteer populations. Samples were histologically classified using the seventh edition of the UICC staging system for oral cancer.
HV: Healthy volunteers, OSCC: patients with oral squamous cell carcinoma. Samples were histologically classified using the seventh edition of the UICC staging system for oral cancer.
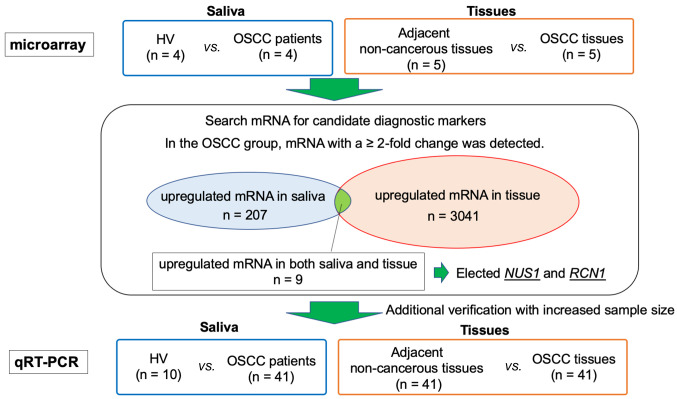
Figure 1. Sample collection and flow-chart of the study. A small number of cases were randomly selected as pilot studies and microarrays were performed. For saliva samples, the OSCC patient group (n=4) was compared with the HV group (n=4), and the expression levels of mRNA were compared. The expression levels of mRNA in tissue samples were compared between the OSCC tissue group (n=5) and the adjacent non-cancerous tissues group (n=5). In saliva, there were 207 mRNAs that demonstrated a >2-fold change in the OSCC patient group, compared to the HV group. In tissue, there were 3,041 mRNAs that demonstrated >2-fold-change in the OSCC tissue group. Nine mRNAs that were up-regulated more than 2-fold in both saliva and tissues were identified, and among these, NUS1 and RCN1 were selected for further investigation. HV: Healthy volunteers, OSCC: patients with oral squamous cell carcinoma.
Tissue collection. Tissue samples of OSCC tissues (n=41) and adjacent non-cancerous tissues (n=41) were obtained from tumour sections immediately after resection. OSCC tissues were collected from the central mucosa of cancerous tissues. Samples were histologically classified using the seventh edition of the UICC staging system for oral cancer. Adjacent non-cancerous tissues were collected from the mucosa of intraoperative margin controls and pathologically diagnosed as healthy. Tissue samples were snap frozen in liquid nitrogen and stored at –80˚C.
Saliva collection. Saliva samples were collected using an Oragene® RNA Self-Collection kit (DNA Genotek Inc., Ottawa, Ontario, Canada). Samples were preferentially collected in the morning to avoid daily salivary biochemical changes. Subjects were instructed to avoid the consumption of all liquids and food for an hour before sampling; this would prevent interference with salivary enzyme levels. Via the spitting technique, subjects were asked to collect 2 ml of their saliva in a tube within 15 min.
Total RNA extraction. Lysate recovery from saliva was performed according to the protocol of the Oragene® RNA Self-Collection kit. Lysate recovery from tissues was performed by homogenizing tissue sections using Buffer RLT included within the RNeasy Mini Kit (Qiagen, Hilden, Germany) and a QIAshredder (Qiagen, Hilden, Germany). Total RNA was extracted from these lysates according to the protocol of the RNeasy Mini Kit (Qiagen). The quality and concentration of the extracted RNA were determined by absorbance measurement using a NanoDrop 1000 (Thermo Scientific, Wilmington, DE, USA). mRNA was then reverse transcribed into cDNA using a QuantiTect Reverse Transcription Kit (Qiagen).
Microarray analysis. For microarray analysis, cDNA was synthesized using a Low Input Quick Amp Labeling Kit (Agilent Technologies, Santa Clara, CA, USA). Complementary RNA (cRNA) was purified using RNeasy mini spin columns (Qiagen), and its quality was tested using the Agilent 2100 BioAnalyzer series II. The concentration was determined by measurement of absorbance with a NanoDrop 1000, and the samples were stored at –80˚C.
cRNA was hybridized to microarrays using a Gene Expression Hybridization Kit (Agilent Technologies). The processed arrays were scanned using a microarray scanner (Agilent Technologies). Data were digitized with Agilent Feature Extraction software and normalized using a 75th percentile shift.
Real-time quantitative reverse transcription PCR (qRT-PCR). To confirm the results of the expression array, quantitative PCR was performed for OSCC tissues (n=41) and adjacent non-cancerous tissues (n=41). In addition, quantitative PCR was performed for the saliva of OSCC patients (n=41) from whom tissue samples could be collected and the saliva of HV (n=10) matched to the OSCC patients by age and sex. qRT-PCR was performed to determine the relative expression levels of NUS1 and RCN1 using TB Green Premix Ex Taq II (Takara Bio, Nojihigashi, Kusatsu, Japan), and it was monitored using a Biosystems7500 (Invitrogen; Thermo Fisher Scientific, Inc., Waltham, MA, USA). The primer sequences for NUS1 were 5’-TTCGGTCCTGTGGACAGCAC-3’ (forward primer) and 5’-CAGACGCTGTTCACAGGCTG-3’ (reverse primer). The primer sequences for RCN1 were 5’-GTGACCTGACAGCTACTCGG-3’ (forward primer) and 5’-CCCCGTTCTTGTCGATGTCC-3’ (reverse primer). GAPDH was used for gene expression normalization; the primer sequences for GAPDH were 5’-TTAGCACCCCTGGCCAAGGT-3’ (forward primer) and 5’-GGCCATCCA CAGTCTTCTGG-3’ (reverse primer). The reaction conditions were as follows: 95˚C at 30 s for preincubation, followed by 40 cycles at 95˚C for 5 s each, annealing at 60˚C for 30 s, and extension at 72˚C for 20 s.
Statistical analysis. The Mann-Whitney test and Student’s t-test were used to compare tissue and salivary concentrations of NUS1 and RCN1 between the OSCC and HV groups. The differential expression of each marker was used to construct receiver operating characteristic (ROC) curves. The area under the ROC curve (AUC) was obtained by numerical integration. A p-value of <0.05 was considered statistically significant. All statistical analyses were performed using R software (The R Foundation for Statistical Computing) on EZR (Saitama Medical Center, Jichi Medical University, Saitama, Japan).
Results
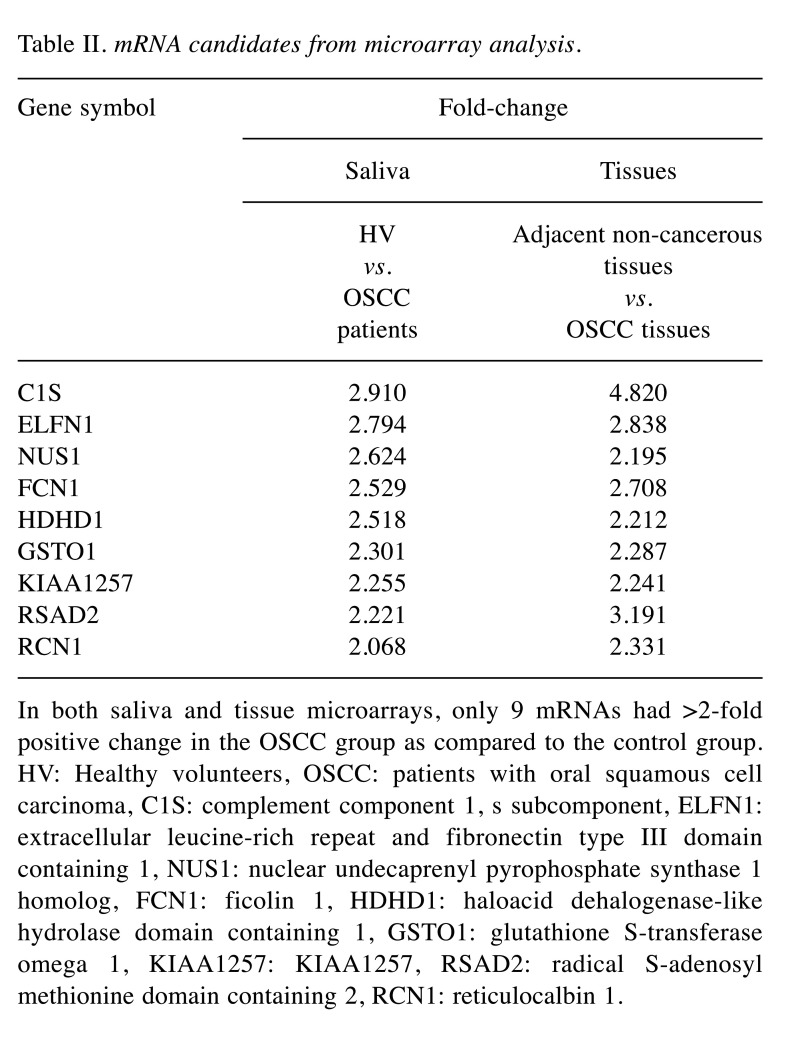
Microarray analysis. Saliva samples of four randomly selected OSCC patients and four HV were compared by microarrays. For tissue samples, five OSCC tissues and five adjacent non-cancerous tissues from five randomly selected OSCC patients were compared by microarray analysis. From these analyses, we identified mRNAs that showed ≥2-fold positive change in saliva and tissue analyses for the OSCC group. We identified 3,041 mRNAs from tissue samples and 207 mRNAs from saliva samples. Among these, only nine mRNAs overlapped between the saliva and tissue analyses (Table II). These nine mRNAs were as follows: C1S, ELFN1, NUS1, FCN1, HDHD1, GSTO1, KIAA1257, RSAD2, and RCN1. Among these mRNAs, GSTO1 had already been reported as a marker associated with OSCC and was excluded because of the lack of novelty. C1S, ELFN1, FCN1, HDHD1, KIAA1257, and RSAD2 had not previously been related to cancer in other organs and it was considered that the mechanism of carcinogenesis was difficult to elucidate at the time of the study. Therefore, they were also excluded.
Table II. mRNA candidates from microarray analysis.
In both saliva and tissue microarrays, only 9 mRNAs had >2-fold positive change in the OSCC group as compared to the control group. HV: Healthy volunteers, OSCC: patients with oral squamous cell carcinoma, C1S: complement component 1, s subcomponent, ELFN1: extracellular leucine-rich repeat and fibronectin type III domain containing 1, NUS1: nuclear undecaprenyl pyrophosphate synthase 1 homolog, FCN1: ficolin 1, HDHD1: haloacid dehalogenase-like hydrolase domain containing 1, GSTO1: glutathione S-transferase omega 1, KIAA1257: KIAA1257, RSAD2: radical S-adenosyl methionine domain containing 2, RCN1: reticulocalbin 1.
NUS1, encoding nuclear undecaprenyl pyrophosphate synthase 1 homolog, also known as Nogo-B receptor (NgBR), is a transmembrane receptor protein identified as a Nogo-B binding protein, and it is mainly expressed in peripheral tissues (9). Nogo-B is a member of the reticulon family of proteins and is found in most tissues (9,10). It has been shown that Nogo-B mediates chemotaxis and morphogenesis of the endoplasmatic reticulum in endothelial cells by binding to its specific NgBR (11). NgBR is known to be involved in several cancers (12-15), and it is highly expressed in late stages of invasive ductal carcinoma and human hepatocellular carcinoma (16-18). Moreover, a recent report showed that NgBR is involved in breast cancer cell growth via modulation of Ras signalling (19,20).
RCN1 encodes reticulocalbin 1, a member of the Ca2+-binding proteins in the secretory pathway, and is localized to the endoplasmic reticulum (21,22). RCN1 is heterogeneously expressed and necessary for cell bioactivity (23). It has been speculated that RCN1 plays a role in Ca2+-dependent cell adhesion (24) because dysregulation of RCN1 has been reported in various diseases, including cancer and cardiovascular and neuromuscular diseases (24,25). The differential expression of RCN1 is correlated with cancer. RCN1 overexpression has been observed in invasive breast cancer cells (26), lung cancer cells (27), colorectal cancer cells (24), gastric cancer cells (28), liver cancer cells (29), prostate cancer cells (30), and kidney cancer (31), suggesting a role for RCN1 in tumorigenesis and invasion.
These results suggest that NUS1 and RCN1 may be markers of cancer in other organs. Consequently, NUS1 and RCN1 were selected as new biomarker candidates for OSCC diagnosis. Further verification and quantification of NUS1 and RCN1 expression levels were then performed using qRT-PCR.
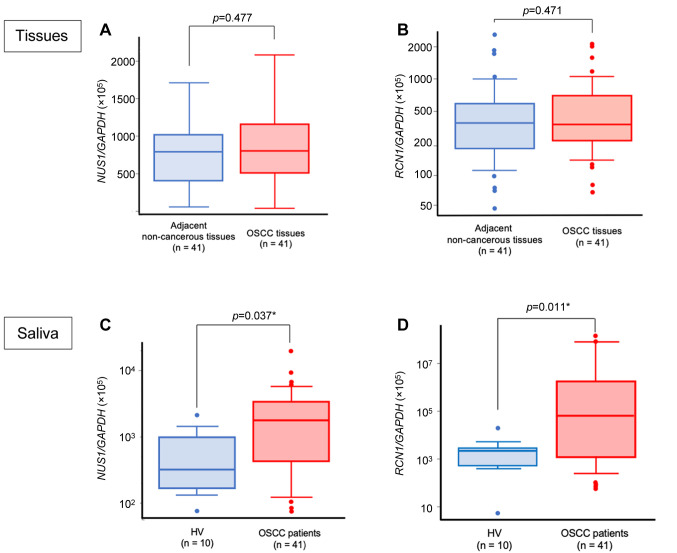
Expression of RCN1 and NUS1 in tissues. GAPDH-normalized expression levels of NUS1 and RCN1 mRNAs in cancer tissue samples collected from OSCC patients ranged from 1.748×10⁻⁴ to 2.070×10⁻³ and 6.821×10⁻⁴ to 2.087×10⁻¹, respectively. Those obtained from non-cancerous tissues ranged from 5.190×10⁻⁵ to 3.529×10⁻³ and 4.610×10⁻⁴ to 2.705×10⁻², respectively (Figure 2A and B). Neither NUS1 nor RCN1 showed a significant difference in expression level between OSCC tissues and the adjacent non-cancerous tissues.
Figure 2. NUS1 and RCN1 expression levels in tissues and saliva. A) Quantitative comparison between OSCC tissues and the adjacent non-cancerous tissues showed no statistically significant difference in NUS1 expression levels (p=0.477). B) Quantitative comparison between OSCC tissues and the adjacent non-cancerous tissues showed no statistically significant difference in RCN1 expression levels (p=0.471). C) OSCC patients had significantly higher expression levels of NUS1 in saliva samples than did the HV group (p=0.037). D) OSCC patients had significantly higher expression levels of RCN1 in saliva samples than did the HV group (p=0.011). HV: Healthy volunteers, OSCC: patients with oral squamous cell carcinoma.
Expression of RCN1 and NUS1 in the saliva of OSCC patients. Using qRT-PCR, we observed that the expression levels of RCN1 and NUS1 in the saliva of OSCC patients (n=41) were evidently up-regulated relative to those in the saliva of HV (n=10).
The ratios of NUS1/GAPDH and RCN1/GAPDH mRNAs in saliva samples collected from OSCC patients ranged from 6.975×10⁻⁴ to 1.875×10⁻¹ and 6.606×10⁻⁴ to 1.438×10³, respectively. For HV, these values ranged from 7.255×10⁻⁴ to 1.993×10⁻² and 5.584×10⁻⁵ to 2.086×10⁻¹, respectively (Figure 2C and D). The NUS1 expression levels were significantly higher in the OSCC group than in the HV group (p=0.037). Similar results were observed for the RCN1 expression levels (p=0.011).
Clinical significance of NUS1 and RCN1 expression levels. In this study, the patient population included 32 men and 9 women aged 28 to 92 years (68.3±13.9 years, mean±SD). Expression levels of RCN1 and NUS1 in saliva and tissues did not correlate with age, sex, and subsite. According to the 7th edition of the UICC classification, patients were staged as follows: stages I and II, 21 patients; stages III and IV, 20 patients. Neither salivary nor tissue expression levels of NUS1 or RCN1 were associated with tumour stage.
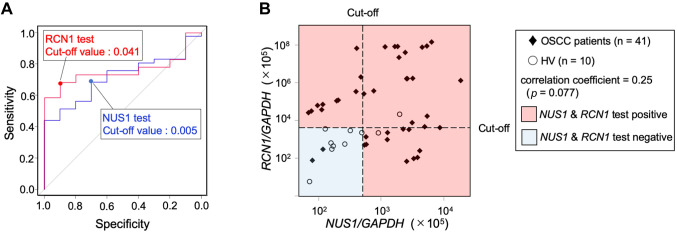
Diagnostic value of RCN1 and NUS1 in OSCC. ROC curves were generated to predict the cut-off value of the target gene mRNA/GAPDH ratio for the two candidate biomarkers. The AUC values were as follows: NUS1, 0.715 [95% confidence interval (CI)=0.567-0.862]; RCN1, 0.759 (95%CI=0.628-0.889) (Figure 3A). The accuracy of OSCC screening by salivary NUS1 at this cut-off value had a sensitivity of 0.683, specificity of 0.707, positive predictive value of 0.903, and negative predictive value of 0.350 (Table III). Thus, the detection ability of OSCC was high, but there was a risk of a false-positive finding for a healthy person.
Figure 3. OSCC screening test by salivary NUS1 and RCN1. A) ROC curves for salivary NUS1 and RCN1 expression levels. Data are derived from NUS1 and RCN1 expression levels of OSCC patients and HV. B) OSCC screening test based on a combination of NUS1 and RCN1 expression levels. The cut-off expression level values for OSCC screening were 0.005 and 0.041 for NUS1 and RCN1, respectively. In the OSCC combination screening test, the red area is positive and the blue area is negative. NUS1 and RCN1 were not significantly correlated (Spearman’s rank correlation coefficients=0.25, p=0.077). HV: Healthy volunteers, OSCC: patients with oral squamous cell carcinoma.
Table III. The accuracy of the screening test when OSCC was determined based on the expression level of NUS1 and RCN1 in saliva.
The accuracy of OSCC screening by salivary RCN1 was as follows: sensitivity, 0.683; specificity, 0.900; positive predictive value, 0.966; negative predictive value, 0.409 (Table III). Thus, the positive and negative predictive values were higher than those for NUS1, whereas the sensitivity was low. The expression levels of the two markers, NUS1 and RCN1, were not significantly correlated (Spearman’s rank correlation coefficients=0.25, p=0.077) (Figure 3B). When these two markers were used in combination for OSCC screening, the sensitivity, specificity, positive predictive value, and negative-predictive value were 0.927, 0.707, 0.927, and 0.707, respectively; thus, the negative predictive value was better than that observed with the use of either marker alone (Table III).
Discussion
In this study, we used transcriptome analysis to identify potential biomarkers among differentially expressed genes between healthy individuals and OSCC patients undergoing curative resection. NUS1 and RCN1 were highly expressed in cancerous tissues according to microarray analysis. However, the results of qRT-PCR performed in all cases for additional verification showed that there was no significant difference between OSCC tissues and adjacent non-cancerous tissues. There was no statistical advantage, but the results were not reversed. This suggests that the majority of samples used for microarray analysis may have belonged to cases with high expression levels in cancerous tissues.
Nevertheless, microarray analysis showed that NUS1 and RCN1 were highly expressed in the saliva of OSCC patients and poorly expressed in the saliva of HV. At the time of saliva collection, there was a concern about the risk of RNA contamination on the tissue surface, but the dissimilarity in results between the saliva and tissue samples confirmed that sampling was unlikely to have been contaminated. There was no difference in mRNA expression levels from tissues, but there was a difference in mRNA expression levels from saliva, suggesting that changes in saliva may be due to environmental factors. Because NUS1 and RCN1 in saliva are environmental factors, identifying the environment they depend on may help in identifying individuals who are more likely to develop OSCC. Because of the small number of smokers and drinkers in this study, the effects of smoking and drinking could not be evaluated. In addition, other environmental factors could not be evaluated because they were not included in the survey items.
Our results suggested that OSCC screening could be performed by examining the expression levels of NUS1 and RCN1 in saliva. However, because NUS1 and RCN1 expression levels were not related to OSCC stage, it was not possible to discriminate between the early and advanced stages of OSCC. The accuracy of OSCC screening using salivary NUS1 was represented by positive and negative predictive values of 0.903 and 0.350, respectively; these results suggested that the salivary NUS1 test has a strong ability to detect OSCC. However, the risk of false-positive findings for healthy subjects was also high, making the test unsatisfactory for OSCC screening. The accuracy of OSCC screening by the salivary RCN1 test was slightly higher than that of screening by the salivary NUS1 test; however, the negative predictive value was 0.409, which was a disadvantage for screening. OSCC oncogenesis has been reported to involve many pathways (e.g., cell proliferation, cell cycle, and signal transduction) (6-8,32). Since NUS1 and RCN1 are involved in carcinogenesis in different pathways, we considered that there was a difference in the accuracy of OSCC screening. Therefore, we concluded that there was no correlation between the expression levels of NUS1 and RCN1 in saliva. We considered that a negative result in both tests would improve the negative predictive value. When we used both these markers for screening, the accuracy of OSCC screening was improved to 0.700 in terms of the negative predictive value, while the sensitivity, specificity, and positive predictive values were also maintained.
This study had certain limitations. First it included a small sample size. Second, we did not evaluate the saliva of patients with leukoplakia. Increasing the number of OSCC patients and HV will strengthen the statistical relevance of our findings in terms of the cut-off value and accuracy of the screening test. Additional assessment of saliva from patients with leukoplakia might further confirm that increased NUS1 and RCN1 expression could be a promising indicator of the risk of OSCC development. Further sample collection is necessary in the future.
In conclusion, saliva can be easily collected by any person by means of an appropriate kit, which facilitates its use for OSCC screening. We showed that assessment of NUS1 and RCN1 expression in saliva can be a useful screening test for OSCC.
Conflicts of Interest
The Authors have no conflicts of interest directly relevant to the content of this article.
Authors’ Contributions
SU and SN conceived the study concept and design, analysed data and wrote the manuscript. SU, KH, SM, SH, MG, DS, IO, TN, KS and SN contributed to data acquisition and interpretation. SU contributed to statistical analysis. SU, KH, SM, SH, MG, DS, IO, TN, KS and SN revised the draft. All Authors have read and approved the final version of the manuscript.
Acknowledgements
This research was supported by a JSPS KAKENHI grant (grant number 16K 15831). The Authors would like to thank Editage (www.editage.com) for their assistance with English language editing.
References
- 1.Siegel RL, Miller KD, Jemal A. Cancer Statistics, 2016. CA Cancer J Clin. 2016;66:7–30. doi: 10.3322/caac.21332. [DOI] [PubMed] [Google Scholar]
- 2.Chinn SB, Myers JN. Oral cavity carcinoma: Current management, controversies, and future directions. J Clin Oncol. 2015;33:3269–3276. doi: 10.1200/JCO.2015.61.2929. [DOI] [PMC free article] [PubMed] [Google Scholar]
- 3.Morimata J, Otomaru T, Murase M, Haraguchi M, Sumita Y, Taniguchi H. Investigation of factor affecting health-related quality of life in head and neck cancer patients. Gerodontology. 2013;30:194–200. doi: 10.1111/j.1741-2358.2012.00662.x. [DOI] [PubMed] [Google Scholar]
- 4.Holmes JD, Dierks EJ, Homer LD, Potter BE. Is detection of oral and oropharyngeal squamous cancer by a dental health care provider associated with a lower stage at diagnosis. J Oral Maxillofac Surg. 2003;61:285–291. doi: 10.1053/joms.2003.50056. [DOI] [PubMed] [Google Scholar]
- 5.McGurk M, Chan C, Jones J, O’Regan E, Sherriff M. Delay in diagnosis and its effect on outcome in head and neck cancer. Br J Oral Maxillofac Surg. 2005;43:281–284. doi: 10.1016/j.bjoms.2004.01.016. [DOI] [PubMed] [Google Scholar]
- 6.Cheng Y-S, Rees T, Wright J. A review of research on salivary biomarkers for oral cancer detection. Clin Transl Med. 2014;3(3) doi: 10.1186/2001-1326-3-3. [DOI] [PMC free article] [PubMed] [Google Scholar]
- 7.Gualtero DF, Suarez Castillo A. Biomarkers in saliva for the detection of oral squamous cell carcinoma and their potential use for early diagnosis: A systematic review. Acta Odontol Scand. 2016;74:170–177. doi: 10.3109/00016357.2015.1110249. [DOI] [PubMed] [Google Scholar]
- 8.Gai C, Camussi F, Broccoletti R, Gambino A, Cabras M, Molinaro L, Carossa S, Camussi G, Arduino PG. Salivary extracellular vesicle-associated miRNAs as potential biomarkers in oral squamous cell carcinoma. BMC Cancer. 2018;18(1) doi: 10.1186/s12885-018-4364-z. [DOI] [PMC free article] [PubMed] [Google Scholar]
- 9.Huber AB, Weinmann O, Brösamle C, Oertle T, Schwab ME. Patterns of Nogo mRNA and protein expression in the developing and adult rat and after CNS Lesions. J Neurosci. 2002;22:3553–3567. doi: 10.1523/jneurosci.22-09-03553.2002. [DOI] [PMC free article] [PubMed] [Google Scholar]
- 10.Long S-L, Li Y-K, Xie Y-J, Long Z-F, Shi J-F, Mo Z-C. Neurite outgrowth inhibitor B receptor: a versatile receptor with multiple functions and actions. DNA Cell Biol. 2017;36:1142–1150. doi: 10.1089/dna.2017.3813. [DOI] [PubMed] [Google Scholar]
- 11.Miao RQ, Gao Y, Harrison KD, Prendergast J, Acevedo LM, Yu J, Hu F, Strittmatter SM, Sessa WC. Identification of a receptor necessary for Nogo-B stimulated chemotaxis and morphogenesis of endothelial cells. Proc Natl Acad Sci USA. 2006;103:10997–11002. doi: 10.1073/pnas.0602427103. [DOI] [PMC free article] [PubMed] [Google Scholar]
- 12.Wu D, Zhao B, Qi X, Peng F, Fu H, Chi X, Robert Q, Shao S. Nogo-B receptor promotes epithelial e mesenchymal transition in non- small cell lung cancer cells through the Ras/ERK/Snail1 pathway. Cancer Lett. 2018;418:135–146. doi: 10.1016/j.canlet.2018.01.030. [DOI] [PMC free article] [PubMed] [Google Scholar]
- 13.Jin Y, Hu W, Liu T, Rana U, Aguilera-barrantes I, Duan Y, Shi A, Song D, Yang M, Li S, Han B, Zhao G. Nogo-B receptor increases the resistance of estrogen receptor positive breast cancer to paclitaxel. Cancer Lett. 2018;419:233–244. doi: 10.1016/j.canlet.2018.01.054. [DOI] [PMC free article] [PubMed] [Google Scholar]
- 14.Zhao B, Xu B, Hu W, Song C, Wang F, Liu Z, Ye M, Zou H, Miao QR. Comprehensive proteome quantification reveals NgBR as a new regulator for epithelial-mesenchymal transition of breast tumor cells. J Proteomics. 2015;112:38–52. doi: 10.1016/j.jprot.2014.08.007. [DOI] [PMC free article] [PubMed] [Google Scholar]
- 15.Calik J, Pula B, Piotrowska A, Wojnar A, Witkiewicz W, Grzegrzolka J, Podhorska-Okolow M, Dziegiel P. Prognostic significance of NOGO-A/B and NOGO-B receptor expression in malignant melanoma - a preliminary study. Anticancer Res. 2016;36:3401–3407. [PubMed] [Google Scholar]
- 16.Wang B, Zhao B, North P, Kong A, Huang J, Miao QR. Expression of NgBR is highly associated with estrogen receptor alpha and survivin in breast cancer. PLoS ONE. 2013;8 doi: 10.1371/journal.pone.0078083. [DOI] [PMC free article] [PubMed] [Google Scholar]
- 17.Dong C, Zhao B, Long F, Liu Y, Liu Z. Nogo-B receptor promotes the chemoresistance of human hepatocellular carcinoma via the ubiquitination of p53 protein. Oncotarget. 2016;7:8850–8865. doi: 10.18632/oncotarget.7091. [DOI] [PMC free article] [PubMed] [Google Scholar]
- 18.Pula B, Olbromski M, Owczarek T, Ambicka A, Witkiewicz W, Ugorski M, Rys J, Zabel M, Dziegiel P, Podhorska-Okolow M. Nogo-B receptor expression correlates negatively with malignancy grade and Ki-67 antigen expression in invasive ductal breast carcinoma. Anticancer Res. 2014;34:4819–4828. [PubMed] [Google Scholar]
- 19.Zhao B, Hu W, Kumar S, Gonyo P, Rana U, Liu Z, Wang B, Duong WQ, Yang Z, Williams CL, Miao QR. The Nogo-B receptor promotes Ras plasma membrane localization and activation. Oncogene. 2017;36:3406–3416. doi: 10.1038/onc.2016.484. [DOI] [PMC free article] [PubMed] [Google Scholar]
- 20.Holcomb J, Doughan M, Spellmon N, Lewis B, Perry E, Zhang Y, Nico L, Wan J, Chakravarthy S, Shang W, Miao Q, Stemmler T, Yang Z. SAXS analysis of a soluble cytosolic NgBR construct including extracellular and transmembrane domains. PLoS ONE. 2018;13:1–11. doi: 10.1371/journal.pone.0191371. [DOI] [PMC free article] [PubMed] [Google Scholar]
- 21.Ozawa M, Muramatsu T. Reticulocalbin, a novel endoplasmic reticulum resident Ca(2+)-binding protein with multiple EF-hand motifs and a carboxyl-terminal HDEL sequence. J Biol Chem. 1993;268:699–705. [PubMed] [Google Scholar]
- 22.Feng X, Matsuo K, Zhang T, Hu Y, Mays AC, Browne JD, Zhou X, Sullivan CA. MicroRNA profiling and target genes related to metastasis of salivary adenoid cystic carcinoma. Anticancer Res. 2017;37:3473–3481. doi: 10.21873/anticanres.11715. [DOI] [PubMed] [Google Scholar]
- 23.Fukuda T, Oyamada H, Isshiki T, Maeda M, Kusakabe T, Hozumi A, Yamaguchi T, Igarashi T, Hasegawa H, Seidoh T, Suzuki T. Distribution and variable expression of secretory pathway protein reticulocalbin in normal human organs and non-neoplastic pathological conditions. J Histochem Cytochem. 2007;55:335–345. doi: 10.1369/jhc.6A6943.2006. [DOI] [PubMed] [Google Scholar]
- 24.Nimmrich I, Erdmann S, Melchers U, Finke U, Hentsch S, Moyer MP, Hoffmann I, Muller O. Seven genes that are differentially transcribed in colorectal tumor cell lines. Cancer Lett. 2000;160:37–43. doi: 10.1016/s0304-3835(00)00553-x. [DOI] [PubMed] [Google Scholar]
- 25.Grzeskowiak R, Witt H, Drungowski M, Thermann R, Hennig S, Perrot A, Osterziel KJ, Klingbiel D, Scheid S, Spang R, Lehrach H, Ruiz P. Expression profiling of human idiopathic dilated cardiomyopathy. Cardiovasc Res. 2003;59:400–411. doi: 10.1016/s0008-6363(03)00426-7. [DOI] [PubMed] [Google Scholar]
- 26.Liu Z, Brattain MG, Appert H. Differential display of reticulocalbin in the highly invasive cell line, MDA-MB-435, versus the poorly invasive cell line, MCF-7. Biochem Biophys Res Commun. 1997;231:283–289. doi: 10.1006/bbrc.1997.6083. [DOI] [PubMed] [Google Scholar]
- 27.Chen X, Shao W, Huang H, Feng X, Yao S, Ke H. Overexpression of RCN1 correlates with poor prognosis and progression in non-small cell lung cancer. Hum Pathol. 2019;83:140–148. doi: 10.1016/j.humpath.2018.08.014. [DOI] [PubMed] [Google Scholar]
- 28.Sinha P, Poland J, Schnolzer M, Celis JE, Lage H. Characterization of the differential protein expression associated with thermoresistance in human gastric carcinoma cell lines. Electrophoresis. 2001;22:2990–3000. doi: 10.1002/1522-2683(200108)22:14<2990::AID-ELPS2990>3.0.CO;2-F. [DOI] [PubMed] [Google Scholar]
- 29.Yu LR, Zeng R, Shao XX, Wang N, Xu YH, Xia QC. Identification of differentially expressed proteins between human hepatoma and normal liver cell lines by two-dimensional electrophoresis and liquid chromatography-ion trap mass spectrometry. Electrophoresis. 2000;21:3058–3068. doi: 10.1002/1522-2683(200108)22:14<2990::AID-ELPS2990>3.0.CO;2-F. [DOI] [PubMed] [Google Scholar]
- 30.Cooper CR, Graves B, Pruitt F, Chaib H, Lynch JE, Cox AK, Sequeria L, van Golen KL, Evans A, Czymmek K, Bullard RS, Donald CD, Sol-Church K, Gendernalik JD, Weksler B, Farach-Carson MC, Macoska JA, Sikes RA, Pienta KJ. Novel surface expression of reticulocalbin 1 on bone endothelial cells and human prostate cancer cells is regulated by TNF-alpha. J Cell Biochem. 2008;104:2298–2309. doi: 10.1002/jcb.21785. [DOI] [PubMed] [Google Scholar]
- 31.Giribaldi G, Barbero G, Mandili G, Daniele L, Khadjavi A, Notarpietro A, Ulliers D, Prato M, Minero VG, Battaglia A, Allasia M, Bosio A, Sapino A, Gontero P, Frea B, Fontana D, Destefanis P. Proteomic identification of Reticulocalbin 1 as potential tumor marker in renal cell carcinoma. J Proteomics. 2013;91:385–392. doi: 10.1016/j.jprot.2013.07.018. [DOI] [PubMed] [Google Scholar]
- 32.Oak ASW, Bocheva G, Kim T-K, Brozyna AA, Janjetovic Z, Athar M, Tuckey RC, Slominski AT. Noncalcemic vitamin D hydroxyderivatives inhibit human oral squamous cell carcinoma and down-regulate Hedgehog and WNT/beta-catenin pathways. Anticancer Res. 2020;40:2467–2474. doi: 10.21873/anticanres.14216. [DOI] [PMC free article] [PubMed] [Google Scholar]


