

Abstract
Outbreak of COVID-19, created a disastrous situation in more than 200 countries around the world. Thus the prediction of the future trend of the disease in different countries can be useful for managing the outbreak. Several data driven works have been done for the prediction of COVID-19 cases and these data uses features of past data for future prediction. In this study the machine learning (ML)-guided linear regression model has been used to address the different types of COVID-19 related issues. The linear regression model has been fitted into the dataset to deal with the total number of positive cases, and the number of recoveries for different states in India such as Maharashtra, West Bengal, Kerala, Delhi and Assam. From the current analysis of COVID-19 data it has been observed that trend of per day number of infection follows linearly and then increases exponentially. This property has been incorporated into our prediction and the piecewise linear regression is the best suited model to adopt this property. The experimental results shows the superiority of the proposed scheme and to the best of our knowledge this is a new approach towards the prediction of COVID-19.
Keywords: COVID-19, Unlock, Machine learning (ML), Linear regression, Doubling rate
Introduction
The pandemic Corona Virus Disease (COVID-19) has spread all over the world and every country is trying their way to contain the disease. On March 11, 2020, WHO declared the outbreak of COVID-19 as a global pandemic. Some countries like Taiwan, South Korea, Vietnam, New Zealand, Germany, France etc. successfully control the disease but many countries including India, USA, and Brazil is still struggling to suppress the pandemic. After lockdown up to 31st May 2020, Government of India started to unlock the country in a phased manner because it was not possible for a developing country like India to bear the financial losses of prolonged shut down of the entire country. From 1st June 2020 to 30th June 2020 has been declared as unlock-1, 1st July 2020 to 31st July 2020 has been declared as unlock-2 and from 1st August 2020 to 31st August 2020 has been declared as unlock-3. In all these unlock phases Government of India have provided guidelines to general people as well as different organizations about how to operate/perform businesses, transportations, festivals and other social and commercial activities. A visual representation of the pandemic along with time frame and important decision of the Indian Government has been given in Fig. 1. Till today, indeed, no matter whatever actions/ precautions/ decisions Government of India has taken, the spread of COVID-19 across the different states of the country couldnt be stopped, which creates panic to millions of people all over the country. Almost all the states across India, the new cases as well as deaths are increasing exponentially. Because of the increase in the number of patients with limited healthcare-related infrastructures, some states have started to impose lockdown either partially or fully from the middle of July during unlock phase-2. Due to this increased complexity in normal life, it has impacted the financial health of the different country and to anticipate additional resource requirements to combat COVID-19, the prediction of future development trend of the pandemic has become a very popular research topic in recent days. Various mathematical and statistical forecasting tools [1–5] were applied to generate short-term and long-term forecasts. Multiple machine learning tools such as multiple regression analysis [6], progressive partial derivative linear regression model [7], and a hybrid approach of the auto regressive integrated moving average model and wavelet-based forecasting model [8] have also been applied to make these predictions.
Fig. 1.

Timeline diagram of COVID-19
Different types of COVID-19 related issues has been addressed in this study, with the help of the piecewise regression Model, such as total number of positive cases, and the number of recoveries for different states in India such as Maharashtra, West Bengal, Kerala, Delhi and Assam. Our observation from the COVID-19 data is that it follows the linear trend within a few days and after which pattern becomes non-linear. This property has been incorporated in piecewise linear regression, which is best suited model to adopt this linear property. Moreover, the proposed scheme is also used to predict the number of total confirmed cases, active positive cases, and recoveries.
We have chosen these five states because Maharashtra is the most affected state where the number of positive cases is maximum while West Bengal is within the top ten most affected states in India. The situation in Delhi and Kerala is a bit different from other states, while in Delhi the number of cases is decreasing in recent days, but in Kerala after controlling their daily infection rate, the number of positive cases per days increasing further. We have included Assam also in our study because, in northeast India, Assam is the state where the number of positive cases per day is increasing in alarming rate although initially, Assam was very much successful to combat the spreading of the disease by taking corrective and preventive measures in advance. However, no states have yet become successful to cure COVID-19 completely. Therefore, it is important to detect the epidemic pattern for planning the early action to combating COVID-19. Machine Learning (ML) can help us to infer useful knowledge from past massive epidemic data. Several researchers [8–12] have adopted machine learning based approach to analyze COVID-19 cases.
ML is subdomain of Artificial Intelligence (AI) [13, 14]. It can intelligently solve a variety of problems with the help of learning from the recorded information. Generally, ML algorithms are classified into supervised learning and unsupervised learning [15]. Regression analysis, a part of Supervised learning is a powerful statistical tool to utilizes previous experience or example data in making prediction through the learning strategy. Based on the various learning strategies, there are many regression models such as linear regression, logistic regression, multiple regression, piecewise/ stepwise regression, etc. [16–18].
In this paper, we use piecewise linear regression approach to predict and track the spreading of the virus. The proposed scheme can be a magnificent weapon for early alerts against battling COVID-19. The main contributions of this paper are given below:
Forecast and track COVID-2019 in several states of India.
Predicting positive COVID-19 cases in the next 45 days with the help of piecewise regression analysis.
Finding the cure cases from coronavirus in coming 45 days.
Motivates other researchers of utilizing piecewise linear regression model for prediction.
The rest of the paper is organized as follows. An overview of doubling exponential model and piecewise regression approach is presented in Section 2. Section 3 provides the experimental results and discusses in detail the trend of COVID-19 cases. Finally in Sect. 4, conclusions and future work are depicted.
Prediction of COVID-19 cases: piecewise regression approach
In this section, we have discussed in details of our proposed scheme based linear regression model for prediction of the number of total confirmed cases, active positive cases, and recoveries. Firstly, infection spreading has been discussed, followed by the linear regression model used in the proposed work. In the proposed scheme, different types of data of various states such as data for confirmed cases, active positive cases, and recoveries have been collected.
Infection spreading: doubling exponential model
We have defined the infection spreading from the concept of exponential growth function or in particularly from the doubling exponential. First we describe the double exponent in brief and then it shows how the infection spreading is adopted from the doubling exponential. So far, many mathematical models characterized the early epidemic growth feature follow an exponential curve. Some of them characterized the exponential growth by the doubling time. The doubling time implies the time taken for the number of infections to double from a given day. We have also adopted the doubling concept with the different interpretation. Hence, for our model we consider the exponential function as.
| 1 |
Here, instead of finding the number of infections at time t, we find the doubling time from the given y(t) i.e. the number of positive cases. In our experiment, define the doubling time as the number of days taken to become the double of the current count. Mathematically it can be defined as, if n is the positive case count at time t then is the positive case count at time at a time , where is the doubling time. It is clear that the doubling time is inversely proportional to the infection spread. Therefore, the higher the doubling time indicates that the infection is spreading slowly. On the other hand, a lower doubling time signifies the faster spread of infection and the constant doubling time implies the infection growing at a constant exponential rate. The minimum doubling time indicated the most growing rate could be considered at the peak point of the pandemic. There are several external interventions like social distancing, lockdown, and containment of the red zone of infection, number of testing per day, etc. varies the doubling time. The infection spreading is shown by the following graphical representation. Since the doubling time is inversely proportional to the infection spread, hence for the graphical representation we have used the following technique. As we know that the higher doubling time indicates, the infection is spreading slowly, and lower doubling time indicates an infection is spreading rapidly, i.e. we can say that doubling time is inversely proportional to the infection spreading. Therefore, for better visualization, we give the graphical representation infection spreading of positive cases over time rather than doubling time vs number of positive cases. Where the infection spreading is calculated by the formula (maximum doubling time - doubling time). For example, we have the doubling time (Table 1) 2, 36, 3, 10, 3, 6, 22, 36, 12 and 14. The maximum doubling time = 36 then we have the value of infection spreading () = 34, () =0, () =33, () = 26, and so on.
Table 1.
Actual and predicted positive COVID-19 cases
| Date | 10-09-2020 | 10-09-2020 | 20-09-2020 | 30-09-2020 | 30-10-2020 |
|---|---|---|---|---|---|
| States | (Actual) | (Predicted) | (Predicted) | (Predicted) | (Predicted) |
| Assam | 1,33,066 | 1,32,990 | 1,57,308 | 1,81,493 | 2,54,048 |
| Delhi | 2,01,174 | 1,99,853 | 2,31,106 | 2,61,737 | 3,53,629 |
| Kerala | 95,917 | 95,007 | 1,22,020 | 1,48,601 | 2,28,344 |
| Maharashtra | 9,67,349 | 9,64,669 | 11,63,802 | 13,62,804 | 19,59,811 |
| West Bengal | 1,90,063 | 1,90,021 | 2,20,700 | 2,51380 | 3,43,419 |
For better visualization and insight, we consider the states Maharashtra, Delhi, Kerala, West Bengal and Assam and shows in Fig. 2. Figure 2 clearly shows that initially it is a highly spreading situation. But, practically that was not happened; the graph shows it because of the initial low value. The positive case starts with one, then it became double as two, four, and so on but it does not mean high infection but is the boundary value problem. Next, it shows the infection spreading reaches the highest level i.e. the peak and gradually spreading became low and again it is gradually high. It indicates in the state Kerala there is a second phase infection spreading is going on. The most notable case for Delhi, it shows that it is gradually diminishing the spreading curve. On the other hand, for the state West Bengal the spreading is tends to high.
Fig. 2.
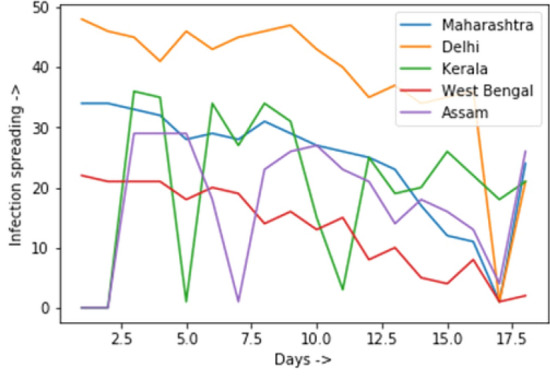
Infection spreading of the states Maharashtra, Delhi, Kerala, West Bengal and Assam
Piecewise linear regression model
In our prediction model the piecewise linear regression have been used, it is a special case of the linear regression. Sometimes data do not follow the linear pattern as shown in Fig. 3a. However, if it still tries to model them using the linear regression then it will not be properly correlated. When such a model uses to predict, then it results high error value. In that situation, one line simply is not enough to fit the data, then the concept of piecewise linear regression comes to overcome such limitation as depicted in Fig. 3b. When the data set follows different linear trends over the different partitions of data, then we should model the regression function in several pieces. Each linear regression is corresponding to a partition is the pieces and the pieces are connected or not connected depends on the data and the problem. In case of connections, the connecting points are known as the break points, i.e. the points where the slope changes.
Fig. 3.

Piecewise correlation regression lines
The point at is the joining point of two lines, i.e., a breakpoint. Our assumption is that the regression function to be continuous at the breakpoint, the two values for y need to be equal at the breakpoint (when x = p), i.e., we have the relation
The same concept can be extended for more than two breakpoints, and it depends on the data. To implement this model from a given data set, the main challenge is to partition the data set for the piecewise regression. In other words, the problems are to find out the breakpoints from the data set. In our experiment, we have done by finding the slope of the consecutive pairwise points, i.e., if there are n points, then there will be such slopes. From these slopes, whenever there is an abrupt change, then we consider that point is the breakpoint. This is done by the heuristic approach by the observation of the slopes.
Results and discussion
This section presents the experimental results in detail and discusses trend possibilities in the future. In our prediction, we have considered the training data up to 10th September 2020. The prediction results of confirm and cure cases of COVID-19 upto 30-10-2020 are listed in Tables 1 and 2 respectively. The source of the dataset used in this paper for the COVID-19 outbreak of India is Kaggle [19].
Table 2.
Actual and predicted recovery COVID-19 cases
| Date | 10-09-2020 | 10-09-2020 | 20-09-2020 | 30-09-2020 | 30-10-2020 |
|---|---|---|---|---|---|
| States | (Actual) | (Predicted) | (Predicted) | (Predicted) | (Predicted) |
| Assam | 1,03,504 | 9,89,54 | 1,24,626 | 1,45,862 | 2,09,573 |
| Delhi | 1,72,763 | 1,71,443 | 1,93,583 | 2,14,689 | 2,78,006 |
| Kerala | 70,917 | 69,272 | 92,858 | 1,14,589 | 1,79,782 |
| Maharashtra | 6,86,462 | 6,88,788 | 8,08,798 | 9,32,495 | 13,03,587 |
| West Bengal | 1,62,992 | 1,64,101 | 1,94,388 | 2,25,604 | 3,19,251 |
Analysis of active positive
The cumulative confirm cases and daily confirm cases of COVID-19 for selected states in India are shown in Fig. 4. Cumulative confirmed and daily confirmed COVID-19 cases has increased exponentially in Maharashtra, whereas also would be increased further in near future as per our predicted model. However, it has been spotted that daily confirmed cases in Delhi is decreasing in nature and following the same trend in upcoming days. Also, from our study, it is inferred that in the case of Kerala, West Bengal and Assam follows the same current trend in the upcoming month. Figure 6 shows cumulative confirm cases and daily confirm cases of COVID-19 for five states separately.
Fig. 4.

Positive COVID-19 cases of selected states in India :a cumulative confirmed cases, b daily confirm cases for selected states in India. The 0 in horizontal line represents the date of the reported first case of COVID-19 (30/01/2020) in India
Fig. 6.

Cumulative confirm vs. cumulative recovery cases in different states a Assam b Delhi c Kerala d Maharashtra and e West Bengal
Analysis of recovery cases
Figure 5 provide the cumulative recovery cases and daily recovery cases respectively of COVID-19 for selected states in India. The predicted results for cumulative confirm cases are also shown in Table 2. In the earlier section, we have seen that the maximum cumulative and daily basis positive active cases have been found in the state of Maharashtra. And the same trend has been observed in Maharashtra for the current and predicted recovery cases from COVID-19. Sometimes, Delhi has also reported maximum daily recovery cases. Also, from our study, it is perceived that in the case of Kerala, West Bengal and Assam follows the same current trend in the upcoming month.
Fig. 5.

Cure COVID-19 cases of selected states in India :a cumulative cure cases, b daily cure cases for selected states in India. The 0 in horizontal line represents the date of the reported first case of COVID-19 (30/01/2020) in India
Comparison with existing approach
A comparison is carried out with an existing other system on the regression model of a sixth-degree polynomial [8]. For the compatibility, we have considered the same training data as of that system and predicted the dated as they predicted. The training data is used in [8] from 1st March to 11th April 2020 and predicted for the next seven days i.e. from 12th April to 18th April 2020. On the other hand, our proposed approach uses the training data from 1st March, 2020 to 10th September 2020 and predicts confirm and cure cases till 30th October, 2020. Moreover, the proposed model also addresses the cure cases which is missing in [8]. Table 3 and Fig. 7 gives the details of the comparison.
Table 3.
Comparison with Singh’s scheme [8]
| No | Parameter | Existing system [8] | Our proposed system |
|---|---|---|---|
| 1 | Used model | Sixth degree polynomial regression | Piecewise linear regression |
| 2 | Training data set used | Upto 11-04-2020 | Upto 10-09-2020 |
| 3 | Forecast | Only next 6 days | Next 50 days |
| 4 | Prediction of confirm case | Yes | Yes |
| 5 | Prediction of cure case | No | Yes |
| 6 | State-wise analysis | No | Yes |
Fig. 7.
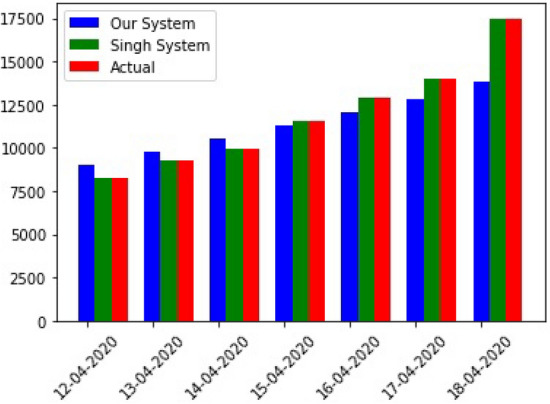
Graphical comparison of the system performance with Singh’s [8] approach
Evaluation methods
The magnitude of relative error (MRE) and mean absolute percentage error (MAPE) are mostly used to measure the accuracy of regression based prediction model [20, 21]. The performance of the proposed scheme is evaluated using the magnitude of relative error (MRE) and mean absolute percentage error (MAPE). The magnitude of relative error (MRE) is defined as
| 2 |
and the mean absolute percentage error (MAPE) is
| 3 |
where is actual value, is the predicted value and N is total number of observations.
Table 4 presents the values of MRE and MAPE for both of the positive COVID-19 cases and recovery COVID-19 cases. A lower MRE value indicates that data are scattered close to the regression line. Correspondingly small value of MAPE denotes that the differences between the actual and predicted values are small. Therefore, it can be concluded from Table 4 that the actual and predicted values are much closed.
Table 4.
MRE and MAPE for the proposed scheme
| State | Positive COVID-19 cases | Recovery cases of COVID-19 | ||
|---|---|---|---|---|
| MRE | MAPE | MRE | MAPE | |
| Assam | 0.00057 | 0.392 | 0.04396 | 1.6996 |
| Delhi | 0.00656 | 0.00764 | ||
| Kerala | 0.00948 | 0.02319 | ||
| Maharashtra | 0.00277 | 0.00339 | ||
| West Bengal | 0.00022 | 0.00680 | ||
Conclusion
The COVID-19 outbreaks have become a disaster for several nations. However, the recovery rate of COVID-19 in India is more than 88%. In this study, we have proposed the piecewise linear regression based machine learning approach for the prediction of actual positive cases and recovery cases of five different states in India. The main novelty of the proposed scheme is that we have applied piecewise linear regression method instead of simple linear regression. As a result, the proposed scheme produces an accurately predicted result for both cases. Henceforth, it may be concluded that our model could be applicable for other parameters of COVID-19 also in any state or country as well.In the future, we will focus on developing various ML- and DL-based model to enhance the performance to combat COVID-19 as well as other pandemic may be.
The main challenge to implement the piecewise linear regression is to find the point of partition of data .In this paper, the partition has been done by observing the slope of the point heuristically and we have considered the past 7 days data to predict the next day. In future, our aim is to solve the problem to find an optimal partitioning point such that the error becomes minimum.
Contributor Information
Apurbalal Senapati, Email: a.senapati@cit.ac.in.
Amitava Nag, Email: amitava.nag@cit.ac.in.
Arunendu Mondal, Email: a.mondal@cit.ac.in.
Soumen Maji, Email: s.maji@cit.ac.in.
References
- 1.Li Q, Guan X, Wu P, Wang X, Zhou L, Tong Y, Ren R, Leung KS, Lau EH, Wong JY, Xing X. Early transmission dynamics in Wuhan, China, of novel corona virus infected pneumonia. N Engl J Med. 2020;382:1199–1207. doi: 10.1056/NEJMoa2001316. [DOI] [PMC free article] [PubMed] [Google Scholar]
- 2.Wu JT, Leung K, Leung GM. Now casting and forecasting the potential domestic and international spread of the 2019-nCoV outbreak originating in Wuhan, China: a modelling study. Lancet. 2020;395(10225):689–697. doi: 10.1016/S0140-6736(20)30260-9. [DOI] [PMC free article] [PubMed] [Google Scholar]
- 3.Fanelli D, Piazza F. Analysis and forecast of COVID-19 spreading in China, Italy and France. Chaos Solitons Fractals. 2020;134:109761. doi: 10.1016/j.chaos.2020.109761. [DOI] [PMC free article] [PubMed] [Google Scholar]
- 4.Kucharski AJ, Russell TW, Diamond C, Liu Y, Edmunds J, Funk S, Eggo RM, Sun F, Jit M, Munday JD, Davies N. Early dynamics of transmission and control of COVID-19: a mathematical modelling study. Lancet Infect Dis. 2020;20:553–558. doi: 10.1016/S1473-3099(20)30144-4. [DOI] [PMC free article] [PubMed] [Google Scholar]
- 5.Zhuang Z, Zhao S, Lin Q, Cao P, Lou Y, Yang L, He D. Preliminary estimation of the novel coronavirus disease (COVID-19) cases in Iran: a modelling analysis based on overseas cases and air travel data. Int J Infect Dis. 2020;94:29–31. doi: 10.1016/j.ijid.2020.03.019. [DOI] [PMC free article] [PubMed] [Google Scholar]
- 6.Ghosal S, Sengupta S, Majumder M, Sinha B. Prediction of the number of deaths in India due to SARS-CoV-2 at 56 weeks. Diabetes Metabo Syndr Clin Res Rev. 2020;14:311315. doi: 10.1016/j.dsx.2020.03.017. [DOI] [PMC free article] [PubMed] [Google Scholar]
- 7.Kavadi MDP, Patan R, Ramachandran M, Gandomi AH. Partial derivative nonlinear global pandemic machine learning prediction of covid 19. Chaos Solitons Fractals. 2020;5:110056. doi: 10.1016/j.chaos.2020.110056. [DOI] [PMC free article] [PubMed] [Google Scholar]
- 8.Yadav RS (2020) Data analysis of COVID-2019 epidemic using machine learning methods: a case study of India. Int J Inf Technol 1–10 [DOI] [PMC free article] [PubMed]
- 9.Nemati Mohammadreza, Ansary Jamal, Nemati Nazafarin. Machine-learning approaches in COVID-19 survival analysis and discharge-time likelihood prediction using clinical data. Patterns. 2020;1(5):1–7. doi: 10.1016/j.patter.2020.100074. [DOI] [PMC free article] [PubMed] [Google Scholar]
- 10.Punn NS, Sonbhadra SK, Agarwal S (2020) COVID-19 epidemic analysis using machine learning and deep learning algorithms. medRxiv. 10.1101/2020.04.08.20057679
- 11.Khanday Akib Mohi, Din Ud, et al. Machine learning based approaches for detecting COVID-19 using clinical text data. Int J Inf Technol. 2020;12:1–9. doi: 10.1007/s41870-020-00495-9. [DOI] [PMC free article] [PubMed] [Google Scholar]
- 12.Chakraborty T, Ghosh I. Real-time forecasts and risk assessment of novel coronavirus (COVID-19) cases: a data-driven analysis. Chaos Solitons Fractals. 2020 doi: 10.1016/j.chaos.2020.109850. [DOI] [PMC free article] [PubMed] [Google Scholar]
- 13.Chakraborti Satarupa, Choudhary Aditi, Singh Avantika, Kumar Raunak, Swetapadma Aleena. A machine learning based method to detect epilepsy. Int J Inf Technol. 2018;10(3):257–263. [Google Scholar]
- 14.Wason Ritika. Deep learning: evolution and expansion. Cogn Syst Res. 2018;52:701–708. doi: 10.1016/j.cogsys.2018.08.023. [DOI] [Google Scholar]
- 15.Verma KK, Singh BM, Dixit A (2019) A review of supervised and unsupervised machine learning techniques for suspicious behavior recognition in intelligent surveillance system. Int J Inf Technol 1–14
- 16.Yang X, Yang H, Zhang F, Zhang L, Fan X, Ye Q, Fu L. Piecewise linear regression based on plane clustering. IEEE Access. 2019;7:29845–29855. doi: 10.1109/ACCESS.2019.2902620. [DOI] [Google Scholar]
- 17.Verma Gaurav, Kumar Rahul, Khare Vijay. Regression based FPGA power estimation tool ( FPETool ) for embedded multiplier block. Int J Inf Technol. 2019;11(4):795–798. [Google Scholar]
- 18.Itoo F, Satwinder S (2020) Comparison and analysis of logistic regression, Nave Bayes and KNN machine learning algorithms for credit card fraud detection. Int J Inf Technol 1–9
- 19.COVID-19 in India, dataset on novel corona virus disease 2019 in India. https://www.kaggle.com/sudalairajkumar/covid19-in-india. Accessed 30 July 2020
- 20.Morley SK (2016) Alternatives to accuracy and bias metrics based on percentage errors for radiation belt modeling applications. No. LA-UR-16-24592. Los Alamos National Lab. (LANL), Los Alamos, NM (United States). 10.2172/1260362
- 21.Rastogi K, Lohani D, Acharya D (2020) An IoT-based system to evaluate indoor air pollutants using grey relational analysis. In: 2020 International conference on COMmunication Systems and NETworkS (COMSNETS), Bengaluru, India, pp 762–767. 10.1109/COMSNETS48256.2020.9027308