Abstract
Background
Clinical management decisions on prostate cancer (PCa) are often based on a determination of risk. 68Ga-prostate-specific membrane antigen (PSMA)-11-positron emission tomography (PET)/computer tomography (CT) is an attractive modality to assess biochemical recurrence of PCa, detect metastatic disease and stage of primary PCa, making it a promising strategy for risk stratification. However, due to some limitation of 68Ga-PSMA-11 the development of alternative tracers is of high interest. In this study, we aimed to investigate the value of 18F-PSMA-1007 in identifying non-metastatic high-risk PCa.
Methods
A total of 101 patients with primary non-metastatic PCa who underwent 18F-PSMA-1007 PET/CT were retrospectively analyzed. According to the European Association of Urology guidelines on PCa, patients were classified into intermediate-risk (IR) group or high-risk (HR) group. The maximum standardized uptake values (SUVmax) of the primary prostate tumor were measured on PET/CT images. The diagnostic performance of PET/CT for IR and HR PCa was calculated, and the relationship between the SUVmax of primary prostate tumor, prostate-specific antigen (PSA) level and Gleason score (GS) was analyzed.
Results
Of all 101 patients, 49 patients were classified into IR group and 52 patients were classified into HR group. There was a significant positive correlation between PSA level/GS and SUVmax (r = 0.561, r = 0.496, P < 0.001, respectively). Tumors with GS 6 and 7a showed significantly lower 18F-PSMA-1007 uptake compared to patients with GS 8 and 9 (P < 0.01). SUVmax in patients of HR was significantly higher than those of IR (median SUVmax: 16.85 vs 7.80; P < 0.001). In receiver operating characteristic curve analysis, the optimal cutoff value of the SUVmax for identifying high-risk PCa was set as 9.05 (area under the curve: 0.829; sensitivity: 90.4%; specificity: 65.3%).
Conclusion
18F-PSMA-1007 PET/CT showed the powerful diagnosis efficacy for high-risk PCa, which can be used as an objective imaging reference index for clinical reference.
Keywords: 18F-PSMA-1007, Prostate cancer, High risk
Background
PCa is one of the most common tumors in men worldwide [1]. Patients with those high-risk features (defined by the EAU guidelines on prostate cancer as T2c disease and/or sum Gleason score > 7 and/or serum PSA > 20 ng/ ml) predict a higher risk of metastasis, recurrence or death. The conventional method of identifying high-risk disease in the preliminary diagnosis fails to meet clinical needs. There is a need to develop new methods to allow for appropriate risk stratification for management, such as active surveillance programs, definitive therapy, prostatectomy, radiotherapy or up-front androgen deprivation. Incorporation of imaging to current primary PCa classifications for risk stratification can help achieve that unmet clinical need [2].
PSMA is a membrane-bound enzyme with high expression in prostate cancer cells and low expression in benign prostatic tissue [3]. Over the past few years, targeted imaging of PSMA has been used in various clinical managements, such as imaging-guided biopsy, staging of primary tumor, localization of biochemical relapse, planning of radiotherapy, prediction and assessment of tumor response to systemic therapy [4–7]. The PSMA expression level of PCa and tumor level, Gleason score and PSA stage before treatment have been proved definitely correlated, and the expression levels have been found to be a predictor for PCa progression [8–10]. PSMA-based PET/CT has also been reported to be enabling better tumor detection rate than standard radiologic imaging procedures [11].
Currently, 68Ga-PSMA-11 is a widely used tracer for PET imaging applications in the detection of PCa. Nevertheless, the disadvantage of 68Ga-PSMA PET/CT is that it has more bladder activity, as tracer accumulation in the urinary tract may influence the uptake evaluation of the prostate bed [12]. Recently, the new PSMA tracer, 18F-PSMA-1007, can eliminate this kind of disadvantage because of its hepatobiliary excretion owing to its moderate lipophilic characteristics. It has been used as a promising new PET tracer in the management of PCa [13, 14]. Furthermore, 18F-PSMA-1007 has longer half-life and higher physical spatial resolution than 68Ga-PSMA PET/CT, because 18F is cyclotron-produced with the larger activity amount [13]. In previous studies, 18F-PSMA-1007 has been reported that the intensity of tracer accumulation in the primary tumors of PCa patients correlated to GS and PSA level, and it is promising for accurate local staging of PCa [13, 15, 16]. Furthermore, it has similar or better diagnostic performance than 68Ga-PSMA-11 in local recurrence or metastasis [14, 17]. However, the major limitation of the studies is the relatively small number of patients, and there is limited published data on the diagnosis efficacy of 18F-PSMA-1007 PET/CT for high-risk PCa.
Thus, we intended to measure the intensity of tracer uptake in the primary prostate tumor and evaluate the value of 18F-PSMA-1007 PET/CT noninvasive imaging diagnostic strategies to identify the high-risk of PCa and tried to establish an objective imaging reference index.
Materials and methods
Patients
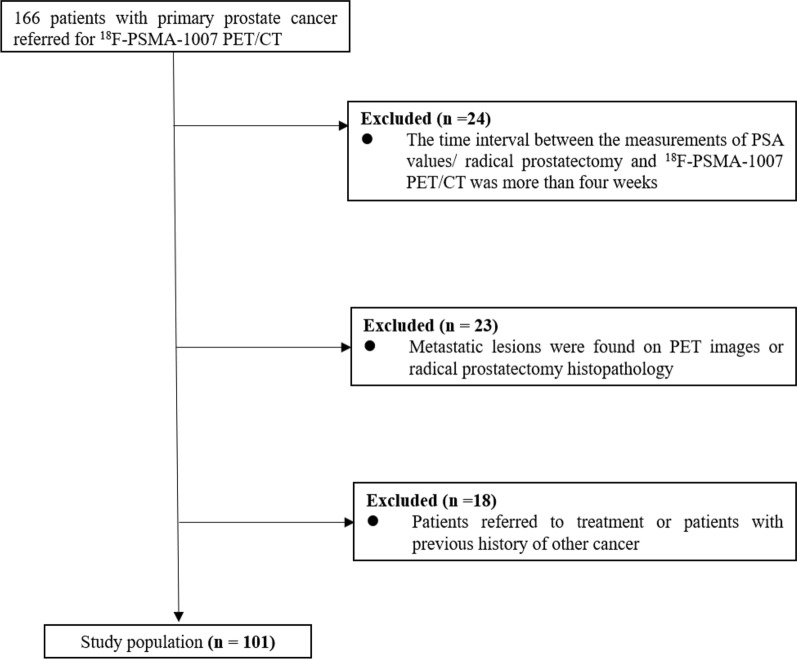
In this retrospective study, we included the medical records of 101 PCa patients who underwent 18F-PSMA-1007 PET/CT imaging at our institution between March 2019 and August 2020. The inclusion criteria were: (1) all patients who underwent 18F-PSMA-1007 PET/CT imaging need complete clinical data; (2) all patients need to have radical prostatectomy (RP) histopathology. The exclusion criteria were: (1) the time interval between the measurements of PSA values/RP and 18F-PSMA-1007 PET/CT was more than 4 weeks (2) metastatic lesions were found on PET images or RP histopathology; (3) patients referred to treatment or patients with previous history of other cancer (Fig. 1). According to the EAU guidelines on prostate cancer [18], all patients were divided into Intermediate-risk (IR) group or high-risk (HR) group. The patients of the IR need to meet at least one of the following criteria: (1) PSA: 10–20 ng/ml; (2) Gleason score 7; (3) cT2b. As the same, the patients of the HR need to meet at least one of the following criteria: (1) PSA > 20 ng/ml; (2) Gleason score 8–10; (3) above cT2c. Due to the retrospective nature of the study, no formal approval from the ethics committee was required according to our national legislation.
Fig. 1.
Flowchart of patient selection
Radiopharmaceutical
18F-PSMA-1007 precursor, cassettes and reagents for the synthesis of 18F-PSMA-1007 were obtained from ABX advanced biochemical compounds (Radeberg, Germany). 18F-PSMA-1007 was prepared in a GE TracerLab FN synthesizer according to the one-step procedure described previously [19]. The radiochemical purity of the final product was > 90% as determined by high-performance liquid chromatography.
Imaging protocol
18F-PSMA-1007 images were acquired from a body PET/CT scanner (Gemini 64 TF, Philips Medical Systems, Best, The Netherlands) and were performed approximately 120 min after IV injection of 4.0 MBq/kg 18F-PSMA-1007 (median activity: 291.2 MBq; range: 185.0–366.3 MBq). For attenuation correction, a low-dose unenhanced CT scan was performed from the skull base to the middle of the thigh, with the following parameters: tube voltage of 140 Kvp, tube current of 110 mA, detector collimation of 64 × 0.625 mm, pitch of 0.829, a tube rotation speed of 0.5 s, section thickness of 5 mm and reconstruction thickness of 2.5 mm, and was followed by the PET scan that matched the CT section thickness. A three-dimensional mode was used to obtain PET images with the following parameters: field of view, 576 mm; matrix of 144 × 144; slice thickness and interval, 5 mm. The emission scan time for each bed position was 1.5 min and the overlap between two adjacent bed positions was 50%.
Image analysis
All 18F-PSMA PET/CT images were analyzed using a dedicated workstation (EBW3.0, Philips), which allowed the review of PET, CT and fused imaging data in axial, coronal and sagittal slices. PET imaging was interpreted independently by 2 experienced nuclear medicine physicians both of whom have more than 10 years of clinical experience and blind of all relevant clinical statistics. Any disagreement was resolved by consensus.
SUVmax of the primary tumors were acquired from the most intense uptake area in prostate gland. Areas in the whole body having uptake above the background activity were defined as metastatic. Typical pitfalls such as PSMA uptake in sacral and coeliac ganglia or in the stellate ganglia were frequently observed but were not considered pathological [20]. This interpretation criterion comes from the result of our clinical experience and consistent with published literature [21–24].
Statistical analysis
Data analyses were performed with SPSS version 23.0 software (SPSS, Chicago, IL). Associations between GS, PSA value, and SUVmax of the primary tumor were described descriptively (nonparametric Spearman correlation coefficients). The differences between different subgroups were evaluated by using the Mann–Whitney U test and Kruskal–Wallis test. ROC curve analysis was used to determine the optimal cutoff value of the SUVmax for identifying high-risk PCa. For all statistical parameters, P values of less than 0.05 were considered statistically significant.
Results
Patients’ characteristics
The clinical characteristics of the enrolled 101 patients with GS 6–9 are summarized in Table 1. Among the 101 patients, the median age was 69 years (43–87 years). The proportions of patients enrolled in different subgroups were 51.5% and 48.5% for HR versus IR. All patients presented with a median PSA value of 11.113 ng/ml before the PET/CT scan (range: 0.970–178.200 ng/ml). The median SUVmax of all tumors was 11.6 (range: 4.3–77.7). (showed in Table 1).
Table 1.
Patient characteristics
| Patients (n) | 101 |
| Age median (range) | 69 years (43–87) |
| PSA median (range) | 11.113 ng/ml (0.970–178.200) |
| IR(n) | 49 |
| HR(n) | 52 |
| GS | |
| GS 6 | 4 |
| GS 7a | 30 |
| GS 7b | 37 |
| GS 8 | 9 |
| GS 9 | 21 |
| Clinical T-stage | |
| T1c | 41 |
| T2a | 9 |
| T2b | 7 |
| T2c | 39 |
| T3a | 2 |
| T3b | 3 |
N, number; IR, intermediate-risk group; HR, high-risk group; GS, Gleason score; GS 7a corresponds to GS 3 + 4; GS 7b corresponds to GS 4 + 3
Correlation analysis
There was a statistically significant difference in median SUVmax between patients of HR and those of IR (16.85 vs 7.80, P < 0.001; Table 2). For the Gleason score, the detailed information about the SUVmax values of different GS subgroups was summarized in Table 3. Gleason score and SUVmax of primary tumors showed a significant positive correlation with each other (r = 0.496, P < 0.001). Combining GS and tumor-related tracer uptake, lower median SUVmax value was found in the subgroups GS 6 (SUVmax: 5.35) and GS 7a (SUVmax: 8.70) than in GS 7b (SUVmax: 11.60), GS 8 (SUVmax: 18.08) and GS 9 (SUVmax: 19.00). The result of Kruskal–Wallis test showed that the differences in SUVmax value between tumors with GS 6/7a and those with GS 8/9 were statistically significant (P < 0.01, respectively). Figures 2 and 3 show two examples for a GS 7a and a GS 9 PCa. A comparison of SUVmax for all GS subgroups is illustrated in Fig. 4. In terms of PSA level, there was a significant and strong positive correlation between the PSA value and the corresponding SUVmax value of the primary tumors (r = 0.561, P < 0.001).
Table 2.
SUVmax value and PSA level of the primary tumor in different risk groups
| N | SUVmax, median (range) | SUVmax, mean ± SD | PSA, median (range) | PSA, mean ± SD | |
|---|---|---|---|---|---|
| IR | 49 | 7.80 (4.30–30.80) | 10.03 ± 5.79 | 7.04 (0.970–18.190) | 7.98 ± 3.604 |
| HR | 52 | 16.85 (6.40–77.70) | 22.30 ± 15.97 | 21.81 (3.640–178.200) | 25.95 ± 26.573 |
Table 3.
SUVmax value of all primary prostate cancer in different Gleason score subgroups
| N | SUVmax, median (range) | SUVmax, mean ± SD | |
|---|---|---|---|
| GS 6 | 4 | 5.35 (4.30–6.50) | 5.38 ± 0.84 |
| GS 7a | 30 | 8.70 (4.90–24.80) | 10.19 ± 5.28 |
| GS 7b | 37 | 11.60 (5.12–77.70) | 15.72 ± 13.52 |
| GS 8 | 25 | 18.08 (8.70–66.50) | 27.99 ± 18.33 |
| GS 9 | 21 | 19.00 (6.40–66.20) | 23.35 ± 14.13 |
| Total | 101 | 11.60 (4.30–77.70) | 16.34 ± 13.60 |
Fig. 2.
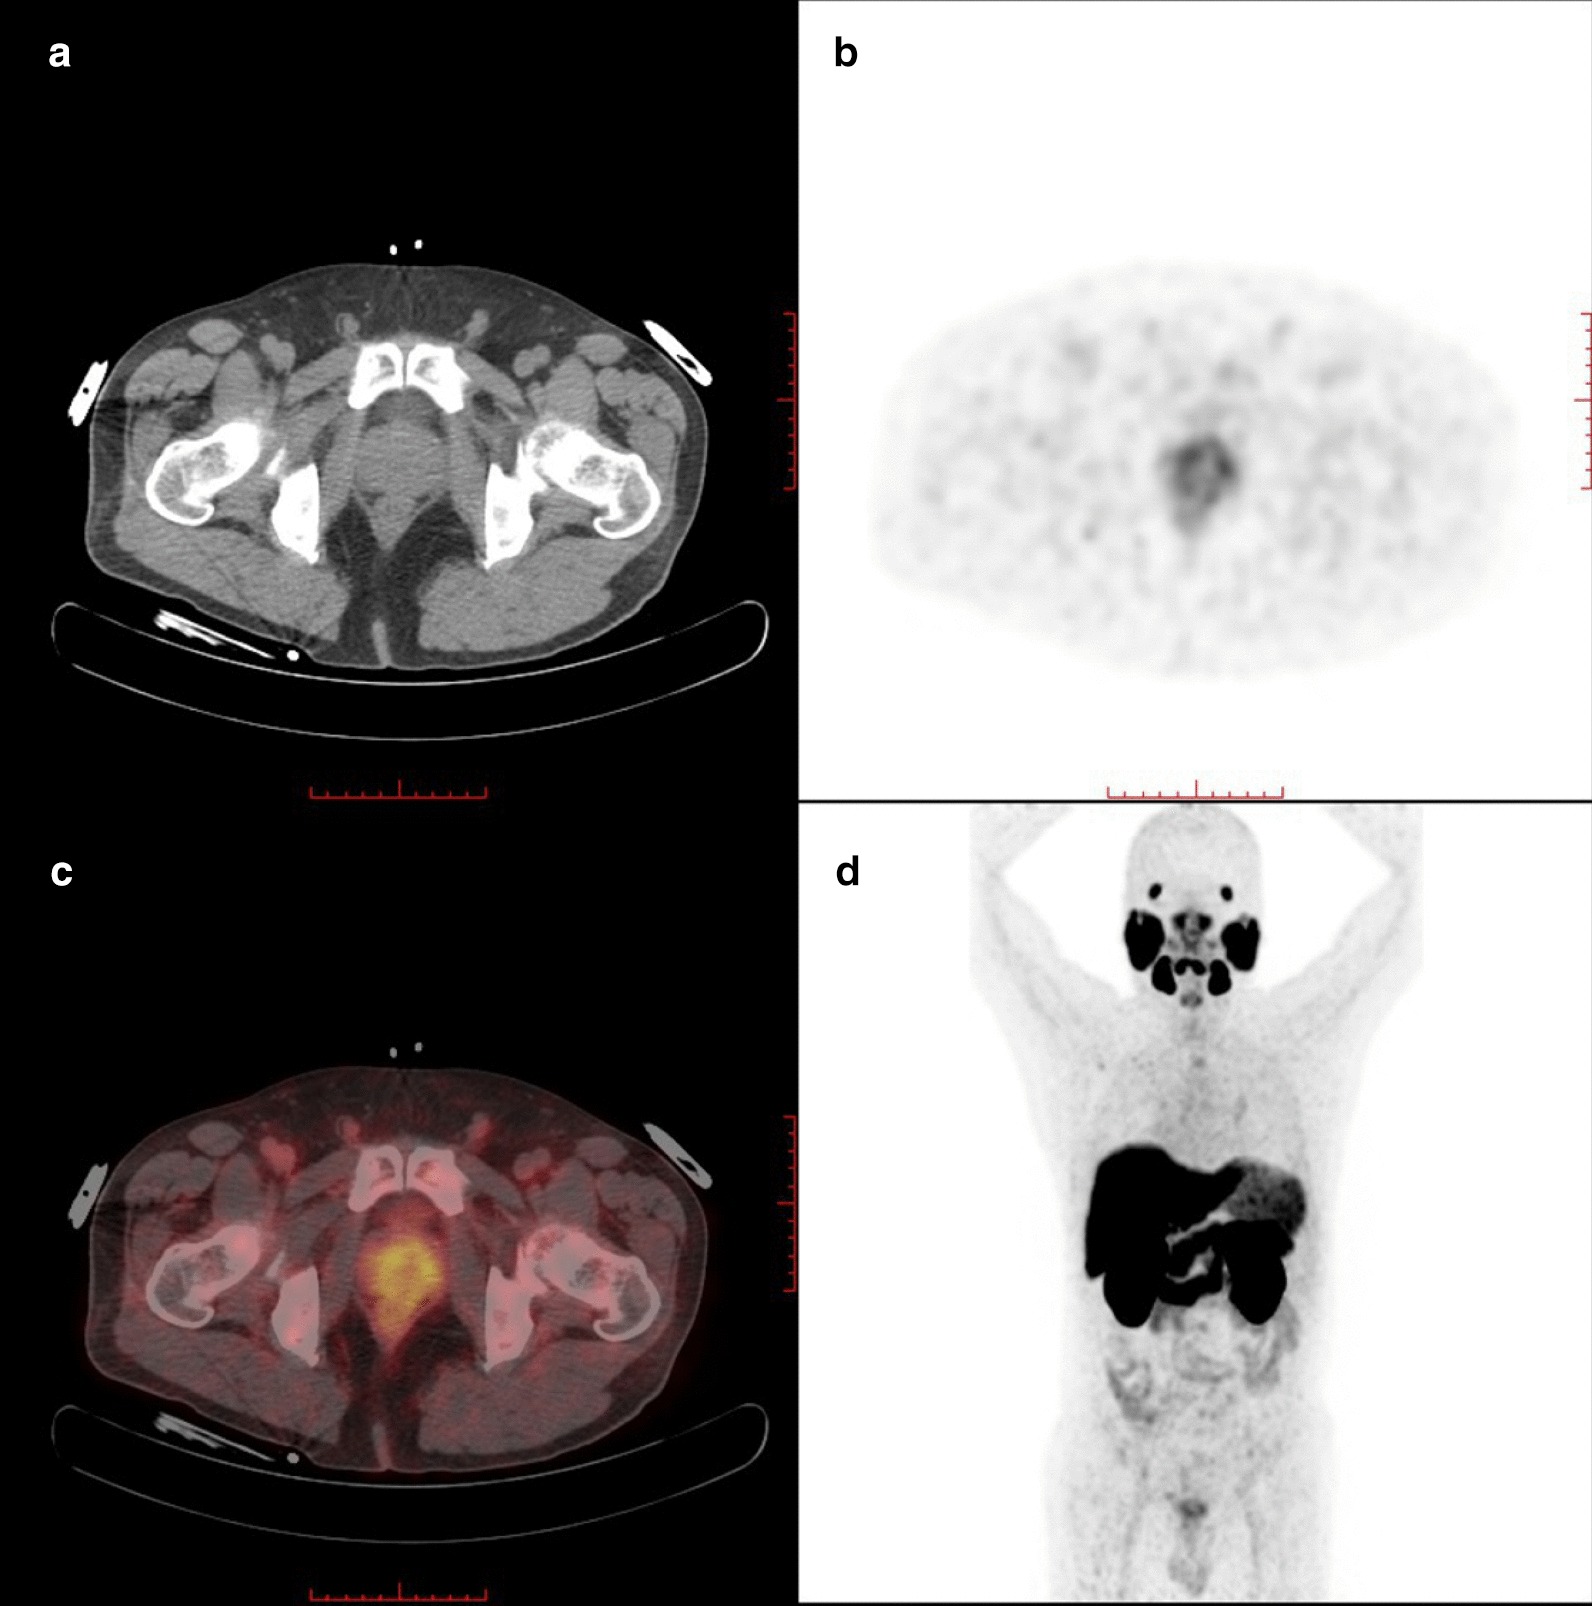
18F-PSMA-1007 PET/CT with CT (a), axial PET (b), and fused PET/CT (c) and maximum-intensity projection (d) images of a 56-year-old patient (GS, 7a; PSA, 6.780 ng/ml). This patient was classified into IR group. Axial PET (b) and fused PET/CT (c) images showed light scattered 18F-PSMA-1007 uptake in both sides of prostate gland (SUVmax: 5.20)
Fig. 3.
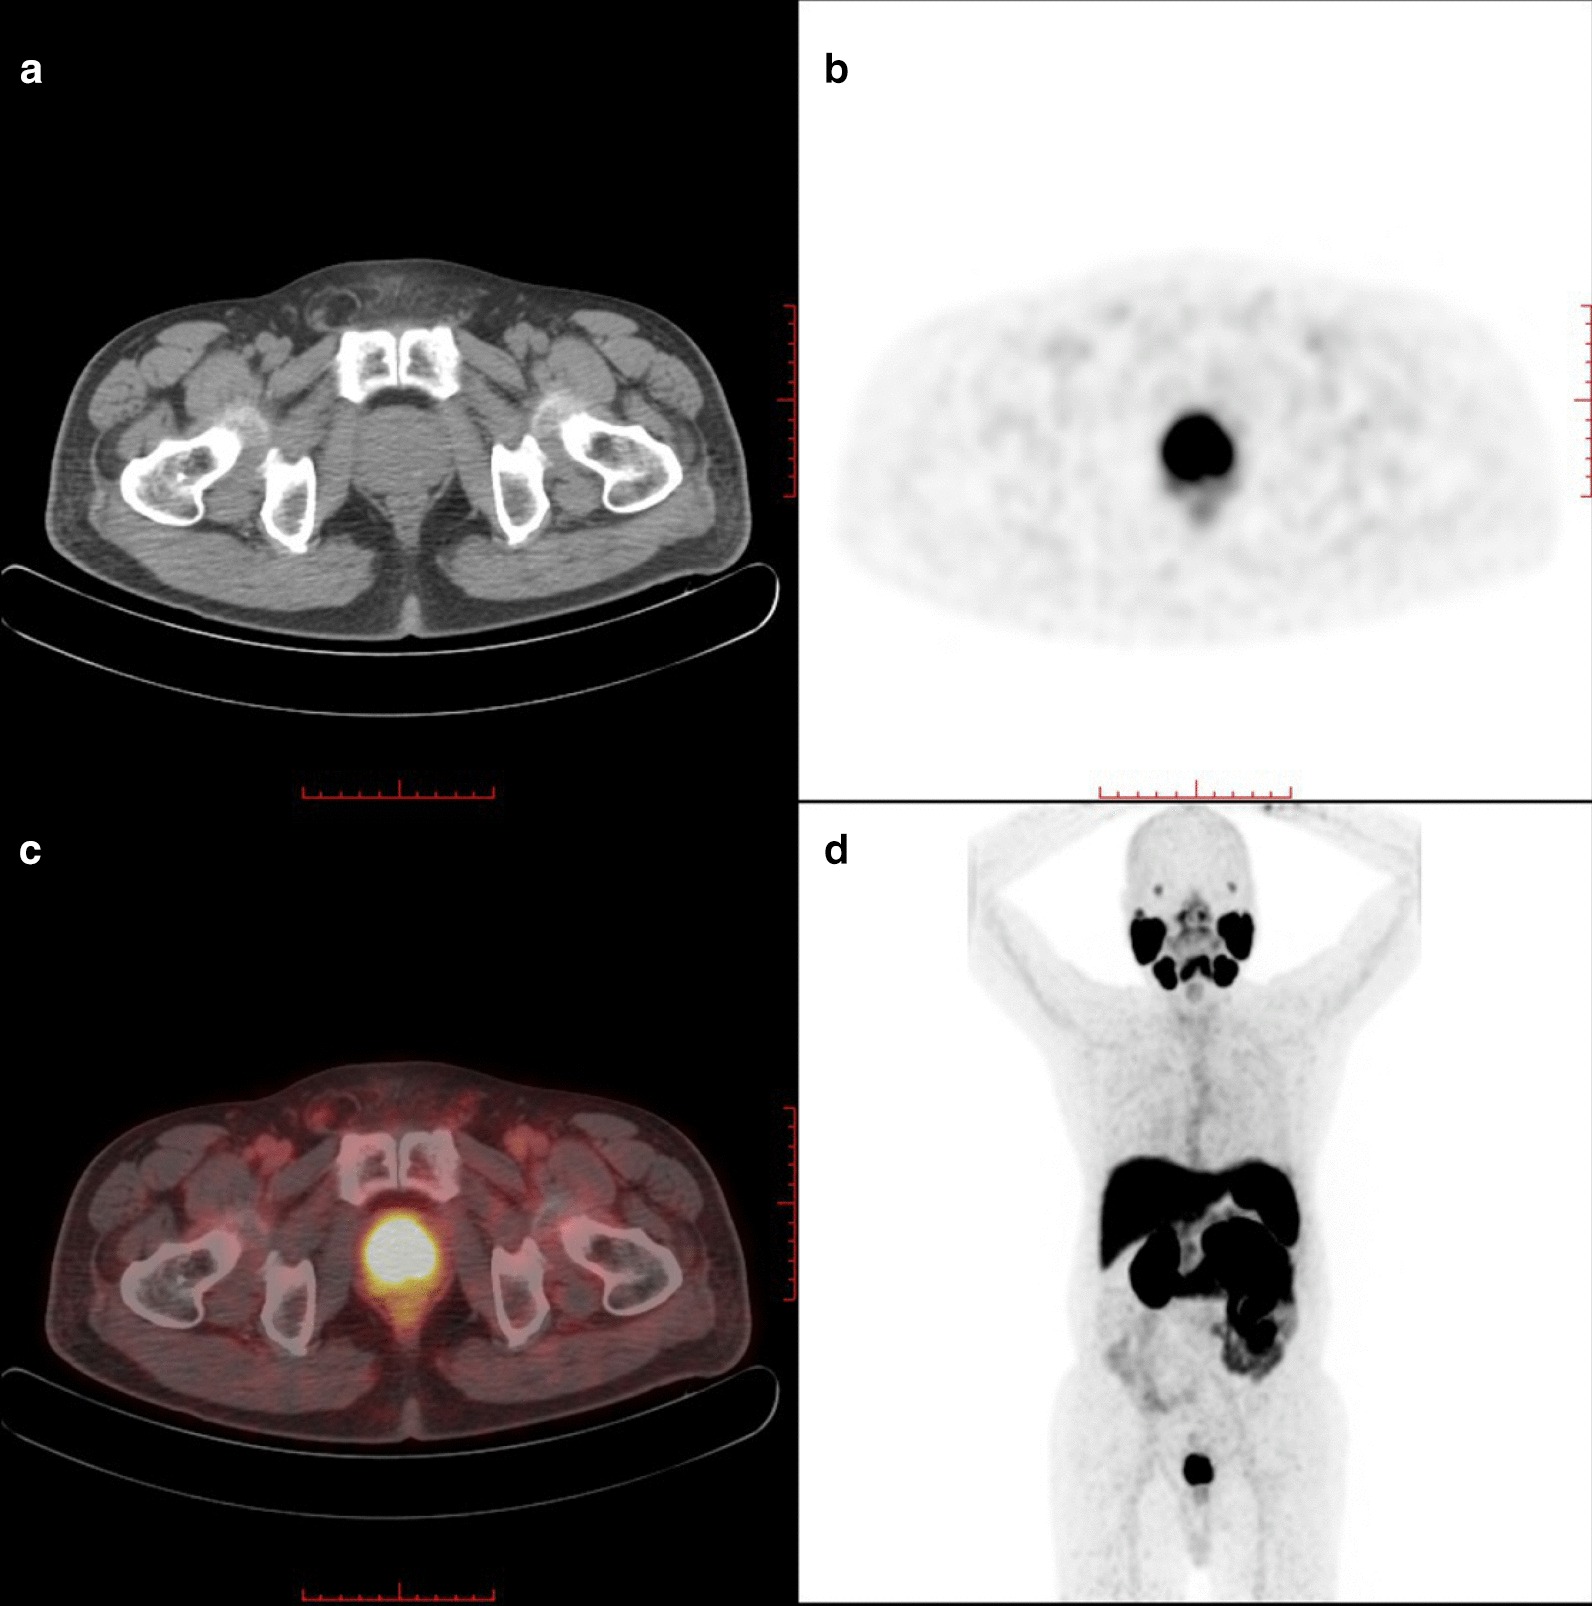
18F-PSMA-1007 PET/CT with CT (a), axial PET (b), fused PET/CT (c) and maximum-intensity projection (d) images of a 70-year-old patient (GS, 9; PSA, 37.910 ng/ml). This patient was classified into HR group. Axial PET (b) and fused PET/CT (c) images showed diffuse hypermetabolism in the prostate gland (SUVmax: 20.20)
Fig. 4.
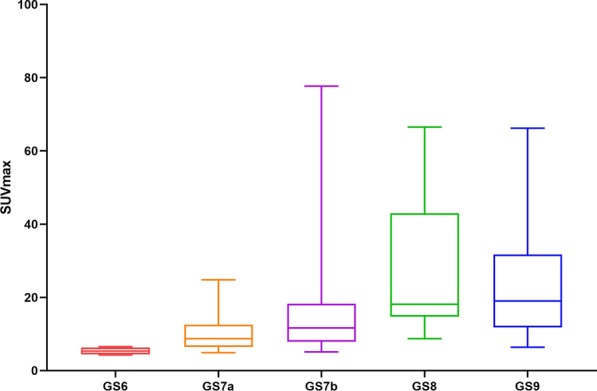
Comparison of 18F-PSMA-1007 uptake expressed in SUVmax value in primary tumors of different GS subgroups. Box plots demonstrate that higher GS exhibited statistically significant higher tracer uptake in the primary tumor
ROC curve analysis
Figure 5 showed the result of the ROC curve analysis for high-risk PCa. The AUC of the SUVmax was 0.829. The sensitivity, specificity, positive predicted value and negative predicted value were 90.4%, 65.3%, 73.4% and 91.4%, respectively. The optimal cutoff values of SUVmax was set as 9.05.
Fig. 5.
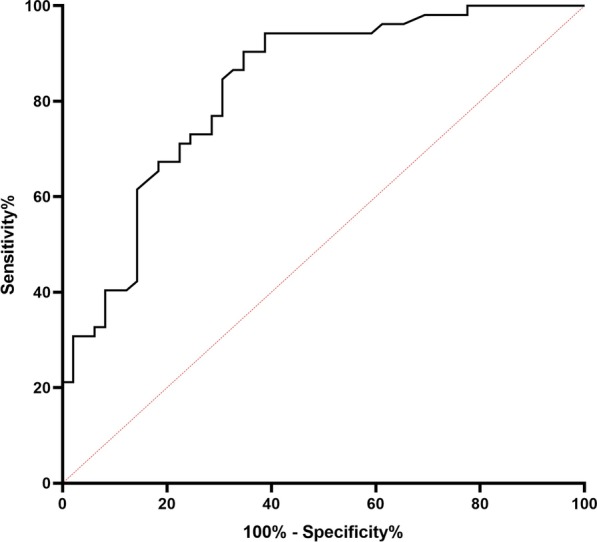
ROC curve of the SUVmax for high-risk prostate cancers. 95% confidence interval [CI], 0.749–0.909; sensitivity: 90.4%; specificity: 65.3%
Discussion
In this retrospective study, we found that there was a certain positive correlation between the intensity of 18F-PSMA-1007 accumulation and the GS/PSA level in the primary tumors of PCa patients. Furthermore, the SUVmax of the primary tumor was valuable for identifying high-risk PCa.
A timely and accurate diagnosis of high-risk PCa is front and center for the clinician. The commonly used risk classifications for the PCa are based on clinical stage, Gleason score by biopsy and PSA level before treatment. However, it is not absolutely reliable to evaluate the accuracy of GS in patients who have undergone 12-core random, transrectal ultrasound-guided (TRUS) biopsy. In the clinical work, it may also encounter the patients who refuse biopsy for a variety of reasons. Another problem with the scheme is the inherent inaccuracy in determining T stage [2]. Assessing disease by digital rectal examination has significant inter-observer variability. PSMA-PET/CT, as a noninvasive imaging diagnostic strategy, may compensate for these shortcomings. Recent studies found a statistically significant positive correlation between GS/PSA value and SUVmax of primary tumors on PSMA-PET/CT [13, 23]. Kesch et al. proved 18F-PSMA-1007 PET/CT and multiparametric magnetic resonance imaging had similar diagnostic performance in local staging of PCa [15]. In our study, the SUVmax showed a significant association with the presence of high-risk PCa. Patients of HR had significantly higher SUVmax than those of IR (P < 0.001). The AUC of the SUVmax of the primary tumor was 0.829, which can efficaciously identify non-metastatic high-risk patients with PCa. Therefore, we believe pathologists and clinicians may reduce missed diagnoses if they refer to PET images and results. Apart from that, PSMA-PET/CT may better screen out the patients of high risk, especially when the patients are unable to receive aspiration biopsy or the histology results of biopsy are not satisfactory.
The biological characteristics of PCa tissues vary greatly between different GS, which is an important indicator for the treatment and prognosis evaluation of PCa [18]. Thus, we also made the pairwise comparison between different GS subgroups and found that there were statistically significant differences in SUVmax between the subgroups of GS 6/7a and the subgroups of GS 8/9 (P < 0.01). There were no statistical differences in SUVmax value between tumors with 7b and those with GS 8/9, which was different from the result of previous studies on 68Ga-PSMA [23, 24]. Reasons for these discrepancies remain speculative. The patients of GS 8/9 account for a small proportion of all patients, which might be one of the reasons. Previous study had shown that compared with the subgroup GS 7b, the dangerous level of the subgroup GS 7a tumors could be treated conservatively without the need for a radical surgery [25]; thus, the distinguishment between the two subgroups was of great importance for clinical treatment. But it is worth noting that the SUVmax of primary tumor between these two subgroups has no statistical difference with a median SUVmax of 8.7 (GS 7a) and 11.6 (GS 7b), (P > 0.05). This finding was consistent with previous studies on 68Ga-PSMA [23, 24], which may reveal that the stage difference between GS 7a and GS 7b was not enough to cause a difference in SUVmax on PSMA-PET/CT.
The present study has some limitations that should not be neglected. Firstly, the retrospective nature of the analysis is the major limitation of our study, and further validation is required by multicenter studies with more patients. Secondly, the data of patients with GS 10 are lack in this study. Hence, the transferability of our data has yet to be assessed. Finally, we only focused on intra-prostatic 18F-PSMA-1007 uptake. The further researches about metastatic lesions or the impact of 18F-PSMA 1007 on the choice of treatment will be conducted in the further.
Conclusion
In conclusion, 18F-PSMA-1007 was a great potential tracer for PCa PET/CT imaging. The intensity of tumor-related tracer uptake on 18F-PSMA-1007 PET/CT correlates with the PSA level and GS in primary PCa. Furthermore, 18F-PSMA-1007 PET/CT showed powerful diagnostic performance for risk stratification of primary PCa, which can be used as a reference index for identifying high-risk PCa.
Acknowledgements
Not applicable.
Abbreviations
- PCa
Prostate cancer
- EAU
European Association of Urology
- PSA
Prostate specific antigen
- GS
Gleason score
- PSMA
Prostate specific membrane antigen
- IR
Intermediate-risk
- HR
High-risk
- SUVmax
The maximum standardized uptake values
- PET-CT
Positron emission tomography/computed tomography
- TRUS
Transrectal ultrasound
- RP
Radical prostatectomy
- ROC
Receiver operating characteristic
- AUC
Area under the curve
Authors’ contributions
JH was involved in data acquisition, literature research and manuscript writing. BL, XJ, WY and JL helped in data acquisition and review. KT contributed to study design and theoretical support. XZ and ZW were involved in design of the research program, review and revise of manuscript. All the authors agreed on the content of the final manuscript. All authors read and approved the final manuscript.
Funding
No funding was obtained for the present study.
Ethics approval and consent to participate
All procedures performed in studies involving human participants were in accordance with the ethical standards of the institutional and/or national research committee and with the 1964 Declaration of Helsinki and its later amendments or comparable ethical standards. Due to the retrospective nature of the study, no formal approval from the ethics committee was required according to our national legislation.
Consent for publication
Not applicable.
Availability of data and materials
The datasets used and/or analyzed during the current study are available from the corresponding author on reasonable request.
Competing interests
All authors declare that they have no competing interests.
Footnotes
Publisher's Note
Springer Nature remains neutral with regard to jurisdictional claims in published maps and institutional affiliations.
Jun-jie Hong and Bo-le Liu have contributed equally to this work
References
- 1.Siegel RL, Miller KD, Jemal A. Cancer statistics, 2019. CA Cancer J Clin. 2019;69:7–34. doi: 10.3322/caac.21551. [DOI] [PubMed] [Google Scholar]
- 2.Chang AJ, Autio KA, Roach M, 3rd, Scher HI. High-risk prostate cancer-classification and therapy. Nat Rev Clin Oncol. 2014;11:308–323. doi: 10.1038/nrclinonc.2014.68. [DOI] [PMC free article] [PubMed] [Google Scholar]
- 3.Kasperzyk JL, Finn SP, Flavin R, Fiorentino M, Lis R, Hendrickson WK, et al. Prostate-specific membrane antigen protein expression in tumor tissue and risk of lethal prostate cancer. Cancer Epidemiol Biomark Prev. 2013;22:2354–2363. doi: 10.1158/1055-9965.EPI-13-0668. [DOI] [PMC free article] [PubMed] [Google Scholar]
- 4.Afshar-Oromieh A, Avtzi E, Giesel FL, Holland-Letz T, Linhart HG, Eder M, et al. The diagnostic value of PET/CT imaging with the (68)Ga-labelled PSMA ligand HBED-CC in the diagnosis of recurrent prostate cancer. Eur J Nucl Med Mol Imaging. 2015;42:197–209. doi: 10.1007/s00259-014-2949-6. [DOI] [PMC free article] [PubMed] [Google Scholar]
- 5.Rahbar K, Weckesser M, Huss S, Semjonow A, Breyholz HJ, Schrader AJ, et al. Correlation of intraprostatic tumor extent with 68Ga-PSMA distribution in patients with prostate cancer. J Nucl Med. 2016;57:563–567. doi: 10.2967/jnumed.115.169243. [DOI] [PubMed] [Google Scholar]
- 6.Giesel FL, Will L, Lawal I, Lengana T, Kratochwil C, Vorster M, et al. Intraindividual comparison of (18)F-PSMA-1007 and (18)F-DCFPyL PET/CT in the prospective evaluation of patients with newly diagnosed prostate carcinoma: a pilot study. J Nucl Med. 2018;59:1076–1080. doi: 10.2967/jnumed.117.204669. [DOI] [PubMed] [Google Scholar]
- 7.Rahman LA, Rutagengwa D, Lin P, Lin M, Yap J, Lai K, et al. High negative predictive value of 68Ga PSMA PET-CT for local lymph node metastases in high risk primary prostate cancer with histopathological correlation. Cancer Imaging. 2019;19:86. doi: 10.1186/s40644-019-0273-x. [DOI] [PMC free article] [PubMed] [Google Scholar]
- 8.Bravaccini S, Puccetti M, Bocchini M, Ravaioli S, Celli M, Scarpi E, et al. PSMA expression: a potential ally for the pathologist in prostate cancer diagnosis. Sci Rep. 2018;8:4254. doi: 10.1038/s41598-018-22594-1. [DOI] [PMC free article] [PubMed] [Google Scholar]
- 9.Fendler WP, Eiber M, Beheshti M, Bomanji J, Ceci F, Cho S, et al. (68)Ga-PSMA PET/CT: joint EANM and SNMMI procedure guideline for prostate cancer imaging: version 1.0. Eur J Nucl Med Mol Imaging. 2017;44:1014–1024. doi: 10.1007/s00259-017-3670-z. [DOI] [PubMed] [Google Scholar]
- 10.Ross JS, Sheehan CE, Fisher HA, Kaufman RP, Jr, Kaur P, Gray K, et al. Correlation of primary tumor prostate-specific membrane antigen expression with disease recurrence in prostate cancer. Clin Cancer Res. 2003;9:6357–6362. [PubMed] [Google Scholar]
- 11.Maurer T, Gschwend JE, Rauscher I, Souvatzoglou M, Haller B, Weirich G, et al. Diagnostic efficacy of (68)gallium-PSMA positron emission tomography compared to conventional imaging for lymph node staging of 130 consecutive patients with intermediate to high risk prostate cancer. J Urol. 2016;195:1436–1443. doi: 10.1016/j.juro.2015.12.025. [DOI] [PubMed] [Google Scholar]
- 12.Afshar-Oromieh A, Malcher A, Eder M, Eisenhut M, Linhart HG, Hadaschik BA, et al. PET imaging with a [68Ga]gallium-labelled PSMA ligand for the diagnosis of prostate cancer: biodistribution in humans and first evaluation of tumour lesions. Eur J Nucl Med Mol Imaging. 2013;40:486–495. doi: 10.1007/s00259-012-2298-2. [DOI] [PubMed] [Google Scholar]
- 13.Giesel FL, Hadaschik B, Cardinale J, Radtke J, Vinsensia M, Lehnert W, et al. F-18 labelled PSMA-1007: biodistribution, radiation dosimetry and histopathological validation of tumor lesions in prostate cancer patients. Eur J Nucl Med Mol Imaging. 2017;44:678–688. doi: 10.1007/s00259-016-3573-4. [DOI] [PMC free article] [PubMed] [Google Scholar]
- 14.Rahbar K, Weckesser M, Ahmadzadehfar H, Schafers M, Stegger L, Bogemann M. Advantage of (18)F-PSMA-1007 over (68)Ga-PSMA-11 PET imaging for differentiation of local recurrence vs. urinary tracer excretion. Eur J Nucl Med Mol Imaging. 2018;45:1076–1077. doi: 10.1007/s00259-018-3952-0. [DOI] [PubMed] [Google Scholar]
- 15.Kesch C, Vinsensia M, Radtke JP, Schlemmer HP, Heller M, Ellert E, et al. Intraindividual comparison of (18)F-PSMA-1007 PET/CT, multiparametric MRI, and radical prostatectomy specimens in patients with primary prostate cancer: a retrospective, proof-of-concept study. J Nucl Med. 2017;58:1805–1810. doi: 10.2967/jnumed.116.189233. [DOI] [PubMed] [Google Scholar]
- 16.Giesel FL, Knorr K, Spohn F, Will L, Maurer T, Flechsig P, et al. Detection efficacy of (18)F-PSMA-1007 PET/CT in 251 patients with biochemical recurrence of prostate cancer after radical prostatectomy. J Nucl Med. 2019;60:362–368. doi: 10.2967/jnumed.118.212233. [DOI] [PMC free article] [PubMed] [Google Scholar]
- 17.Giesel FL, Kesch C, Yun M, Cardinale J, Haberkorn U, Kopka K, et al. 18F-PSMA-1007 PET/CT detects micrometastases in a patient with biochemically recurrent prostate cancer. Clin Genitourin Cancer. 2017;15:e497–e499. doi: 10.1016/j.clgc.2016.12.029. [DOI] [PubMed] [Google Scholar]
- 18.Cornford P, Bergh RCN, Briers E, Santis M, Fanti S, Gillessen S, et al. EAU-EANM-ESTRO-ESUR-SIOG guidelines on prostate cancer 2020 published guidelines. 2020.
- 19.Cardinale J, Martin R, Remde Y, Schafer M, Hienzsch A, Hubner S, et al. Procedures for the GMP-compliant production and quality control of [(18)F]PSMA-1007: a next generation radiofluorinated tracer for the detection of prostate cancer. Pharmaceuticals (Basel) 2017 doi: 10.3390/ph10040077. [DOI] [PMC free article] [PubMed] [Google Scholar]
- 20.Backhaus P, Noto B, Avramovic N, Grubert LS, Huss S, Bogemann M, et al. Targeting PSMA by radioligands in non-prostate disease-current status and future perspectives. Eur J Nucl Med Mol Imaging. 2018;45:860–877. doi: 10.1007/s00259-017-3922-y. [DOI] [PubMed] [Google Scholar]
- 21.Ceci F, Uprimny C, Nilica B, Geraldo L, Kendler D, Kroiss A, et al. (68)Ga-PSMA PET/CT for restaging recurrent prostate cancer: which factors are associated with PET/CT detection rate? Eur J Nucl Med Mol Imaging. 2015;42:1284–1294. doi: 10.1007/s00259-015-3078-6. [DOI] [PubMed] [Google Scholar]
- 22.Sachpekidis C, Kopka K, Eder M, Hadaschik BA, Freitag MT, Pan L, et al. 68Ga-PSMA-11 dynamic PET/CT imaging in primary prostate cancer. Clin Nucl Med. 2016;41:e473–e479. doi: 10.1097/RLU.0000000000001349. [DOI] [PubMed] [Google Scholar]
- 23.Ergul N, Yilmaz Gunes B, Yucetas U, Toktas MG, Cermik TF. 68Ga-PSMA-11 PET/CT in newly diagnosed prostate adenocarcinoma. Clin Nucl Med. 2018;43:e422–e427. doi: 10.1097/RLU.0000000000002289. [DOI] [PubMed] [Google Scholar]
- 24.Uprimny C, Kroiss AS, Decristoforo C, Fritz J, von Guggenberg E, Kendler D, et al. (68)Ga-PSMA-11 PET/CT in primary staging of prostate cancer: PSA and Gleason score predict the intensity of tracer accumulation in the primary tumour. Eur J Nucl Med Mol Imaging. 2017;44:941–949. doi: 10.1007/s00259-017-3631-6. [DOI] [PubMed] [Google Scholar]
- 25.Epstein JI, Zelefsky MJ, Sjoberg DD, Nelson JB, Egevad L, Magi-Galluzzi C, et al. A contemporary prostate cancer grading system: a validated alternative to the Gleason Score. Eur Urol. 2016;69:428–435. doi: 10.1016/j.eururo.2015.06.046. [DOI] [PMC free article] [PubMed] [Google Scholar]
Associated Data
This section collects any data citations, data availability statements, or supplementary materials included in this article.
Data Availability Statement
The datasets used and/or analyzed during the current study are available from the corresponding author on reasonable request.


