

Abstract
A recurrent de novo mutation in the transcriptional corepressor CTBP1 is associated with neurodevelopmental disabilities in children (Beck et al., 2016, 2019; Sommerville et al., 2017). All reported patients harbor a single recurrent de novo heterozygous missense mutation (p.R342W) within the cofactor recruitment domain of CtBP1. To investigate the transcriptional activity of the pathogenic CTBP1 mutant allele in physiologically relevant human cell models, we generated induced pluripotent stem cells (iPSC) from the dermal fibroblasts derived from patients and normal donors. The transcriptional profiles of the iPSC-derived “early” neurons were determined by RNA-sequencing. Comparison of the RNA-seq data of the neurons from patients and normal donors revealed down regulation of gene networks involved in neurodevelopment, synaptic adhesion and anti-viral (interferon) response. Consistent with the altered gene expression patterns, the patient-derived neurons exhibited morphological and electrophysiological abnormalities, and susceptibility to viral infection. Taken together, our studies using iPSC-derived neuron models provide novel insights into the pathological activities of the CTBP1 p.R342W allele.
Keywords: transcriptional repression, CtBP, de novo mutation, interferon response, intellectual and developmental disabilities, transcriptome analysis
Introduction
The C-terminal Binding Protein (CtBP) family consists of two highly related paralogs, CtBP1 and CtBP2 (and their splice forms) in vertebrates (Chinnadurai, 2007). The nuclear isoforms of CtBP1 (CtBP1-L, NM_001328.2) and CtBP2 (CtBP2-L, NM_022802.2) function as transcriptional corepressors (reviewed in Chinnadurai, 2007). CtBPs mediate transcriptional repression by targeting various chromatin-modifying enzymes to the promoter regions and by interacting with DNA-bound repressors. CtBPs bind with the chromatin modifying factors and various repressors through a high-affinity protein-binding interface known as PXDLS-binding cleft. In addition, an auxiliary protein-binding interface termed RRT-binding groove in CtBPs is involved in interaction with certain Zinc-finger-containing transcription factors. The CtBP1 corepressor complex mediates coordinated histone modifications by deacetylation and methylation of histone H3K9 and demethylation of histone H3K4 (Shi et al., 2003). CtBPs also activate transcription under certain specific contexts (Fang et al., 2006; Paliwal et al., 2012; Bajpe et al., 2013; Itoh et al., 2013; Ray et al., 2014). Since CtBPs are NAD(H)-binding proteins (Kumar et al., 2002; Nardini et al., 2003), the intracellular levels of NAD(H) dinucleotides differentially regulate their transcriptional activity through oligomerization (Zhang et al., 2002).
Studies on mice with disruptions in the ctbp genes, showed that ctbp1 and ctbp2 play overlapping and unique transcriptional roles during development (Hildebrand and Soriano, 2002). While homozygous deletion of the ctbp2 gene was embryonic lethal affecting brain and heart development, homozygous deletion of ctbp1 resulted in viable mice with reduced size and lifespan. In humans, overexpression of CTBP1 and CTBP2 was reported in a number of epithelial cancers and was associated with transcriptional activity that leads to epithelial to mesenchymal transformation (reviewed by Chinnadurai, 2002; Byun and Gardner, 2013; Dcona et al., 2017). A role of CTBP1 in human neurodevelopment was revealed with the discovery of a recurrent de novo missense mutation in CTBP1 (c.991C → T, p.R331W in NM_001012614.1; p.R342W c.1024 C → T in NM_001328.2) in patients with neurodevelopmental features including intellectual disability, ataxia, hypotonia, as well as tooth enamel defects (Beck et al., 2016, 2019; Sommerville et al., 2017). The neurodevelopmental phenotypes conferred by the CTBP1 mutant allele provide genetic evidence that CTBP1 is important for normal human brain development. Previous biochemical studies also suggested that CtBPs might be important for certain brain developmental functions (Sahu et al., 2017; Shen et al., 2017). CtBP1 has been reported to mediate transcriptional repression of a number of neuronal genes involved in synaptic activities of the inner ear hair cells, the retina (Ivanova et al., 2015) and the synaptic ribbon complex (Tom Dieck et al., 2005).
The mechanism by which the pathogenic CTBP1 mutant allele contributes to neurodevelopmental disease is not known. The mutation (referred here as p.R342W) maps within an α-helical region (α-5) of CtBP1 that forms a part of the PXDLS-protein interaction cleft. In a glioblastoma cell line with exogenously expressed CTBP1 p.R342W, the interactions of various CtBP-cofactors were reduced with the mutant protein (Beck et al., 2019). In order to determine the altered transcriptional profiles in patient-derived cell models, we generated iPSCs from dermal fibroblasts, differentiated them into early stage neurons, and determined their transcriptional profiles by RNA-seq. The morphological and physiological changes inferred from the altered gene expression profiles of patient-derived cells were also determined. Here, we report that genes involved in neurodevelopment, adhesion and antiviral-response pathways are downregulated in CTBP1 heterozygous p.R342W neurons. Consistent with the transcriptome data, patient-derived heterozygous p.R342W neurons also showed morphological and physiological abnormalities and susceptibility to neurotropic viral pathogenesis.
Results
Neuronal Cell Models
Since the CTBP1 p.R342W mutation is associated with neurodevelopmental disabilities, we designed experiments to compare the transcriptional profiles of patient and healthy control derived neuronal cell models. We generated iPSCs from the dermal fibroblasts of two patients with the CTBP1 p.R342W heterozygous mutation and two age-matched normal donors using Sendai virus delivery of the Yamanaka factors (Klf-4, Sox-2, Oct3/4, and c-Myc) (Ban et al., 2011; Nayler et al., 2017). We further differentiated the iPSC (Supplementary Figure 1A) into neural stem cells (NSC) (Supplementary Figure 1B) and early (14-days of differentiation) neurons (Figure 1) using neural differentiation media. These neurons were used for transcriptional profiling and morphological and electrophysiological comparisons.
FIGURE 1.

Morphology of iPSC/NSC-derived neurons. Neurite networks of healthy donor control (Ct1 and Ct2) and patient (Pt1 and Pt2) neurons were revealed by phase contrast imaging (A) and immunofluorescence imaging of cells stained with antibodies to cytoskeletal proteins beta-3-Tubulin (B) and MAP2 (C). The length (D), number (E) and thickness (F) of neurites were measured from phase contrast images and quantified. There were no significant differences in either the number or the length of neurites between control or patient-cells. Specifically, the average neurite length (D) of different cells was: Ct1, 93.2 ± 8.4 μm; Ct2, 94.6 ± 11.6 μm; Pt1, 96.1 ± 10.1 μm; and Pt2, 86.2 ± 7.0 μm (p = 0.882; n = 5). The average number (E) of neurites per image was: Ct1, 225.8 ± 46.4; Ct 2, 247.2 ± 54.6: Pt1, 236.0 ± 42.4; and Pt2, 225.4 ± 39.8 (p = 0.985; n = 5). The average neurite thickness (F) in Ct1 was 5.4 ± 0.3 μm, Ct2 was 5.8 ± 0.2 μm, Pt1 was 4.5 ± 0.2 μm, and Pt2 was 4.3 ± 0.2 μm (p = 0.03 for Ct1 vs Pt1; p = 0.00045 for Ct2 vs Pt1; p = 0.005 for Ct1 vs Pt2; p = 0.00004 for Ct2 vs Pt2; n = 10 primary neurites measured in 5 phase contrast images for all conditions, totaling 50 neurites measured per condition). * Indicates a significance level of p < 0.05, **p < 0.01, ***p < 0.001, and ****p < 0.0001. (G) Number of DAPI-Positive Cells Bar Graph. DAPI staining of nuclei revealed fewer patient neurons adhered to the culture dish. Number of DAPI-positive cells in Ct1 was 49.2 ± 14.4, in Ct2 was 73.4 ± 19.5, in Pt1 was 19.5 ± 4.5, and in Pt2 was 22.3 ± 14.3 (p = 0.0507; n = 6, 6, 5, and 3 fluorescent images analyzed for Ct1, Pt1, Ct2, and Pt2, respectively). Scale bar is 25 μm.
The phase contrast images of iPSC/NSC-derived neurons of normal donors and patients revealed typical neuronal morphology, exhibiting ability to grow and extend robust neurites and form inter- connections (Figure 1). To quantify the differences in neurite length and number, phase contrast images were measured using the ImageJ software, NeuronJ (Meijering et al., 2004; Pemberton et al., 2018). While there were no significant differences between patient and control cells in these outgrowth parameters (Figures 1D,E), analysis of neurite thickness demonstrated a significantly decreased primary neurite thickness in patient cells compared to control cells (Figure 1A, arrows; Figure 1F). The neurons were also analyzed by immunocytochemistry labeling of the cytoskeletal markers beta-3 Tubulin (green) (Figure 1B) and Microtubule-Associated Protein 2 (MAP2, red) (Figure 1C). This analysis confirmed robust and extensive internetworks formed by both control- and patient-derived neurons. We also quantified the staining of nuclei with DAPI (blue). Compared to controls, patient cultures had, in general, fewer DAPI-positive cells (Figure 1G). Together, these results indicated that neurons derived from CTBP1-mutated stem cells survived less in culture. Although they were able to form and extend neurites, like control neurons, the neurites of patient neurons were significantly thinner.
Transcriptomic Profiling of iPSC/NSC-Derived Neurons
To determine the transcriptional profiles altered by the CTBP1 mutant allele (p.R342W) in patient-derived cell models, we prepared RNA from the neurons (14-days after differentiation) generated from two different patient-derived NSC and two healthy donor NSC lines. The cDNA generated from RNA derived from the early neurons were sequenced on an Illumina HiSeq 3000 with single-end 50 base pair reads. The sequence reads were aligned with STAR (Dobin et al., 2013), and were quantitated with Subread (Liao et al., 2014). The gene counts were analyzed using established methods for quantifying gene expression: the R/Bioconductor package Limma (Ritchie et al., 2015) and SVA (Leek et al., 2012). Our analysis revealed that out of 15,942 gene transcripts robustly expressed at greater than 1 count-per-million in at least 5 samples, 7,141 were differentially expressed between patient and control neurons (FDR ≤ 0.05). Among these transcripts, 6,500 genes were protein-coding. As depicted in the volcano plot, among the differentially expressed protein-coding transcripts, 161 were down-regulated and 36 were up-regulated by 3-fold or more in patient-derived neurons (Figure 2A). All genes were then tested for perturbations in gene ontology (GO) biological processes (Figure 2B).
FIGURE 2.

(A) Volcano Plot: Volcano plot of 15,942 gene transcripts with log 2 fold changes observed by Limma. 7,141 were differentially expressed between patient and control neurons (FDR ≤ 0.05). Among these transcripts, 6,500 genes were protein-coding. Out of these, 161 were down-regulated (Blue) and 36 were up-regulated (Red) by 3-fold or more. (B) Global GO Biological Process Perturbation Bar Plot: All 15,942 transcripts were interrogated by Gage for level perturbations across all known GO biological process gene sets. The significance and mean log 2 fold change of each term was evaluated by t-tests. (C) Module and Trait Eigengene Correlation and Significance Matrix: Matrix of de novo color coded modules found by WGCNA and their respective eigengene Pearson correlation (top value in each cell) and p-values (bottom value in each cell) for the mutation and statistical covariates. Bright red modules are high positively correlated and bright deep blue are high negatively correlated transcripts. Modules with absolute value Pearson correlations greater than 75% to the mutant samples (pink, white, and darkturquoise) were considered the best candidates for further investigation.
The differentially expressed genes were then subjected to Weighted Gene Correlation Network Analysis (WGCNA) (Langfelder and Horvath, 2008). A matrix of de novo color-coded modules found by WGCNA and correlated with the mutation are shown in Figure 2C. The modules with high correlations (Pearson correlations >75%) to CTBP1 p.R342W mutant cells were selected for further analysis; darkturquoise (Figure 3), pink (Supplementary Figure 2) and white (Supplementary Figure 3). The correlation of the eigengenes for every cluster revealed a highly negative correlated module labeled in darkturquoise containing 102 transcripts and highly positively correlated modules labeled in pink (451 transcripts) and white (78 transcripts). GO enrichment analysis of the darkturquoise module revealed highly significant down regulation of genes involved in neuronal development/functions, synaptic cell adhesion, and type 1 interferon signaling and response (Figures 3A,B). A heat-map of these highly correlated genes confirmed that the genes associated with these biological processes were down-regulated across all CTBP1 mutant samples (Figure 3C). The genes that were significantly up-regulated in patient cells in the pink cluster (Supplementary Figures 2A–C) appear to be involved in diverse biological processes such as protein synthesis and protein targeting/localization, RNA catabolic process and apoptosis signaling. The white module of up-regulated genes in CTBP1 mutant cells were significantly enriched for metabolic processes, transcriptional initiation and translation as shown in Supplementary Figures 3A–C.
FIGURE 3.
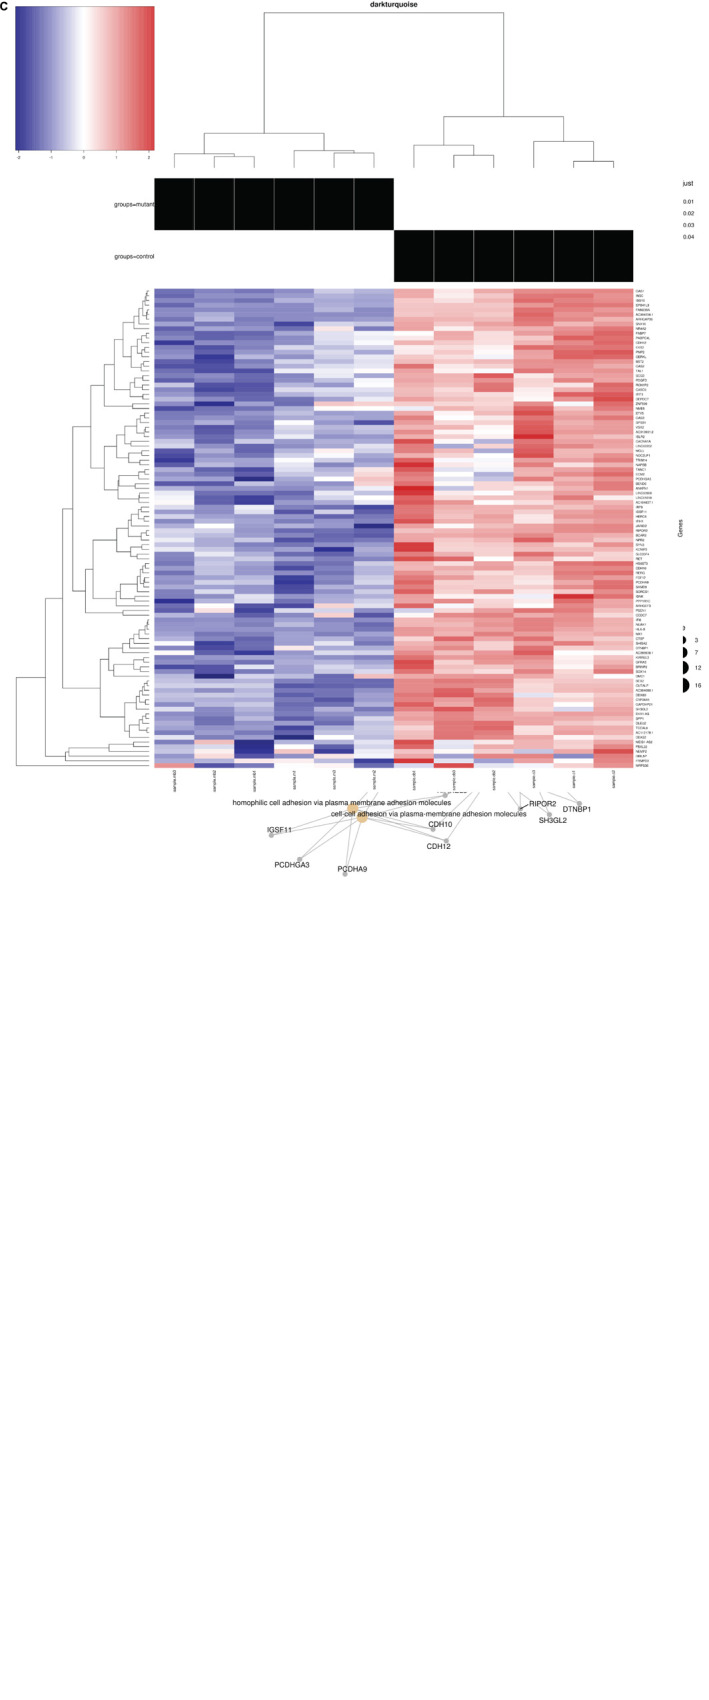
GO network plot for down-regulated genes and heat maps: (A) Darkturquoise GO Biological Process Enrichment Bar Plot. All 102 negatively correlated WGCNA de novo clustered darkturquoise genes were tested for enrichment across known GO biological processes with the R/Bioconductor package clusterProfiler. The color illustrates the significance of the enrichment and the size of each bar characterizes the number of genes for each enriched term. The down regulation and negative correlation of darkturquoise module genes alludes to the down regulation represented by each significant term. (B) GO Category Network Plot: The negatively correlated genes clustered into a WGCNA de novo network labeled as darkturquoise were tested for enrichment across known GO biological processes with the R/Bioconductor package clusterProfiler. Significant terms with overlapping genes are clustered together while the overlapping genes represented in the darkturquoise network module illustrate the connections between those terms. (C) Heat map: Heat map representing 102 genes in the darkturquoise WGCNA module whose z-scores illustrate their down regulation and high negative correlation across all mutant samples.
Considering the neuronal developmental phenotypes, including intellectual disability exhibited by patients with the CTBP1 p.R342W mutation and adherence phenotypes of the mutant cells observed while differentiating NSC to neurons (not shown), we pursued RNA sequencing and observed the suppression of genes involved in neuronal development and cell adhesion (Figure 4A and Supplementary Table 1). We then focused on the genes of down-regulated biological processes for validation by RT-qPCR analysis (Figure 4). The down-regulated transcriptional pattern was prominent in the transcriptome data analysis and the expression patterns of a number of transcripts were readily validated by RT-qPCR analysis. Further, the known functions of several down-regulated genes appeared to be relevant to the patient phenotypes (see Supplementary Table 2). In contrast to the down-regulated transcripts, up-regulated transcripts were diverse (see below). The down-regulated genes included those involved in neuronal development and cell adhesion (Figure 4A and Supplementary Table 1). In agreement with the RNA-seq data sets, RT-qPCR analysis revealed that several genes involved in type I interferon-response were also repressed in patient neurons (Figure 4B and Supplementary Table 1). In contrast to the negatively correlated and down-regulated genes in darkturquoise, the more variable heatmaps and lower statistical significance of genes in the positively correlated up-regulated pink and white clusters were diverse. Query with RT-qPCR analysis of several up-regulated genes suggested that these clusters did not merit further pursuit (data not shown). However, the possibility of up-regulation of isolated genes (none identified here) cannot be ruled out.
FIGURE 4.

RT-qPCR validation. The experiment was carried out in triplicate and the relative quantification (RQ) values are plotted and the data analysis done in Thermo Fisher ConnectTM (Cloud) https://www.thermofisher.com/us/en/home/digital-science.html. Endogenous and reference control used in the experiment is Actin and control (Ct1), respectively. (A) Relative quantification of genes involved in neuronal development and cell adhesion. (B) Relative quantification of genes involved in Interferon responses.
Physiological and Biological Activities of CTBP1 p.R342W-Mutated Neurons
Calcium transients: The above transcriptome analysis revealed down-regulation of neurodevelopmental and interferon response genes, we carried out additional assays to examine whether CTBP1 p.R342W mutation affects factors such as cytosolic calcium (Ca2+) levels and plasma membrane ion currents that are involved in normal neuronal functions. It is well known that brief and repetitive elevations of intracellular calcium levels (spontaneous calcium transients) are important in regulating various neural developmental processes, including neural survival, differentiation, neurite outgrowth, synaptic transmission and plasticity (Spitzer et al., 1994; Spitzer, 2006; Rosenberg and Spitzer, 2011). To assess the effect of CTBP1 p.R342W on calcium transients, we performed fluorescent calcium imaging experiments on control donor and patient neurons. Our results revealed that neurons derived from patients exhibited differences in the frequency and/or amplitude of Ca2+ transients as compared to control neurons (Figure 5). Specifically, both control neurons (Ct1 and Ct2) exhibited regular compound patterns of calcium oscillations, and showed regular spiking activity with the ability to return to the baseline between spikes (indicated by blue arrows in Figure 5, left two panels). Interestingly, the patient neurons (Pt1 and Pt2) showed either more sustained elevation of intracellular Ca2+ with significantly reduced amplitude (p < 0.05, Figure 5) or more frequent, irregular patterns of Ca2+ transients with the calcium levels rarely returning to baseline (indicated by blue arrows in Figure 5, right two panels). These results indicate that CTBP1 p.R342W impacts internal Ca2+ oscillations, either affecting their amplitudes or spiking patterns leading to dysregulation of Ca2+ homeostasis in patient neurons. We note that in spite of the inter-patient variations between the two patient-derived cell lines (Pt1 and Pt2), they both exhibited consistent irregular Ca2+ transients. It is possible that the effect of CTBP1-mutation might be additionally influenced by other stochastic intra-patient environments.
FIGURE 5.

(A) Calcium imaging data. Top panels show raw traces of spontaneous calcium transients recorded from neurons of control donors and patients. Bottom bar graphs are quantitative data of the mean peak amplitudes and spiking frequency of calcium transients. Our data show that neurons from patients (Pt1 and Pt2) exhibited significant changes in either the amplitude or the frequency of calcium transients with the inability to return to basal levels compared to their matched donor controls (Ct1 and Ct2). Arrows indicate basal levels between calcium transcients. (B) Adhesion activity of neurons. Control (Ct1 and Ct2) and patient-derived (Pt1 and Pt2) neurons (6-days after differentiation from NSC) were plated onto Geltrex coated 8-well glass slide Chamber and incubated at 37°C for 30 min, the dishes were flipped to remove non-adherent cells. The adherent neurons were stained with an antibody specific to MAP2 and DAPI and MAP2-expressing cells were counted. Percentage of adherent (flipped) cells was calculated based on un-flipped cells. Patient-derived cells exhibited statistically less adhesion than control cells Ct1 and Ct2: Pt1 (p < 0.05) and Pt2 (<0.01). n = 3.
Because spontaneous Ca2+ transients are normally driven by active firing of neuronal action potentials mediated by the functional expression of inward sodium (Na+) and outward potassium (K+) currents, we next examined whether the CTBP1 p.R342W mutation alters these currents in neurons. We specifically focused on the impact of CTBP1 p.R342W on the voltage-gated Na+ currents, which are essential for the ability of neurons to generate action potentials. Our whole cell patch clamping data (Supplementary Figure 4) showed that neurons from control donors exhibited normal expression of Na+ currents. However, the neurons derived from one patient (Pt1) expressed little or no Na+ currents in all neurons examined and the neurons derived from the second patient (Pt2) exhibited either smaller or much larger Na+ currents (Supplementary Figure 4). As in the case Ca2+ transient measurements, both Pt1 and Pt2 cells showed inter-patient variations in Na+ current measurements. Taken together, our data suggest that the CTBP1 p.R342W mutation may affect the normal neuronal functions such as intracellular Ca2+ homeostasis and membrane excitability, two fundamental factors that mediate neuronal communications in the nervous system.
Adhesion activities: While performing routine cell culture procedures, we observed that CTBP1-mutated cells exhibited increased ability to become detached from the culture surface as individual cells when treated with cell detachment agents. Our transcriptome analysis revealed down-regulation of several adhesion molecules involved in cell-cell and synaptic adhesion (Figure 3B and Supplementary Table 2). To experimentally determine whether the CTBP1 p.R342W neurons exhibit less adhesion activities, we carried out a “flipping” assay (Langhe et al., 2016). The control and patient cells were plated onto Geltrex coated chamber slides and incubated. After short culture time, the adherent and non-adherent cells were determined by flipping one set of plates. The cells in both flipped and un-flipped plates were fixed and stained with DAPI and MAP2-antibody. The percentage of adhered (flipped) cells was calculated based on un-flipped cells. We found that the percent of adherent cells were statistically lower in patient-derived neurons. As shown in Figure 5B, the patient-derived neurons exhibited significantly less adhesion than controls (Pt1-p < 0.05; Pt2-p < 0.01). As cadherins function in cell-cell contacts, reduced adherence of patient neurons suggest that the expression of these molecules may be affected. This in vitro result correlates with our transcriptome analysis where several cadherins (CDH10, CDH12 and KRREL3) are down-regulated (Supplementary Table 2).
Response to neurotropic virus infection: Our transcriptome analysis revealed prominent down regulation of homeostatic levels of interferon-stimulated genes. West Nile Virus infection is known to directly infect neurons both in mice (Shrestha et al., 2003) and in humans (Diamond et al., 2009) and can cause neuronal injury by direct cytopathic effect. Multiple studies have demonstrated that WNV is highly susceptible to antiviral interferon stimulated genes (ISG), which can act to reduce viral titer and alter cell susceptibility (Jiang et al., 2010). Therefore, we hypothesized that CTBP1 p.R342W neuronal cells would be more susceptible to WNV replication as compared to healthy control neurons. To test this, we performed a single step growth curve using WNV on both patient and healthy control-derived neurons (Figure 6). We noted that there was a higher level of WNV replication in the patient-derived CTBP1 p.R342W neuronal cells as compared to healthy control neurons from 4 h post infection until the end of the assay. These results were statistically significant at 20 h post infection (p ≤ 0.01). We interpret these results to mean that the CTBP1 p.R342W neurons might be more susceptible to WNV infection as the virus replicated to higher titers in mutant neurons compared to control neurons for most of the time points tested (about 100-fold at 20 h after infection). These results are consistent with the levels of expression of various anti-viral response genes in the patient neurons.
FIGURE 6.

Single step growth curves for WNV replication in neurons: The single step growth curves were generated by determining the viral titers at different times after infection in triplicates. The media supernatants of infected cells were collected at indicated times during 24 h of infection and stored at –80°C prior to viral titer analysis by focus forming assay. The average mean (±SD) of controls (Ct1 and Ct2) and patient cells (Pt1 and Pt2) are on the left. The values for the individual control and patient cells are on the right.
Discussion
A specific W342 mutation in the transcriptional corepressor CTBP1 leads to prominent neurodevelopmental manifestations including intellectual disability, ataxia, and hypotonia in affected patients (Beck et al., 2016, 2019; Sommerville et al., 2017). The neurodevelopmental phenotypes conferred by the CTBP1 p.R342W allele provide genetic evidence that CTBP1 is important for normal human neurodevelopment. We employed patient iPSC-derived neuronal cell models to determine the transcriptional activities of the pathogenic CTBP1 p.R342W allele and the potential link to functional abnormalities in neurons. By using iPSC-derived “early” neurons of two different patients with CTBP1 p.R342W mutations (out of 12 known patients) and two healthy age-matched donors, we determined the transcriptional profiles through RNA-seq analysis. These results revealed down-regulation of genes involved in three major neuronal functions: including cell adhesion, neurodevelopment, and antiviral (type I interferon) response (Figure 3). The altered gene expression profiles appear to be consistent with intellectual and movement disorder phenotypes seen in patients with CTBP1 mutations (Beck et al., 2016, 2019; Sommerville et al., 2017).
Our results revealed down-regulation of several neuronal adhesion genes such as KIRREL3, CDH10 and CDH12 (Figure 4A and Supplementary Table 1). Reduced expressions of these genes or specific mutations in these genes have previously been implicated in intellectual disabilities (see citations in Supplementary Table 2). For example, the intellectual disability gene KIRREL3 was shown to regulate target-specific mossy fiber synapse development in the hippocampus, and cadherin 12 (CDH12) was shown to mediate calcium dependent cell-cell adhesion. The neuronal adhesion genes appear to exert their effects through alterations of synaptic adhesion of neurons. Similarly, the expression of several genes involved in neurodevelopment (e.g., SOX14), ion channel activities (e.g., BRINP2 and KCNIP2) and neuronal receptors (GFRA3, NR4A2, RET and ISLR2) is also reduced in our patient-derived neurons. Mice lacking Brinp2 were reported to exhibit neurodevelopmental phenotypes while Kcnip2 and associated subunits were shown to regulate homeostatic neuronal excitability (ref. in Supplementary Table 2). Additionally, the expressions of certain neuronal transcription factors that are involved in neuronal development and survival (ETV5, TAL1 and EN1) were also reduced in patient neurons. These results suggest that the neurodevelopmental phenotypes caused by the CTBP1 p.R342W allele may be related to global down regulation of a number of genes that are involved in neuron survival, growth, membrane excitability, synaptic transmission and plasticity.
Here, we have used physiologically relevant patient-derived and age-matched control neuronal cell models to determine the transcriptional profiles of primary iPSC-derived neurons. Many human neuronal diseases (including CTBP1p.R342W-mutated developmental defects; our unpublished data) do not appear to manifest phenotypes in the mouse models. In the lack of suitable animal models, human neuronal cell models are most relevant. However, we acknowledge the limitations of our study. It involved cells derived from a limited number of patients (2 out of 12 known patients that were available) and these cell models exhibited inherent inter-patient differences. However, application of suitable data analysis approaches revealed a prominent patient-centric transcriptional pattern that was validated by RT-qPCR analysis. We note that the transcriptional patterns of iPSC-derived patient cell models is somewhat different from that of a reconstituted exogenously introduced CTBP1p.R342W mutant allele (Beck et al., 2019), suggesting that the cell type (glioblastoma vs primary neuron) and/or the endogenous chromatin context influence the gene expression of the CTBP1 mutant allele.
Our phase contrast images and immunostaining of DAPI and cytoskeletal β-tubulin and MAP2 markers revealed that patient neurons exhibited thinner neuritic processes and fewer cell bodies as compared to those in control donor neurons. This decrease in DAPI-positive cells in patient cultures could be the result of a decrease in cell survival, proliferation or a change in cell fate. This could be due to the aforementioned compromised cell adhesion genes/proteins in CtBP1 patients’ neurons because adhesion molecules have been reported to play important roles in various neuronal developmental processes including neural precursor cell proliferation, differentiation, growth cone pathfinding, neural excitability, and cell-cell communications (Dihne et al., 2003; Valente et al., 2016). The significant thinner neuritic processes in patients’ neurons may indicate smaller neuritic surface areas for housing ionic channels and transmitter receptors, resulting in the decreased efficiency of neuronal conductivity and synaptic communication. These data suggest that CTBP1 p.R342W mutation may negatively impact the production of key molecular components of neural cytoskeletal structures. Although no studies have demonstrated a direct link between CtBP1 and the cytoskeleton in mammalian cells, it has been reported that a “CtBP/BARS-like” protein in plants has a direct activity on the microtubule cytoskeleton (Folkers et al., 2002). Specifically, the plant CtBP homolog, Angustifolia (AN) was reported to control polar elongation of leaf cells via regulation of microtubule cytoskeleton proteins and mutations in AN caused aberrant development and distribution of the microtubules. Thus, our results along with previously published data suggest that CtBP1 may be important for normal development of neural cytoskeletal structures which in turn contribute to neural morphogenesis and synaptic function. The pathological phenotypes in patients with CTBP1 p.R342W mutations may be caused by impairments in microtubule development and neuronal connections.
In addition to its roles in neuron morphological development, CtBPs also regulate genes involved in neuronal excitability. For example, CtBPs affect gene expression in epileptogenesis (Hubler et al., 2012; Goldberg and Coulter, 2013; Liu et al., 2017), and are highly expressed in many brain regions where they may play a role in synaptic transmission and plasticity (Tom Dieck et al., 2005; Jose et al., 2008). We showed here that neurons derived from patients with CTBP1 p.R342W mutations had altered spontaneous Ca2+ waves and whole-cell Na+ currents, further implying its involvement in neural excitability and synaptic function. Intracellular Ca2+ is essential to many developmental events including neural survival, differentiation, proliferation, and neurite outgrowth as well as synapse formation, synaptic transmission, and plasticity (Rosenberg and Spitzer, 2011; Grienberger and Konnerth, 2012). It is becoming increasingly clear that the common pattern of Ca2+ signaling in neurons is a pattern of spiking activities (Ca2+ transients), and the amplitude and frequency of Ca2+ transients are key determinants for normal neuronal development and function (O’Donovan, 1999; Dupont et al., 2011; Gasperini et al., 2017). For example, Ca2+ transients but not sustained Ca2+ elevations play important roles in axon growth and branching, growth cone turning, and cytoskeletal stabilization in developing mammalian neurons (Tang et al., 2003). Interestingly, our study revealed that Ca2+ in neurons derived from CTBP1- mutated patients exhibited more sustained patterns, and the amplitude and frequency of Ca2+ were significantly altered compared to those in control donor neurons (Figure 5A). Because of the central role of Ca2+ in neuronal physiology, even moderate alterations of Ca2+ homeostasis may lead to profound functional impairments as shown in several neuronal disorders (Wojda et al., 2008; Kawamoto et al., 2012; Oliveira et al., 2014). Therefore, the CTBP1 mutation-mediated alteration in Ca2+ transients may in turn contribute to the morphological abnormalities in the neuritic cytoskeleton observed in our study. In line with this postulation is a study showing that CtBP1 was a molecular constituent of the subfamily 2 of voltage-gated Ca2+ channel (CaV2) proteome in the rat brain, which co-purified with cytoskeletal proteins. These results raised the possibility that CtBP1 may regulate Ca2+ signaling via CaV and could play a role in regulating cytoskeletal function. However, future studies are warranted to investigate the exact mechanistic action of CtBP1 on the functions of CaV and cytoskeletal proteins.
Here, we also provide evidence that CTBP1 mutation alters whole cell ionic currents including voltage-gated Na+ (NaV) currents. NaV channels are essential for neuronal electrical activity generation and propagation. The abnormal NaV currents detected in CTBP1-mutated neurons in our study suggest that CtBP1 may interact with NaV channels and regulate its expression and/or function in neurons. Furthermore, our RNA-seq data showed that the CTBP1 p.R342W mutation down regulated KCNIP, a gene encoding a Ca2+-binding protein that is an integral subunit component of KV4 (Burgoyne, 2007). Activity of KV4 currents contributed to neuronal excitability in response to changes in intracellular Ca2+ (Burgoyne, 2007). Together these studies provide insights into the involvement of specific ions such as Ca2+, Na+, or K+. Altering the homeostasis of these ions is indicative of changes in action potentials in neurons. However, future studies on direct measurement and comparison of action potentials using isogenic cell models would be of interest to elucidate misregulation of neuronal activities by altered ionic homeostasis.
Brain imaging results have been reported for a subset of patients with CTBP1 p.R342W mutations and those studies revealed cerebellar volume reduction in consecutive scans (Beck et al., 2016; Sommerville et al., 2017). Among the various human tissues, CTBP1 is highly expressed in the cerebellum1. It was reported that CtBP(1/2) proteins play an anti-apoptotic role in primary cerebellar granule cells as well as in dopaminergic neuron-like cells (Stankiewicz et al., 2013). Our results showed that the patient neurons expressed reduced levels of the homeodomain transcription factor, Engrailed 1 (EN1). The activity of EN1 is required for normal cerebellar differentiation (Wurst et al., 1994; Joyner, 1996) and survival of dopaminergic neurons (Chi et al., 2003; Alvarez-Fischer et al., 2011), suggesting the possibility that reduced expression of EN1 in patients might contribute to the cerebellar pathology of CTBP1-mutated patients, hence future investigation of CTBP1 mutation in cerebellar function is also much wanted.
The effect of CTBP1 p.R342W on interferon-response genes was unexpected since patients have not demonstrated any increased susceptibility toward infections although this has not been characterized in detail. Our results suggest that the iPSC-derived “early” neurons express constitutive basal levels of type I interferon-response genes and that the expression is diminished in patient-derived “early” neurons. Although the interferon signaling pathway in neurons is not well-studied, homeostatic expression of type I interferon response genes in neurons have been reported (Cavanaugh et al., 2015; Drokhlyansky et al., 2017). Developing neurons respond to pathogenesis by neurotropic viruses via production of type I interferon (reviewed by Chakraborty et al., 2010; Nallar and Kalvakolanu, 2014). Since the expression of interferon response genes is lower in CTBP1-mutated early neurons compared to the constitutive levels in control cells, our results suggest a role for CTBP1 in the regulation of interferon response in early neurons. Thus far, a direct role for CtBP1 in regulating the expression of interferon-response genes has not been identified. However, the histone methyltransferase PRDM16 which interacts with CtBPs was reported to repress type I interferon response genes in adipocytes (Kissig et al., 2017) in intestinal epithelium (Stine et al., 2019). PRDM16 also plays critical roles in neuronal development and was previously shown to control embryonic and post-natal neural stem cell maintenance and differentiation in the brain (Inoue et al., 2017; Shimada et al., 2017). It is possible that the CTBP1 p.R342W allele may augment the activities of repressors such as PRDM16 to reduce the level of constitutive interferon signaling in early neurons. Additionally, it remains to be seen whether peripheral blood from patients demonstrates a similar decrease in interferon-response to neurons. Our results suggest that patients with CTBP1 mutations may have an additional risk factor of increased susceptibility to neuronal viral pathogens.
The mechanism by which the CTBP1 p.R342W allele regulates transcription in neuronal cells remains to be determined. All known CTBP1-mutated patients contained the same c.C991→T (CTBP1-S) transition within the CTBP1 gene. Since the mutation is heterozygous, it appears that the mutation may either act as a dominant negative or gain of function. An in silico prediction suggests potential dominant negative phenotype for the CTBP1 p.R342W allele (Beck et al., 2016). There have been multiple reports of frame-shift mutations in individuals who are not affected (ExAC database: PMID:27535533), implying that one allele of CTBP1 is enough to avoid neurologic phenotype. Potential dominant negative activity of the mutant allele may affect functions of both CtBP1 and CtBP2 (Figure 7). It should be noted that Arg at residue 342 is conserved in most vertebrate (including CtBP2) and invertebrate CtBPs, suggesting a pivotal role for it in CtBP functions. The mutation CTBP1p.R342W is located within the major protein-interaction cleft (known as PXDLS-binding cleft) that is involved in binding with different transcriptional repression molecules of the CTBP1/2-repression complex (Chinnadurai, 2007), and the mutation was shown to impair such interactions (Beck et al., 2019). Recently, two different CTBP1-mutated patients with two different mutations within CTBP1 protein sequences that involved interaction with the components of the CTBP-repression complex have also been identified (David Beck; Nijala Al-Sweel; personal communications). It is possible that the heterozygous CTBP1 mutant alleles may function as dominant repressors by not dissociating from the target gene promoters (Figure 7). Alternative models may include compromised transcriptional repression activity of the heterozygous CTBP1 alleles, resulting in relief of repression of a master transactional repressor. Such a repressor may directly repress different neuronal target genes.
FIGURE 7.

Model for transcriptional down-regulation of neuronal target genes by CTBP1 mutant allele. CTBP1 mutant protein may homo/heterodimerize with CTBP1 wt or CTBP2 wt. The homo/heterodimeric/oligomeric CTBP-complex may lead to enhanced repression of neuronal target genes as a result of defective dissociation from the target gene promoters directly or indirectly through reduced expression of transcriptional activators (A). Alternatively, the heterodimeric complex may result in up-regulation of a certain transcriptional repressors that may repress a battery of neuronal target genes (B). The down-regulated neurodevelopmental genes function in cell-cell/synaptic adhesion, neuronal transcription, axon growth, ion channel and anti-viral response genes. The transcriptional model does not exclude any potential cytosolic effects of CTBP1 mutant protein indirectly influencing the transcriptional outcome.
Phenotypes caused by the CTBP1 p.R342W allele partially overlap with some core phenotypes of Wolf-Hirschhorn syndrome (WHS). WHS patients exhibit deletions in the chromosomal region (chromosome 4p16.3) that spans chromosome CTBP1 locus (Battaglia et al., 2008; Zollino et al., 2008). In certain patients with the smallest micro-deletions in 4p16.3, a cluster of four genes including NSD2 and CTBP1 is deleted, implicating CTBP1 in neurodevelopmental disorders including epilepsy in some WHS patients (Misceo et al., 2012). Thus, it appears that deleting CTBP1 may contribute to some WHS phenotypes, in addition to mutations in WHS genes. Disrupting C. elegans CtBP1 also results in exploration and movement phenotypes (Reid et al., 2015; Yeon et al., 2018). Thus, multiple investigations, including our current transcriptional profiling studies, indicate an emerging importance of CtBP1 in normal neuronal development and activities.
Materials and Methods
Fibroblasts: The human dermal fibroblasts from patients (CSC43 and CSC44, designated here as Pt1 and Pt2, respectively) and healthy donors (LE028 and NT011, designated Ct1 and Ct2, respectively) were received from Columbia University, Department of Pediatrics and Medicine and were grown in DMEM supplemented with 10% fetal bovine serum. Informed consent was obtained from all individual participants included in the study.
Stem cells: Patient and donor iPSCs were generated by reprogramming dermal fibroblasts by transduction of Sendai virus (SeV) vectors expressing the Yamanaka factors. Fibroblasts were transduced with CytoTune SeV reprogramming vectors. Eight days after transduction with SeV, colonies were harvested and re-plated on Mouse Embryonic Fibroblast (MEF) culture dishes. The transduced cells were expanded on MEF culture dishes and were then shifted to iPSC medium (ThermoFisher Scientific). The medium was composed of Dulbecco’s Modified Eagle Medium F-12 Mixture (DMEM/F-12), KnockOut Serum Replacement (KnockOut SR), Non-Essential Amino Acids, Basic Fibroblast Growth Factor (FGF-Basic), and 2-mercaptoethanol. Colonies were stained with live cell imaging agent TRA-1-60 Alexa flour 594 conjugate antibody (ThermoFisher Scientific) and picked for further propagation and characterized by immunocytochemistry using iPSC marker, SOX2. In order to convert iPSCs to Neural Stem Cells (NSCs), the cells were plated on Geltrex coated plates and grown with PSC Neural induction media as per the protocol (ThermoFisher Scientific). The differentiated NSC cells were characterized by immunocytochemistry using NSC makers, Nestin.
Early neurons: Early neurons were generated by differentiation of NSC. For this, NSCs were first plated on poly-ornithine and laminin coated plates and grown using NSC Serum Free Media (SFM) (ThermoFisher Scientific) for the first 2 days. The NSC SFM was composed of Knockout DMEM/F-12, Stempro Neural Supplement, Recombinant FGF-Basic (Human), GlutaMAXTM-I Supplement, and recombinant EGF (Human). After 2 days, they were grown in differentiation medium, which is composed of 1X neurobasal medium, serum free B-27 supplement, and GlutaMAXTM-I supplement.
RNA sequencing and data analysis: Cells were grown in a 6-well plate. Cell culture media was aspirated and cells were lysed with Trizol (Zymo Research, Irvine, CA, United States). Total RNA was purified using the Direct- Zol RNA kit (Zymo Research, Irvine, CA, United States) following the manufacturer’s protocol. Library preparation was performed with 1 μg of total RNA, concentration was determined by Qubit and integrity was determined using an Agilent tapestation or bioanalyzer. Ribosomal RNA was removed by a hybridization method using Ribo-ZERO kits (Illumina). Depletion and mRNA yield was confirmed by bioanalyzer. mRNA was then fragmented in buffer containing 40 mM Tris acetate pH 8.2, 100 mM potassium acetate and 30 mM magnesium acetate and heating to 94 degrees for 150 s. mRNA was reverse transcribed to yield cDNA using SuperScript III RT enzyme (Life Technologies, per manufacturer’s instructions) and random hexamers. A second strand reaction was performed to yield ds-cDNA. cDNA was blunt ended, had an A base added to the 3’ends, and then had Illumina sequencing adapters ligated to the ends. Ligated fragments were then amplified for 12–15 cycles using primers incorporating unique index tags. Library molarity was determined by Qubit assay for concentration and tapestation for size. An equimolar pool was made of all libraries with unique indices. Fragments were sequenced on an Illumina HiSeq-3000 using single reads extending 50 bases.
Basecalls and demultiplexing were performed with Illumina’s bcl2fastq software and a custom python demultiplexing program with a maximum of one mismatch in the indexing read. RNA-seq reads were then aligned to the Ensembl release 76 top-level assembly with STAR version 2.0.4b. Gene counts were derived from the number of uniquely aligned unambiguous reads by Subread:featureCount version 1.4.5. All gene counts were then imported into the R/Bioconductor package EdgeR and TMM normalization size factors were calculated to adjust for samples for differences in library size. Ribosomal genes and genes not expressed in at least five samples greater than one count-per-million were excluded from further analysis. The TMM size factors and the matrix of counts were then imported into the R/Bioconductor package Limma. Weighted likelihoods based on the observed mean-variance relationship of every gene and samples were then calculated for all samples with the voomWithQualityWeights. Unknown latent effects were estimated with surrogate variable analysis and differential expression analysis was then performed to analyze for differences between conditions and the results were filtered for only those genes with Benjamini-Hochberg false-discovery rate adjusted p-values less than or equal to 0.05. Global log 2 fold-change perturbations in known Gene Ontology (GO) terms and KEGG pathways were detected using the R/Bioconductor package GAGE and deemed significant with Benjamini-Hochberg false-discovery rate adjusted p-value less than or equal to 0.05.
To find the most critical genes, the raw counts were variance stabilized with the R/Bioconductor package DESeq2 and then interrogated via weighted gene correlation network analysis with the R/Bioconductor package WGCNA. Briefly, all genes were correlated across each other by Pearson correlations and clustered by expression similarity into unsigned modules using a power threshold empirically determined from the data. An eigengene was then created for each de novo cluster and its expression profile was then correlated across all coefficients of the model matrix. Because these clusters of genes were created by expression profile rather than known functional similarity, the clustered modules were given the names of random colors where gray is the only module that has any pre-existing definition of containing genes that do not cluster well with others. For modules where the eigengene correlation exceeded 75%, the modules of genes were tested for functional enrichment of known GO terms with hypergeometric tests available in the R/Bioconductor package clusterProfiler. Significant terms with Benjamini-Hochberg adjusted p-values less than 0.05 were then collapsed by similarity into clusterProfiler category network plots to display the most significant terms for each module of hub genes in order to interpolate the function of each significant module. The hub genes for each significant module were then assessed for whether or not those features were also found to be significantly differentially expressed using Limma.
Confocal imaging and immunocytochemistry: Phase contrast images of iPSC/NSC-derived neurons were taken on an inverted microscope (Olympus CKX53). Images were taken under a 20× objective lens and image acquisition parameters were kept consistent between control and patient neurons. After imaging, cells were fixed for 30 min with 4% paraformaldehyde and subsequently washed three times with 1× PBS, permeabilized for 5 min with 0.3% Triton in 1× PBS, and blocked with 5% goat serum diluted in 1× PBS for 1 h. Preparations were then incubated overnight with monoclonal anti-beta-3 Tubulin or anti-MAP2 antibodies produced in mouse (1:500) (Sigma, T0198 for anti-beta-3 Tubulin and Invitrogen, 13-1500 for MAP2). Cells were rinsed three times with 1× PBS the next day. Cells were then incubated with either Alexa Fluor 488 goat anti-mouse IgG secondary antibody (1:500) (ThermoFisher Scientific, A11029) for labeling beta-3 Tubulin or Alexa Fluor 546 goat anti-mouse IgG secondary antibody (1:500) (ThermoFisher Scientific, A11030) for labeling MAP2 for 1 h at room temperature (21–22°C) under dark conditions. Cells were rinsed three times with 1× PBS, and mounted using MOWIOL mounting media with 4′6-diamidino-2-phenylindole dihydrochloride (Sigma, F6057). Samples were acquired and viewed using laser scanning confocal microscopy (Leica TCS SP8 STED 3X super-resolution system) under a 40× oil objective at 488 nm excitation (green, beta-3 Tubulin) with a 515/30 emission filter and 543 nm excitation (red, MAP2) with a 590/50 emission filter. Stack images of 0.7 μm were first collected and compressed into single 3D images. Image acquisition parameters for control and patients’ neurons were kept the same.
To quantify morphological differences between patient and control cells, ImageJ and its plugin NeuronJ were utilized as previously described (Meijering et al., 2004; Pemberton et al., 2018). For neuronal growth parameters (neurite length, number and thickness), phase contrast images were taken of 14-day differentiated neurons as described above. The NeuronJ software was programmed to output length of each neurite (μm) and number of neurites measured in each phase contrast image. For neurite thickness analyses, primary neurites extending directly from a cell body were identified. In each phase contrast image, 10 primary neurites were randomly identified, and the thickest part of the neurite was measured and averaged. To determine differences in the number of DAPI-positive cells between patients and controls, confocal images were analyzed in ImageJ, and the number of DAPI-stained cells was counted. A one-way analysis of variance (ANOVA) was completed to statistically analyze all data followed by Tukey’s HSD Post hoc test as appropriate. Data are presented as mean ± SEM.
Ca2+ Imaging: Ca2+ imaging experiments were performed using Fura-2 acetoxymethyl ester (AM) ratiometric Ca2+ indicator for monitoring basal intracellular Ca2+ levels in iPSC/NSC cells derived from control and patients. Cells differentiated into neurons for about 14 days were loaded with 5 μM Fura-2 AM (ThermoFisher Scientific Cat #: F1201) in HBSS for 30 min at 37°C followed by four 10 min washes in HBSS. Cells sat for 15 min to ensure full conversion of the dye before imaging. Images of each wavelength were taken once every second on an inverted microscope (Olympus IX73) installed with a Retiga R1 camera (Qimage). Excitation wavelengths of 340 and 380 nm were delivered using a LAMBDA XL equipped with high-speed wavelength switcher (Sutter Instrument, Novato, CA, United States) through a 40× objective for 10–20 min. The emitted fluorescence signal was collected at 510 nm by the Retiga R1 camera. Images were acquired with the MetaFluor Imaging software (Olympus) and processed and analyzed using ImageJ. Comparisons were made between individual control and mutant samples using student’s t-Test with Benjamini-Hochberg procedure to control for multiple comparisons.
Whole-Cell Patch-Clamp Recordings: Whole-cell patch-clamp recordings of voltage-dependent ionic currents were performed on neurons after 14 days of differentiation in culture using a Multiclamp 700B amplifier (Axon Instruments; Sunnyvale, CA, United States) connected to an analog-to-digital interface Digidata 1500A (Axon Instruments). Signals were acquired and stored through pClamp 10.6 software (Axon Instruments). Whole-cell currents were recorded under voltage-clamp mode with the holding potential of −70 mV. Currents were evoked by voltage steps ranging from −90 mV to +60 mV in 10 mV increments. The external solution contained (in mM) NaCl, 135; CaCl2, 3; KCl, 5; MgCl2, 2; HEPES, 10; D-Glucose, 10; pH adjusted to 7.3 with NaOH. The internal pipette solution was composed of (in mM) CsCl, 130; MgCl2, 0.3; HEPES, 10; EGTA, 0.1, ATP-Mg, 3; GTP-Na, 0.6; pH adjusted to 7.3 with CsOH. The osmolarity for internal solution was approximately 300 mOsm (295–305) and for external solution approximately 330 mOsm (320–340). Borosilicate glass pipettes were pulled using a horizontal micropipette puller (Model P-1000, Sutter instrument Co., United States) and had a tip resistance ranging from 3 to 6 MΩ after filling with internal solutions. Only cells with series resistances less than ∼20 MΩ and leaks less than ∼80 pA were selected for the analysis. Traces were processed using Clampfit 10.6 software (Axon Instruments).
Cell adhesion assay: The adherence activity of control and CTBP1-mutated neurons was determined by a “flipping” assay (Langhe et al., 2016). NSCs were differentiated to neurons (6 days) and dissociated using StemPro Accutase. Cells were counted and plated (1 × 10⁴ cells) onto Geltrex coated Lab-Tek II Chamber 8-well glass slides and incubated for 30 min at 37°C. One set of dishes was flipped over and shaken to remove non-adherent cells. The adherent cells were fixed and stained with DAPI and immunostained with MAP2 antibody. The numbers of adherent cells were determined by counting 3 independent areas for each experiment. The cells were counted using Cytation 3 Cell Imaging Multi-Mode Reader (BioTek). The percentage of adhered (flipped) cells was calculated based on un-flipped cells. Comparisons between control and mutant adherence were performed using one-way analysis of variance (ANOVA) with Bonferroni Multiple Comparisons post hoc test. All experimental data were reported as mean ± SEM and three independent experiments were performed. P < 0.05 was considered statistically significant.
West Niles Virus (WNV) replication assay: WNV-NY (strain 3000.0259) passaged once in Vero cells (African green monkey kidney epithelial cells) was purchased from American Type Culture Collection (ATCC CCL-81). The virus was titered using a standard focus forming assay (FFA) on Vero cells as previously described (Pinto et al., 2014). WNV replication was determined by single step growth in human CTBP1-mutated or healthy control neurons. The 14-days differentiated neurons were infected with WNV at MOI = 1 and allowed to incubate for 1 h before the virus was removed. The progeny viral titers were determined by focus forming assay (FFA) as described (Pinto et al., 2014).
Data Availability Statement
The original contributions presented in the study are publicly available. This data can be found here: https://www.ncbi.nlm.nih.gov/geo/query/acc.cgi?acc=GSE158754.
Author Contributions
GC designed and directed the project, and wrote the manuscript. SV performed the transcriptome analysis, validation, imaging of neurons and cell adhesion assay. TS participated in the characterization of patient-derived cells. UE generated the stem cells from patient fibroblasts and participated in the transcriptome analysis. KS and AG participated in the generation of stem cells from patient fibroblasts along with UE and FX performed electrophysiological experiments and wrote sections of the manuscript. BH and KP participated in cell and calcium imaging studies. EG, AP, and JB designed the studies on response of neurons to WNV infection. ET performed RNA-seq data analysis. DB, WC, and CG along with GC designed, supervised the project and edited the manuscript. All authors contributed to the article and approved the submitted version.
Conflict of Interest
The authors declare that the research was conducted in the absence of any commercial or financial relationships that could be construed as a potential conflict of interest.
Acknowledgments
We thank the families of patients with CTBP1 mutations for their generous contributions. We thank Cure, C. and Anne Rutkowski with their help in patient recruitment. Research reported in this publication was supported by the Eunice Kennedy Shriver National Institute of Child Health and Human Development of the National Institutes of Health under Award Number U54 HD087011 to the Intellectual and Developmental Disorders Research Center at Washington University and the Washington University Institute of Clinical and Translational Sciences grant UL1TR002345 from the National Center for Advancing Translational Sciences (NCATS) of the National Institutes of Health (NIH) and a Presidential Research support from Saint Louis University. The content is solely the responsibility of the authors and does not necessarily represent the official view of the NIH.
Funding. WC is supported from grants from SFARI and the JPB Foundation. KS and AG were supported by a grant from the DeNardo Education and Research Foundation. FX was supported by a National Science Foundation (NSF) research grant (Award Number 1916563).
Supplementary Material
The Supplementary Material for this article can be found online at: https://www.frontiersin.org/articles/10.3389/fnins.2020.562292/full#supplementary-material
iPSC and NSC immunostaining.
GO network plot for positively regulated genes and heat maps. (A) GO Biological Process Enrichment Bar Plot (pink): All 454 positively correlated WGCNA de novo clustered pink genes were tested for enrichment across known GO biological processes with the R/Bioconductor package clusterProfiler. The color illustrates the significance of the enrichment and the size of each bar characterizes the number of genes for each enriched term. The up-regulation and positive correlation of pink module genes alludes to the up regulation represented by each significant term. (B) Module GO Category Network Plot: Positively correlated genes clustered and labeled as pink and tested for enrichment across known GO biological processes with the R/Bioconductor package clusterProfiler. Significant terms with overlapping genes are clustered together while the overlapping genes represented in the pink network module illustrate the connections between those terms. (C) Heat map: Heat map representing positively correlated genes in the pink module whose z-scores illustrate their up regulation and high positive correlation across all mutant samples.
(A) GO Biological Process Enrichment Bar Plot (white): All 81 negatively correlated WGCNA de novo clustered white genes were tested for enrichment across known GO biological processes with the R/Bioconductor package clusterProfiler. The color illustrates the significance of the enrichment and the size of each bar characterizes the number of genes for each enriched term. The up-regulation and positive correlation of white module genes alludes to the up-regulation represented by each significant term. (B) White Module GO Category Network Plot: All 81 correlated genes clustered into a WGCNA de novo network labeled as white were tested for enrichment across known GO biological processes with the R/Bioconductor package clusterProfiler. Significant terms with overlapping genes are clustered together while the overlapping genes represented in the white network module illustrate the connections between those terms. (C) White Heat map: Heat map representing 81 genes in the white WGCNA module whose z-scores illustrate their up-regulation and high positive correlation across all mutant samples.
Whole-cell patch-clamping. Whole-cell patch-clamp currents were elicited by step depolarizations, and the peak inward currents at −10 mV were analyzed. Left panels show representative raw traces recorded and right panels show the statistical data. Our results, comparing to the matched control donors (Ct1 and Ct2), showed that CTBP1 mutation either significantly reduced the inward sodium currents in neurons from one patient (Pt1), or induced much larger sodium currents in the other patient (Pt2). Note that Pt2 cells expressed excessively robust inward current which reached to ≥4 nA.
List of highly down-regulated genes in patient neurons.
Neurodevelopmental genes down-regulated in CTBP1-mutated patient neurons.
References
- Abudureyimu S., Asai N., Enomoto A., Weng L., Kobayashi H., Wang X., et al. (2018). Essential role of linx/Islr2 in the development of the forebrain anterior commissure. Sci. Rep. 8:7292. [DOI] [PMC free article] [PubMed] [Google Scholar]
- Achim K., Peltopuro P., Lahti L., Tsai H. H., Zachariah A., Astrand M., et al. (2013). The role of Tal2 and Tal1 in the differentiation of midbrain GABAergic neuron precursors. Biol. Open 2 990–997. 10.1242/bio.20135041 [DOI] [PMC free article] [PubMed] [Google Scholar]
- Alvarez-Fischer D., Fuchs J., Castagner F., Stettler O., Massiani-Beaudoin O., Moya K. L., et al. (2011). Engrailed protects mouse midbrain dopaminergic neurons against mitochondrial complex I insults. Nat. Neurosci. 14 1260–1266. 10.1038/nn.2916 [DOI] [PubMed] [Google Scholar]
- Bajpe P. K., Heynen G. J., Mittempergher L., Grernrum W., de Rink I. A., Nijkamp W., et al. (2013). The corepressor CTBP2 is a coactivator of RAR/RXR in retinoic acid signaling. Mol. Cell Biol. 33 3343–3353. 10.1128/mcb.01213-12 [DOI] [PMC free article] [PubMed] [Google Scholar]
- Ban H., Nishishita N., Fusaki N., Tabata T., Saeki K., Shikamura M., et al. (2011). Efficient generation of transgene-free human induced pluripotent stem cells (iPSCs) by temperature-sensitive Sendai virus vectors. Proc. Natl. Acad. Sci. U.S.A. 108 14234–14239. 10.1073/pnas.1103509108 [DOI] [PMC free article] [PubMed] [Google Scholar]
- Battaglia A., Filippi T., Carey J. C. (2008). Update on the clinical features and natural history of Wolf-Hirschhorn (4p-) syndrome: experience with 87 patients and recommendations for routine health supervision. Am. J. Med. Genet. C Semin. Med. Genet. 148C 246–251. 10.1002/ajmg.c.30187 [DOI] [PubMed] [Google Scholar]
- Beck D. B., Cho M. T., Millan F., Yates C., Hannibal M., O’Connor B., et al. (2016). A recurrent de novo CTBP1 mutation is associated with developmental delay, hypotonia, ataxia, and tooth enamel defects. Neurogenetics 17 173–178. 10.1007/s10048-016-0482-4 [DOI] [PubMed] [Google Scholar]
- Beck D. B., Subramanian T., Vijayalingam S., Ezekiel U. R., Donkervoort S., Yang M. L., et al. (2019). A pathogenic CtBP1 missense mutation causes altered cofactor binding and transcriptional activity. Neurogenetics 20 129–143. 10.1007/s10048-019-00578-1 [DOI] [PMC free article] [PubMed] [Google Scholar]
- Berkowicz S. R., Featherby T. J., Whisstock J. C., Bird P. I. (2016). Mice lacking brinp2 or brinp3, or both, exhibit behaviors consistent with neurodevelopmental disorders. Front. Behav. Neurosci. 10:196. [DOI] [PMC free article] [PubMed] [Google Scholar]
- Bhalla K., Luo Y., Buchan T., Beachem M. A., Guzauskas G. F., Ladd S., et al. (2008). Alterations in CDH15 and KIRREL3 in patients with mild to severe intellectual disability. Am. J. Hum. Genet. 83 703–713. 10.1016/j.ajhg.2008.10.020 [DOI] [PMC free article] [PubMed] [Google Scholar]
- Burgoyne R. D. (2007). Neuronal calcium sensor proteins: generating diversity in neuronal Ca2 + signalling. Nat. Rev. Neurosci. 8 182–193. 10.1038/nrn2093 [DOI] [PMC free article] [PubMed] [Google Scholar]
- Byun J. S., Gardner K. (2013). C-terminal binding protein: a molecular link between metabolic imbalance and epigenetic regulation in breast cancer. Int. J. Cell Biol. 2013:647975. [DOI] [PMC free article] [PubMed] [Google Scholar]
- Cavanaugh S. E., Holmgren A. M., Rall G. F. (2015). Homeostatic interferon expression in neurons is sufficient for early control of viral infection. J. Neuroimmunol. 279 11–19. 10.1016/j.jneuroim.2014.12.012 [DOI] [PMC free article] [PubMed] [Google Scholar]
- Chakraborty S., Nazmi A., Dutta K., Basu A. (2010). Neurons under viral attack: victims or warriors? Neurochem. Int. 56 727–735. 10.1016/j.neuint.2010.02.016 [DOI] [PMC free article] [PubMed] [Google Scholar]
- Chi C. L., Martinez S., Wurst W., Martin G. R. (2003). The isthmic organizer signal FGF8 is required for cell survival in the prospective midbrain and cerebellum. Development 130 2633–2644. 10.1242/dev.00487 [DOI] [PubMed] [Google Scholar]
- Chinnadurai G. (2002). CtBP, an unconventional transcriptional corepressor in development and oncogenesis. Mol. Cell 9 213–224. 10.1016/s1097-2765(02)00443-4 [DOI] [PubMed] [Google Scholar]
- Chinnadurai G. (2007). Transcriptional regulation by C-terminal binding proteins. Int. J. Biochem. Cell Biol. 39 1593–1607. 10.1016/j.biocel.2007.01.025 [DOI] [PubMed] [Google Scholar]
- Dcona M. M., Morris B. L., Ellis K. C., Grossman S. R. (2017). CtBP- an emerging oncogene and novel small molecule drug target: advances in the understanding of its oncogenic action and identification of therapeutic inhibitors. Cancer Biol. Ther. 18 379–391. 10.1080/15384047.2017.1323586 [DOI] [PMC free article] [PubMed] [Google Scholar]
- Diamond M. S., Mehlhop E., Oliphant T., Samuel M. A. (2009). The host immunologic response to West Nile encephalitis virus. Front. Biosci. (Landmark Ed.) 14:3024–3034. 10.2741/3432 [DOI] [PubMed] [Google Scholar]
- Dihne M., Bernreuther C., Sibbe M., Paulus W., Schachner M. (2003). A new role for the cell adhesion molecule L1 in neural precursor cell proliferation, differentiation, and transmitter-specific subtype generation. J. Neurosci. 23 6638–6650. 10.1523/jneurosci.23-16-06638.2003 [DOI] [PMC free article] [PubMed] [Google Scholar]
- Dobin A., Davis C. A., Schlesinger F., Drenkow J., Zaleski C., Jha S., et al. (2013). STAR: ultrafast universal RNA-seq aligner. Bioinformatics 29 15–21. 10.1093/bioinformatics/bts635 [DOI] [PMC free article] [PubMed] [Google Scholar]
- Drokhlyansky E., Goz Ayturk D., Soh T. K., Chrenek R., O’Loughlin E., Madore C., et al. (2017). The brain parenchyma has a type I interferon response that can limit virus spread. Proc. Natl. Acad. Sci. U.S.A. 114 E95–E104. [DOI] [PMC free article] [PubMed] [Google Scholar]
- Dupont G., Combettes L., Bird G. S., Putney J. W. (2011). Calcium oscillations. Cold Spring Harbor Perspect. Biol. 3:a004226. [DOI] [PMC free article] [PubMed] [Google Scholar]
- Fang M., Li J., Blauwkamp T., Bhambhani C., Campbell N., Cadigan K. M. (2006). C-terminal-binding protein directly activates and represses Wnt transcriptional targets in Drosophila. EMBO J. 25 2735–2745. 10.1038/sj.emboj.7601153 [DOI] [PMC free article] [PubMed] [Google Scholar]
- Folkers U., Kirik V., Schobinger U., Falk S., Krishnakumar S., Pollock M. A., et al. (2002). The cell morphogenesis gene ANGUSTIFOLIA encodes a CtBP/BARS-like protein and is involved in the control of the microtubule cytoskeleton. EMBO J. 21 1280–1288. 10.1093/emboj/21.6.1280 [DOI] [PMC free article] [PubMed] [Google Scholar]
- Fontanet P. A., Rios A. S., Alsina F. C., Paratcha G., Ledda F. (2018). Pea3 Transcription factors, Etv4 and Etv5, are required for proper hippocampal dendrite development and plasticity. Cereb Cortex 28 236–249. 10.1093/cercor/bhw372 [DOI] [PubMed] [Google Scholar]
- Gasperini R. J., Pavez M., Thompson A. C., Mitchell C. B., Hardy H., Young K. M., et al. (2017). How does calcium interact with the cytoskeleton to regulate growth cone motility during axon pathfinding? Mol. Cell. Neurosci. 84 29–35. 10.1016/j.mcn.2017.07.006 [DOI] [PubMed] [Google Scholar]
- Goldberg E. M., Coulter D. A. (2013). Mechanisms of epileptogenesis: a convergence on neural circuit dysfunction. Nat. Rev. Neurosci. 14 337–349. 10.1038/nrn3482 [DOI] [PMC free article] [PubMed] [Google Scholar]
- Grienberger C., Konnerth A. (2012). Imaging calcium in neurons. Neuron 73 862–885. 10.1016/j.neuron.2012.02.011 [DOI] [PubMed] [Google Scholar]
- Guerin A., Stavropoulos D. J., Diab Y., Chenier S., Christensen H., Kahr W. H., et al. (2012). Interstitial deletion of 11q-implicating the KIRREL3 gene in the neurocognitive delay associated with Jacobsen syndrome. Am. J. Med. Genet. A 158A 2551–2556. 10.1002/ajmg.a.35621 [DOI] [PubMed] [Google Scholar]
- Hildebrand J. D., Soriano P. (2002). Overlapping and unique roles for C-terminal binding protein 1 (CtBP1) and CtBP2 during mouse development. Mol. Cell Biol. 22 5296–5307. 10.1128/mcb.22.15.5296-5307.2002 [DOI] [PMC free article] [PubMed] [Google Scholar]
- Hubler D., Rankovic M., Richter K., Lazarevic V., Altrock W. D., Fischer K. D., et al. (2012). Differential spatial expression and subcellular localization of CtBP family members in rodent brain. PLoS One 7:e39710. 10.1371/journal.pone.0039710 [DOI] [PMC free article] [PubMed] [Google Scholar]
- Inoue M., Iwai R., Tabata H., Konno D., Komabayashi-Suzuki M., Watanabe C., et al. (2017). Prdm16 is crucial for progression of the multipolar phase during neural differentiation of the developing neocortex. Development 144 385–399. 10.1242/dev.136382 [DOI] [PubMed] [Google Scholar]
- Itoh T. Q., Matsumoto A., Tanimura T. (2013). C-terminal binding protein (CtBP) activates the expression of E-box clock genes with CLOCK/CYCLE in Drosophila. PLoS One 8:e63113. 10.1371/journal.pone.0063113 [DOI] [PMC free article] [PubMed] [Google Scholar]
- Ivanova D., Dirks A., Montenegro-Venegas C., Schone C., Altrock W. D., Marini C., et al. (2015). Synaptic activity controls localization and function of CtBP1 via binding to Bassoon and Piccolo. EMBO J. 34 1056–1077. 10.15252/embj.201488796 [DOI] [PMC free article] [PubMed] [Google Scholar]
- Jiang D., Weidner J. M., Qing M., Pan X. B., Guo H., Xu C., et al. (2010). Identification of five interferon-induced cellular proteins that inhibit west nile virus and dengue virus infections. J. Virol. 84 8332–8341. 10.1128/jvi.02199-09 [DOI] [PMC free article] [PubMed] [Google Scholar]
- Jose M., Nair D. K., Altrock W. D., Dresbach T., Gundelfinger E. D., Zuschratter W. (2008). Investigating interactions mediated by the presynaptic protein bassoon in living cells by Foerster’s resonance energy transfer and fluorescence lifetime imaging microscopy. Biophys. J. 94 1483–1496. 10.1529/biophysj.107.111674 [DOI] [PMC free article] [PubMed] [Google Scholar]
- Joyner A. L. (1996). Engrailed, Wnt and Pax genes regulate midbrain–hindbrain development. Trends Genet. 12 15–20. 10.1016/0168-9525(96)81383-7 [DOI] [PubMed] [Google Scholar]
- Kawamoto E. M., Vivar C., Camandola S. (2012). Physiology and pathology of calcium signaling in the brain. Front. Pharmacol. 3:61. 10.3389/fphar.2012.00061 [DOI] [PMC free article] [PubMed] [Google Scholar]
- Kissig M., Ishibashi J., Harms M. J., Lim H. W., Stine R. R., Won K. J., et al. (2017). PRDM16 represses the type I interferon response in adipocytes to promote mitochondrial and thermogenic programing. EMBO J. 36 1528–1542. 10.15252/embj.201695588 [DOI] [PMC free article] [PubMed] [Google Scholar]
- Kumar V., Carlson J. E., Ohgi K. A., Edwards T. A., Rose D. W., Escalante C. R., et al. (2002). Transcription corepressor CtBP is an NAD(+)-regulated dehydrogenase. Mol. Cell 10 857–869. 10.1016/s1097-2765(02)00650-0 [DOI] [PubMed] [Google Scholar]
- Langfelder P., Horvath S. (2008). WGCNA: an R package for weighted correlation network analysis. BMC Bioinformatics 9:559. 10.1186/1471-2105-9-559 [DOI] [PMC free article] [PubMed] [Google Scholar]
- Langhe R. P., Gudzenko T., Bachmann M., Becker S. F., Gonnermann C., Winter C., et al. (2016). Cadherin-11 localizes to focal adhesions and promotes cell-substrate adhesion. Nat. Commun. 7:10909. [DOI] [PMC free article] [PubMed] [Google Scholar]
- Lee B., Lee M., Song S., Loi L. D., Lam D. T., Yoon J., et al. (2017). Specification of neurotransmitter identity by Tal1 in thalamic nuclei. Dev. Dyn. 246 749–758. 10.1002/dvdy.24546 [DOI] [PubMed] [Google Scholar]
- Leek J. T., Johnson W. E., Parker H. S., Jaffe A. E., Storey J. D. (2012). The sva package for removing batch effects and other unwanted variation in high-throughput experiments. Bioinformatics 28 882–883. 10.1093/bioinformatics/bts034 [DOI] [PMC free article] [PubMed] [Google Scholar]
- Liao Y., Smyth G. K., Shi W. (2014). featureCounts: an efficient general purpose program for assigning sequence reads to genomic features. Bioinformatics 30 923–930. 10.1093/bioinformatics/btt656 [DOI] [PubMed] [Google Scholar]
- Liu D., Liu Z., Liu H., Li H., Pan X., Li Z. (2016). Brain-derived neurotrophic factor promotes vesicular glutamate transporter 3 expression and neurite outgrowth of dorsal root ganglion neurons through the activation of the transcription factors Etv4 and Etv5. Brain Res. Bull. 121 215–226. 10.1016/j.brainresbull.2016.02.010 [DOI] [PubMed] [Google Scholar]
- Liu Y., Lai S., Ma W., Ke W., Zhang C., Liu S., et al. (2017). CDYL suppresses epileptogenesis in mice through repression of axonal Nav1.6 sodium channel expression. Nat. Commun. 8:355. 10.1038/s41467-017-00368-z [DOI] [PMC free article] [PubMed] [Google Scholar]
- Lu C. C., Cao X. J., Wright S., Ma L., Oertel D., Goodrich L. V. (2014). Mutation of Npr2 leads to blurred tonotopic organization of central auditory circuits in mice. PLoS Genet. 10:e1004823. 10.1371/journal.pgen.1004823 [DOI] [PMC free article] [PubMed] [Google Scholar]
- Martin E. A., Muralidhar S., Wang Z., Cervantes D. C., Basu R., Taylor M. R., et al. (2015). The intellectual disability gene Kirrel3 regulates target-specific mossy fiber synapse development in the hippocampus. Elife 4:e09395. [DOI] [PMC free article] [PubMed] [Google Scholar]
- Martinez S., Andreu A., Mecklenburg N., Echevarria D. (2013). Cellular and molecular basis of cerebellar development. Front. Neuroanat. 7:18. [DOI] [PMC free article] [PubMed] [Google Scholar]
- Meijering E., Jacob M., Sarria J. C., Steiner P., Hirling H., Unser M. (2004). Design and validation of a tool for neurite tracing and analysis in fluorescence microscopy images. Cytometry. A: J. Int. Soc. Anal. Cytol. 58 167–176. 10.1002/cyto.a.20022 [DOI] [PubMed] [Google Scholar]
- Misceo D., Baroy T., Helle J. R., Braaten O., Fannemel M., Frengen E. (2012). 1.5Mb deletion of chromosome 4p16.3 associated with postnatal growth delay, psychomotor impairment, epilepsy, impulsive behavior and asynchronous skeletal development. Gene 507 85–91. 10.1016/j.gene.2012.07.021 [DOI] [PubMed] [Google Scholar]
- Moon M., Jung E. S., Jeon S. G., Cha M. Y., Jang Y., Kim W., et al. (2019). Nurr1 (NR4A2) regulates Alzheimer’s disease-related pathogenesis and cognitive function in the 5XFAD mouse model. Aging Cell 18:e12866. 10.1111/acel.12866 [DOI] [PMC free article] [PubMed] [Google Scholar]
- Nallar S. C., Kalvakolanu D. V. (2014). Interferons, signal transduction pathways, and the central nervous system. J. Interferon Cytokine Res. 34 559–576. 10.1089/jir.2014.0021 [DOI] [PMC free article] [PubMed] [Google Scholar]
- Nardini M., Spano S., Cericola C., Pesce A., Massaro A., Millo E., et al. (2003). CtBP/BARS: a dual-function protein involved in transcription co-repression and Golgi membrane fission. EMBO J. 22 3122–3130. 10.1093/emboj/cdg283 [DOI] [PMC free article] [PubMed] [Google Scholar]
- Nassal D. M., Wan X., Liu H., Laurita K. R., Deschenes I. (2017). KChIP2 regulates the cardiac Ca2+ transient and myocyte contractility by targeting ryanodine receptor activity. PLoS One 12:e0175221. 10.1371/journal.pone.0175221 [DOI] [PMC free article] [PubMed] [Google Scholar]
- Nayler S. P., Powell J. E., Vanichkina D. P., Korn O., Wells C. A., Kanjhan R., et al. (2017). Human iPSC-derived cerebellar neurons from a patient with ataxia-telangiectasia reveal disrupted gene regulatory networks. Front. Cell. Neurosci. 11:321. [DOI] [PMC free article] [PubMed] [Google Scholar]
- O’Donovan M. J. (1999). The origin of spontaneous activity in developing networks of the vertebrate nervous system. Curr. Opin. Neurobiol. 9 94–104. 10.1016/s0959-4388(99)80012-9 [DOI] [PubMed] [Google Scholar]
- Oliveira A. M., Bading H., Mauceri D. (2014). Dysfunction of neuronal calcium signaling in aging and disease. Cell Tissue Res. 357 381–383. 10.1007/s00441-014-1954-1 [DOI] [PubMed] [Google Scholar]
- Orvis G. D., Hartzell A. L., Smith J. B., Barraza L. H., Wilson S. L., Szulc K. U., et al. (2012). The engrailed homeobox genes are required in multiple cell lineages to coordinate sequential formation of fissures and growth of the cerebellum. Dev. Biol. 367 25–39. 10.1016/j.ydbio.2012.04.018 [DOI] [PMC free article] [PubMed] [Google Scholar]
- Paliwal S., Ho N., Parker D., Grossman S. R. (2012). CtBP2 promotes human cancer cell migration by transcriptional activation of tiam1. Genes Cancer 3 481–490. [DOI] [PMC free article] [PubMed] [Google Scholar]
- Panza P., Sitko A. A., Maischein H. M., Koch I., Flotenmeyer M., Wright G. J., et al. (2015). The LRR receptor Islr2 is required for retinal axon routing at the vertebrate optic chiasm. Neural Dev. 10:23. [DOI] [PMC free article] [PubMed] [Google Scholar]
- Pemberton K., Mersman B., Xu F. (2018). Using ImageJ to assess neurite outgrowth in mammalian cell cultures: Research data quantification exercises in undergraduate neuroscience lab. J. Undergrad. Neurosci. Edu. 16 A186–A194. [PMC free article] [PubMed] [Google Scholar]
- Pinto A. K., Ramos H. J., Wu X., Aggarwal S., Shrestha B., Gorman M., et al. (2014). Deficient IFN signaling by myeloid cells leads to MAVS-dependent virus-induced sepsis. PLoS Pathog 10:e1004086. 10.1371/journal.ppat.1004086 [DOI] [PMC free article] [PubMed] [Google Scholar]
- Prekop H. T., Kroiss A., Rook V., Zagoraiou L., Jessell T. M., Fernandes C., et al. (2018). Sox14 is required for a specific subset of cerebello-olivary projections. J. Neurosci. 38 9539–9550. 10.1523/jneurosci.1456-18.2018 [DOI] [PMC free article] [PubMed] [Google Scholar]
- Ray S. K., Li H. J., Metzger E., Schule R., Leiter A. B. (2014). CtBP and associated LSD1 are required for transcriptional activation by NeuroD1 in gastrointestinal endocrine cells. Mol. Cell Biol. 34 2308–2317. 10.1128/mcb.01600-13 [DOI] [PMC free article] [PubMed] [Google Scholar]
- Redies C., Hertel N., Hubner C. A. (2012). Cadherins and neuropsychiatric disorders. Brain Res. 1470 130–144. 10.1016/j.brainres.2012.06.020 [DOI] [PubMed] [Google Scholar]
- Reid A., Sherry T. J., Yucel D., Llamosas E., Nicholas H. R. (2015). The C-terminal binding protein (CTBP-1) regulates dorsal SMD axonal morphology in Caenorhabditis elegans. Neuroscience 311 216–230. 10.1016/j.neuroscience.2015.10.026 [DOI] [PubMed] [Google Scholar]
- Ritchie M. E., Phipson B., Wu D., Hu Y., Law C. W., Shi W., et al. (2015). limma powers differential expression analyses for RNA-sequencing and microarray studies. Nucleic Acids Res. 43:e47. 10.1093/nar/gkv007 [DOI] [PMC free article] [PubMed] [Google Scholar]
- Rivera M., Wu Q., Hamerlik P., Hjelmeland A. B., Bao S., Rich J. N. (2015). Acquisition of meiotic DNA repair regulators maintain genome stability in glioblastoma. Cell Death Dis. 6:e1732. 10.1038/cddis.2015.75 [DOI] [PMC free article] [PubMed] [Google Scholar]
- Rosenberg S. S., Spitzer N. C. (2011). Calcium signaling in neuronal development. Cold Spring Harbor Perspect. Biol. 3:a004259. [DOI] [PMC free article] [PubMed] [Google Scholar]
- Sahu S. K., Tiwari N., Pataskar A., Zhuang Y., Borisova M., Diken M., et al. (2017). FBXO32 promotes microenvironment underlying epithelial-mesenchymal transition via CtBP1 during tumour metastasis and brain development. Nat. Commun. 8:1523. [DOI] [PMC free article] [PubMed] [Google Scholar]
- Schaller S., Buttigieg D., Alory A., Jacquier A., Barad M., Merchant M., et al. (2017). Novel combinatorial screening identifies neurotrophic factors for selective classes of motor neurons. Proc. Natl. Acad. Sci. U.S.A. 114 E2486–E2493. [DOI] [PMC free article] [PubMed] [Google Scholar]
- Shen Y., Kapfhamer D., Minnella A. M., Kim J. E., Won S. J., Chen Y., et al. (2017). Bioenergetic state regulates innate inflammatory responses through the transcriptional co-repressor CtBP. Nat. Commun. 8:624. [DOI] [PMC free article] [PubMed] [Google Scholar]
- Shi Y., Sawada J., Sui G., Affar El B., Whetstine J. R., Lan F., et al. (2003). Coordinated histone modifications mediated by a CtBP co-repressor complex. Nature 422 735–738. 10.1038/nature01550 [DOI] [PubMed] [Google Scholar]
- Shimada I. S., Acar M., Burgess R. J., Zhao Z., Morrison S. J. (2017). Prdm16 is required for the maintenance of neural stem cells in the postnatal forebrain and their differentiation into ependymal cells. Genes Dev. 31 1134–1146. 10.1101/gad.291773.116 [DOI] [PMC free article] [PubMed] [Google Scholar]
- Shrestha B., Gottlieb D., Diamond M. S. (2003). Infection and injury of neurons by West Nile encephalitis virus. J. Virol. 77 13203–13213. [DOI] [PMC free article] [PubMed] [Google Scholar]
- Sommerville E. W., Alston C. L., Pyle A., He L., Falkous G., Naismith K., et al. (2017). De novo CTBP1 variant is associated with decreased mitochondrial respiratory chain activities. Neurol. Genet. 3: e187. 10.1212/nxg.0000000000000187 [DOI] [PMC free article] [PubMed] [Google Scholar]
- Souza R. P., Romano-Silva M. A., Lieberman J. A., Meltzer H. Y., MacNeil L. T., Culotti J. G., et al. (2010). Genetic association of the GDNF alpha-receptor genes with schizophrenia and clozapine response. J. Psychiatr Res. 44 700–706. 10.1016/j.jpsychires.2010.01.002 [DOI] [PubMed] [Google Scholar]
- Spitzer N. C. (2006). Electrical activity in early neuronal development. Nature 444 707–712. 10.1038/nature05300 [DOI] [PubMed] [Google Scholar]
- Spitzer N. C., Gu X., Olson E. (1994). Action potentials, calcium transients and the control of differentiation of excitable cells. Curr. Opin. Neurobiol. 4 70–77. 10.1016/0959-4388(94)90034-5 [DOI] [PubMed] [Google Scholar]
- Stankiewicz T. R., Schroeder E. K., Kelsey N. A., Bouchard R. J., Linseman D. A. (2013). C-terminal binding proteins are essential pro-survival factors that undergo caspase-dependent downregulation during neuronal apoptosis. Mol. Cell. Neurosci. 56 322–332. 10.1016/j.mcn.2013.07.004 [DOI] [PMC free article] [PubMed] [Google Scholar]
- Stine R. R., Sakers A. P., TeSlaa T., Kissig M., Stine Z. E., Kwon C. W., et al. (2019). PRDM16 maintains homeostasis of the intestinal epithelium by controlling region-specific metabolism. Cell Stem Cell 25 830–845.e8. [DOI] [PMC free article] [PubMed] [Google Scholar]
- Tang F., Dent E. W., Kalil K. (2003). Spontaneous calcium transients in developing cortical neurons regulate axon outgrowth. J. Neurosci. 23 927–936. 10.1523/jneurosci.23-03-00927.2003 [DOI] [PMC free article] [PubMed] [Google Scholar]
- Ter-Avetisyan G., Dumoulin A., Herrel A., Schmidt H., Strump J., Afzal S., et al. (2018). Loss of axon bifurcation in mesencephalic trigeminal neurons impairs the maximal biting force in Npr2-deficient mice. Front. Cell Neurosci. 12:153. [DOI] [PMC free article] [PubMed] [Google Scholar]
- Tom Dieck S., Altrock W. D., Kessels M. M., Qualmann B., Regus H., Brauner D., et al. (2005). Molecular dissection of the photoreceptor ribbon synapse: physical interaction of Bassoon and RIBEYE is essential for the assembly of the ribbon complex. J. Cell Biol. 168 825–836. [DOI] [PMC free article] [PubMed] [Google Scholar]
- Tomuschat C., Puri P. (2015). RET gene is a major risk factor for Hirschsprung’s disease: a meta-analysis. Pediatr. Surg. Int. 31 701–710. 10.1007/s00383-015-3731-y [DOI] [PubMed] [Google Scholar]
- Valente P., Lignani G., Medrihan L., Bosco F., Contestabile A., Lippiello P., et al. (2016). Cell adhesion molecule L1 contributes to neuronal excitability regulating the function of voltage-gated Na+ channels. J. Cell Sci. 129 1878–1891. 10.1242/jcs.182089 [DOI] [PubMed] [Google Scholar]
- Wang H. G., He X. P., Li Q., Madison R. D., Moore S. D., McNamara J. O., et al. (2013). The auxiliary subunit KChIP2 is an essential regulator of homeostatic excitability. J. Biol. Chem. 288 13258–13268. 10.1074/jbc.m112.434548 [DOI] [PMC free article] [PubMed] [Google Scholar]
- Wang K., Zhang H., Ma D., Bucan M., Glessner J. T., Abrahams B. S., et al. (2009). Common genetic variants on 5p14.1 associate with autism spectrum disorders. Nature 459 528–533. [DOI] [PMC free article] [PubMed] [Google Scholar]
- Williams M. J., Klockars A., Eriksson A., Voisin S., Dnyansagar R., Wiemerslage L., et al. (2016). The Drosophila ETV5 homologue Ets96B: molecular link between obesity and bipolar disorder. PLoS Genet. 12:e1006104. 10.1371/journal.pgen.1006104 [DOI] [PMC free article] [PubMed] [Google Scholar]
- Wojda U., Salinska E., Kuznicki J. (2008). Calcium ions in neuronal degeneration. IUBMB Life 60 575–590. 10.1002/iub.91 [DOI] [PubMed] [Google Scholar]
- Wurst W., Auerbach A. B., Joyner A. L. (1994). Multiple developmental defects in Engrailed-1 mutant mice: an early mid-hindbrain deletion and patterning defects in forelimbs and sternum. Development 120 2065–2075. [DOI] [PubMed] [Google Scholar]
- Yeon J., Kim J., Kim D. Y., Kim H., Kim J., Du E. J., et al. (2018). A sensory-motor neuron type mediates proprioceptive coordination of steering in C. elegans via two TRPC channels. PLoS Biol. 16:e2004929. 10.1371/journal.pbio.2004929 [DOI] [PMC free article] [PubMed] [Google Scholar]
- Zhang Q., Piston D. W., Goodman R. H. (2002). Regulation of corepressor function by nuclear NADH. Science 295 1895–1897. [DOI] [PubMed] [Google Scholar]
- Zollino M., Murdolo M., Marangi G., Pecile V., Galasso C., Mazzanti L., et al. (2008). On the nosology and pathogenesis of Wolf-Hirschhorn syndrome: genotype-phenotype correlation analysis of 80 patients and literature review. Am. J. Med. Genet. C Semin. Med. Genet. 148C 257–269. 10.1002/ajmg.c.30190 [DOI] [PubMed] [Google Scholar]
Associated Data
This section collects any data citations, data availability statements, or supplementary materials included in this article.
Supplementary Materials
iPSC and NSC immunostaining.
GO network plot for positively regulated genes and heat maps. (A) GO Biological Process Enrichment Bar Plot (pink): All 454 positively correlated WGCNA de novo clustered pink genes were tested for enrichment across known GO biological processes with the R/Bioconductor package clusterProfiler. The color illustrates the significance of the enrichment and the size of each bar characterizes the number of genes for each enriched term. The up-regulation and positive correlation of pink module genes alludes to the up regulation represented by each significant term. (B) Module GO Category Network Plot: Positively correlated genes clustered and labeled as pink and tested for enrichment across known GO biological processes with the R/Bioconductor package clusterProfiler. Significant terms with overlapping genes are clustered together while the overlapping genes represented in the pink network module illustrate the connections between those terms. (C) Heat map: Heat map representing positively correlated genes in the pink module whose z-scores illustrate their up regulation and high positive correlation across all mutant samples.
(A) GO Biological Process Enrichment Bar Plot (white): All 81 negatively correlated WGCNA de novo clustered white genes were tested for enrichment across known GO biological processes with the R/Bioconductor package clusterProfiler. The color illustrates the significance of the enrichment and the size of each bar characterizes the number of genes for each enriched term. The up-regulation and positive correlation of white module genes alludes to the up-regulation represented by each significant term. (B) White Module GO Category Network Plot: All 81 correlated genes clustered into a WGCNA de novo network labeled as white were tested for enrichment across known GO biological processes with the R/Bioconductor package clusterProfiler. Significant terms with overlapping genes are clustered together while the overlapping genes represented in the white network module illustrate the connections between those terms. (C) White Heat map: Heat map representing 81 genes in the white WGCNA module whose z-scores illustrate their up-regulation and high positive correlation across all mutant samples.
Whole-cell patch-clamping. Whole-cell patch-clamp currents were elicited by step depolarizations, and the peak inward currents at −10 mV were analyzed. Left panels show representative raw traces recorded and right panels show the statistical data. Our results, comparing to the matched control donors (Ct1 and Ct2), showed that CTBP1 mutation either significantly reduced the inward sodium currents in neurons from one patient (Pt1), or induced much larger sodium currents in the other patient (Pt2). Note that Pt2 cells expressed excessively robust inward current which reached to ≥4 nA.
List of highly down-regulated genes in patient neurons.
Neurodevelopmental genes down-regulated in CTBP1-mutated patient neurons.
Data Availability Statement
The original contributions presented in the study are publicly available. This data can be found here: https://www.ncbi.nlm.nih.gov/geo/query/acc.cgi?acc=GSE158754.