Abstract
Background
Lung cancer is one of the most common cancers in the word. However, the underlying mechanism remains largely unknown. ACOT11 encodes enzymes hydrolyzing the fatty acyl-CoA esters into free fatty acids and CoA. Besides from its role in fatty acid metabolism, the other aspects regarding its function in the progression of lung cancer have not been revealed.
Methods
We first explored the clinical profile of ACOT11 in tumor samples. Next, we combined gene knockdown in vitro and in vivo and microarray gene profiling analysis to decipher the unknown regulatory role of ACOT11 in lung cancer carcinoma. Furthermore, we explored the potential molecular mechanisms of ACOT11 with immunoprecipitation.
Results
We found high expression of ACOT11 in tumor samples. High expression of ACOT11 showed significantly poor prognosis in lung squamous carcinoma (LUSC) patients. Knocking down of ACOT11 inhibited the cell proliferation, migration as well as invasion in vitro and in vivo. It also promoted the cell apoptosis and cell cycle arrest via multiple signaling pathways. Additionally, ACOT11 could bind with CSE1L, which was proved to be an oncogene in lung cancer and speculated to be a potential target of ACOT11.
Conclusions
The results revealed that ACOT11 regulates proliferation, migration and invasion of lung cancer carcinoma via multiple signaling pathways, indicating its potential value in molecular therapy.
Keywords: ACOT11, lung adenocarcinoma (LUAD), proliferation, apoptosis, invasion
Introduction
Nowadays, one of the most common cancers in the word is lung cancer (1) and it is a leading cause of cancer-associated mortality (2). Non-small cell lung cancer (NSCLC) accounts for most of the diagnosed cases of lung cancer (3) and adenocarcinoma is the most common subtype of NSCLC (4). Currently, the therapies for lung cancer have been significant developed, yet still not developed enough. For patients with pathologic stage IA and IB NSCLC, the 5-year survival rates are only 83% and 71%, respectively. However, the majority of lung cancer cases are diagnosed at advanced stage and patients with advanced NSCLC can undergo rapid clinical deterioration during disease progression. For those patients with pathologic stage II disease, the 5-year survival rates drop to 50% (5). The adjuvant chemotherapy could only make minimal improvement (6) and less than 50% of these patients with advanced NSCLC ever receive second-line therapy (7,8). Based on this, the mechanism study underlying lung cancer, especially those with poor prognosis, become more and more important.
The acyl-CoA thioesterase gene (ACOT) family encodes enzymes and the enzymes could hydrolyze the Fatty acyl-CoA esters into free fatty acids and CoA (9-11). In lipid metabolism, fatty acyl-Coenzyme A (CoA) esters are very essential components and they regulates of multiple cellular functions (12). The fatty acids are expressed at a significant higher level in the plasma of patients with lung adenocarcinoma (LUAD) compared with healthy individuals (13,14). These references indicate that the ACOT family might play an important role in the lung cancer. Some ACOT members have already been reported to be involved in the cancer development. For example, overexpression of ACOT8 is associated with metastasis in LUAD (15) and it could also mediate intracellular lipid metabolism (16). ACOT12 regulates cellular acetyl-CoA levels and histone acetylation in promoting epithelial-mesenchymal transition and metastasis in hepatocellular carcinoma (17). ACOT13 and ACOT15 were also reported to regulates hepatic lipid metabolism (18,19). ACOT1 expression is associated with poor prognosis in gastric adenocarcinoma (20). However, there are over 15 ACOT enzymes in humans, and these enzymes exhibit different tissue distribution, subcellular location and substrate specificity (21). The functions of other ACOT members and the regulatory mechanism remained largely unknown.
Previous study has showed that high expression of ACOT11 and ACOT13 in patients with LUAD was associated with cell proliferation and poor prognosis (22,23). These findings indicated that it ACOT11 might play an important role in lung cancer, especially those with poor prognosis. However, the cellular functions and the regulatory mechanism of ACOT11 remains largely unknown. The studies on this direction could improve our understanding about the mechanism of poor prognosis lung cancer and might inspire the clinical research.
In this study, the ACOT11 cellular function and the regulatory mechanism in lung cancer were demonstrated for the first time both in vitro and in vivo. We chose Female BALB/c nude mice as in vivo model as they are the most commonly accepted model to study tumor growth. Remarkably, we employed transcriptional profiling to investigate the regulatory mechanism of ACOT11 in lung cancer and found 214 up-regulated genes and 397 down-regulated genes induced by ACOT11 knockdown. These genes provide a comprehensive image of how ACOT11 might work in lung cancer, indicating that ACOT11 was involved in a complicated network. To further confirm this result, immunoprecipitation–mass spectrometry was performed to reveal the interactome of ACOT11 and 573 proteins were proved to interact with ACOT11. This result provides a valuable resource to study the downstream mechanism of ACOT11 in lung cancer.
We present the following article in accordance with the ARRIVE Reporting Checklist (available at http://dx.doi.org/10.21037/tlcr-19-509).
Methods
Cell culture
Both lung carcinoma cell line A549 and NCI-H1975 were obtained from the Cell Bank of the Chinese Academy of Sciences (Shanghai, China). Prior to this study, multiple cell lines were tested for the ACOT11 mRNA levels. A moderate expression was found in A549 and NCI-H1975 cell lines, which were suitable for both gene silencing and overexpression in the future experiments, so we chose A549 and NCI-H1975 cell lines in this study. Both cell lines were cultured at 37 °C in Dulbecco’s modified Eagle’s medium (DMEM, Thermo Fisher Scientific) containing 10% fetal bovine serum (Thermo Fisher Scientific), 100 units/mL penicillin and 100 mg/mL streptomycin (Hyclone, Logan, UT, USA) in a humidified atmosphere of 5% CO2.
Lentiviral transduction
ACOT11 gene expression in A549 cell lines were down-regulated by using the lentiviral vectors carrying three shRNAs of ACOT11 or CSE1L gene to infect cells (Shanghai GeneChem, Shanghai, China). The vector also encoded enhanced green fluorescent protein (EGFP) under control of the CMV promoter. In reference to the manufacturer, lentivirus was added to cultured cells at a multiplicity of infection (MOI) of 10. Cells were transduced for 72 h before treated with Puromycin at 2.5 µg/mL to select transductants. After treated with Puromycin for 48 h, the cells were observed with microscope (Olympus IX71).
TCGA database
The expression profiles of Acot11 as well as clinical information of LUAD and lung squamous carcinoma (LUSC) samples were obtained from TCGA database, including 576 LUAD patients and 552 LUSC TCGA samples. The K-means clustering analysis (K=2) was carried out to categorize the patients into two groups based on expressions of ACOT11. The log-rank test and Kaplan-Meier curve were employed to evaluate the statistical significance and prognosis of the two groups.
Microarray analysis
We performed microarray assays to identify the ACOT11 downstream pathways regulating NSCLC in A549 cells. First, we generated ACOT11 knockdown stable cell line by transducing A549 cells with lentivirus encoding anti-ACOT11 shRNA (n=3). The ACOT11 shRNA target Sequence was TTGTCTATGCAGACACCAT. Virus without anti-ACOT11 served as the negative control. Total RNA were extracted from ACOT11 knockdown and control stable cell lines (Three wells and three chips for each group) with Trizol reagent (Thermo Fisher Scientific, Grand Island, NY, USA). We then synthesized, labeled and hybridized the complementary DNA to the human GeneChip Primeview array (Affymetrix, Santa Clara, CA, USA) and employed the GeneChip Scanner 3000 to conduct scanning as well as GeneChip GCOS 1.4 software (Affymetrix) to analyze the data. These assays were performed by Shanghai GeneChem (Shanghai, China). Microarray data were available in the NCBI Gene Expression Omnibus public database (http://www.ncbi.nlm.nih.gov/geo/).
High-content screening and cell growth curve analysis
Both A549 and NCI-H1975 cell lines were transfected with anti-ACOT11 or NC lentivirus and seeded into 96-well plates at the density of 1,000 cells per well in 100 µL medium. Three repetitions were performed for each group. GFP expression was observed every day for 5 days to monitor cell growth. The Celigo Imaging Cytometer (Nexcelom Bioscience) was employed to collect and analyze the images. Cells on the images were counted with image analysis software. The cell number at each time point were compare with that on day 1 to generate a cell proliferation rate. The cell growth curve was produced with the fold change in proliferation.
Quantitative real-time PCR
Total RNA was extracted from the A549 cells using Trizol reagent (Thermo Fisher Scientific, Grand Island, NY, USA). Reverse transcription was performed using the M-MLV Reverse Transcriptase (Promega). The resulting cDNA was used to examine levels of mRNAs encoding PDPK1, AKT3, TNFAIP3, ATF3, VEGFB, PPARGC1A, FAS, SKP2, BIRC3, WASL, CDC42, KRAS, SOCS2, FBXW7, JUN, CDKN1C, MAP4K4, TPM1, RASA1, IRF1, BMP2, E2F1, MKI67, FOSL1, SOD2, RAPGEF1, CARM1, PRKACA, GRIP1, TRIB1. GAPDH was used as an internal control. Primer sequences are shown in Table 1. The real-time PCR was performed on LightCycler 480II system (Roche). The conditions were as follows: pre-denaturation (95 °C for 30 s), denaturation (95 °C for 5 s), annealing and extension (60 °C for 60 s) for a total 40 cycles. mRNA levels are presented as: 2−ΔΔCT (with CT being the cycle threshold), where ΔCT = [CT (target gene) − CT (GAPDH)].
Table 1. Primers for real-time PCR.
| Target | Primer 5’ | Primer 3’ |
|---|---|---|
| PDPK1 | GGAACAGCGCAGTACGTTTCT | CTCGTTTCCAGCTCGGAATGG |
| AKT3 | AATGGACAGAAGCTATCCAGGC | TGATGGGTTGTAGAGGCATCC |
| TNFAIP3 | CCACGATGCTCAGGTTTG | TCCCTTTCTCAGCCAAGAC |
| ATF3 | GCTAAGCAGTCGTGGTATG | CTGGAGTTGAGGCAAAGAT |
| VEGFB | CAGGGATAGCCCAGTCAATA | ACAAGCAAGGTCACTCAGTAGAT |
| PPARGC1A | TCTGAGTCTGTATGGAGTGACAT | CCAAGTCGTTCACATCTAGTTCA |
| FAS | ACACTCACCAGCAACACCAA | CTTCCTTTCTCTTCACCCAAACA |
| SKP2 | TGTTTGTAAGAGGTGGTATCG | ACAGTATGCCGTGGAGGG |
| BIRC3 | TTTCCGTGGCTCTTATTCAAACT | GCACAGTGGTAGGAACTTCTCAT |
| WASL | GAACGAGTCCCTCTTCACTTTC | GTTCCGATCTGCTGCATATAACT |
| CDC42 | CTTTCTTGCTTGTTGGGACT | TAGGCTTCTGTTTGTTCTTGG |
| KRAS | AGTTGGAGCTGGTGGCGTAG | CCTCATGTACTGGTCCCTCATT |
| SOCS2 | AGCTGGACCAACTAATCTTCG | GTCCGCTTATCCTTGCACATC |
| FBXW7 | TTAGTGGGACATACAGGTGGA | GAGAACCGCTAACAACTCTTTT |
| JUN | ATGGTCAGGTTATACTCCTCCTC | CACATGCCACTTGATACAATCC |
| CDKN1C | GTCCGGGCCTCTGATCTCC | ATCGCCCGACGACTTCTCA |
| MAP4K4 | CGGAGATTCGTAAATACAAGA | CTTCGGTTGATAAGAGGATAGA |
| TPM1 | GAGAAGGCAGCAGATGAGA | AATGATGACCAGCTTACGG |
| RASA1 | GTCCAACGCCAAACAATCAGT | AGATTTCCTTGCCATCCACTG |
| IRF1 | GATGCTTCCACCTCTCACC | TGCTCCACCTCCAAGTCC |
| BMP2 | CATGCCATTGTTCAGACG | TGTACTAGCGACACCCACA |
| E2F1 | AGGCCCTCGACTACCACT | CCAAGCCCTGTCAGAAAT |
| MKI67 | GGAACAGCCTCAACCATCAG | CCACTCTTTCTCCCTCCTCTC |
| FOSL1 | ACCCTCCCTAACTCCTTTCA | CTGGAGTTGGATGTGGGATA |
| SOD2 | TGGACAAACCTCAGCCCT | TGAAACCAAGCCAACCC |
| RAPGEF1 | AGTGCCCTGCGCTACTTTAAG | GGCTTTGGTACACTCGGCTAT |
| CARM1 | TCGCCACACCCAACGATTT | GTACTGCACGGCAGAAGACT |
| PRKACA | AGCCCACTTGGATCAGTTTGA | GTTCCCGGTCTCCTTGTGT |
| GRIP1 | TTTTCCGAACAGTGGAGGTCA | CTGTCACCGGGTTTGATCGT |
| TRIB1 | TTGGGGACATGCACTCCTATG | GGCGGAGACAATCTGCTTGA |
| GAPDH | TGACTTCAACAGCGACACCCA | CACCCTGTTGCTGTAGCCAAA |
Western blot analysis
Protein was extracted using 2× lysis buffer (100 mM Tris-HCl, 2% mercaptoethanol, 4% SDS, 20% glycerinum) and sonication on ice for 10–15 min. The extracted protein was separated by SDS-PAGE, transferred onto a PVDF membrane (Meck Millipore, Billerica, MA, USA.), and blocked with blocking buffer (5% skim milk in TBST). The PVDF membranes were incubated overnight at 4 °C or 2 h at room temperature with a primary antibody. Membranes were washed 8 min × 4 times and incubated with a horseradish peroxidase-conjugated secondary antibody. The blots were visualized using Pierce™ ECL Western Blotting Substrate Kit (Thermo Fisher Scientific).
Co-immunoprecipitation
Co-IP was employed to examine interaction between ACOT11 and its potential partner in regulating lung carcinoma. 3X Flag-ACOT11 was overexpressed in A549 cells. We used flag antibody to do the immunoprecipitation and detected the following proteins with Western blot: CAMK2D, AHCY, EZR, RHEB, SMAD3, SQSTM1, ATP2A2, CTNNB1, CSE1L. Cells were treated with Co-IP Lysates (Beyotime Biotechology Co., Shanghai, China) and processed with ANTI-FLAG® M2 Affinity Gel (Merck Millipore) according to the manufacturer’s instructions. Samples were then analyzed by Western blotting. Sources of all antibodies employed are listed as following: Mouse anti-flag (1:1,000, Sigma), Rabbit anti-CSE1L (1:1,000, Abcam), Rabbit anti AHCY (1:1,000, Abcam), Rabbit anti-EZR (1:1,000, Abcam), Rabbit anti-RHEB (1:1,000, Abcam), Rabbit anti-SMAD3 (1:1,000, Abcam), Rabbit anti SQSTM1 (1:1,000, CST), Rabbit anti ATP2A2 (1:1,000, Abcam), Rabbit anti CTNNB1 (1:1,000, CST), Rabbit anti CSE1L (1:1,000, Abcam).
Tissue microarray and survival analysis
Tissue microarray (TMA) slides contained 45 pairs of Non-small lung cancer tissue samples and were hybridized with primary antibody against ACOT11 (1:50; Rabbit anti Human, SIGMA). The clinical information are shown at http://cdn.amegroups.cn/static/application/3ad9a80f3c8e6099d5d0deef37e50bb7/TLCR-19-509-TableS1.xlsx. The human lung specimens including normal, tumor and adjacent normal tissues were bought from superchip (Shanghai Outdo Biotech Co. Ltd). The distance between adjacent normal and cancer tissue boundary is about 1cm, while that of distant normal tissue and cancer tissue is about 10 cm. Images were captured with microscope (Caikon, Shanghai, China) and processed using Nano Zoomer Digital Pathology View 1.6 software. We determined the Immunohistochemical score by two independently experienced pathologists blinded to the clinical and pathological data. The expression levels of ACOT11 was assessed for significance using student t-test. Mann-Whitney U analysis was used to analysis the clinical features of patients (shown in Table 2).
Table 2. Clinical features of lung cancer patients.
| Characteristics | ACOT11 levels | Total | P value | |
|---|---|---|---|---|
| Low | High | |||
| Gender | 56 | 83 | 139 | 0.242 |
| Male | 38 | 45 | 83 | |
| Female | 18 | 38 | 56 | |
| Age | 56 | 84 | 140 | 0.818 |
| ≤60 | 30 | 45 | 75 | |
| <60 | 26 | 39 | 65 | |
| Clinical stage | 55 | 83 | 138 | 0.832 |
| I/II | 38 | 46 | 84 | |
| III/IV | 17 | 37 | 54 | |
| Grade | 54 | 83 | 137 | 0.433 |
| NA | 4 | 1 | 5 | |
| 1/2 | 34 | 56 | 90 | |
| 3 | 16 | 26 | 42 | |
| TNM stage | 56 | 83 | 139 | 0.543 |
| 1/2 | 45 | 63 | 108 | |
| 3/4 | 11 | 20 | 31 | |
Colony formation assay
A549 and NCI-H1975 cell lines were employed to do cell survival analysis. Three independent experiments were performed. Anti-ACOT11 shRNA transduced cells were seeded into 6-well plates (A549 cell line: 700 cells/well; NCI-H1975 cell line: 400 cells/well) and incubated in humidified air containing 5% CO2 at 37 °C for 14 days to allow colony formation. Medium was replaced every 3 days. Virus without anti-ACOT11 served as the negative control. Cells were fixed with 4% paraformaldehyde for 30–60 min and stained with GIEMSA. After staining, images were captured with microscope (IX71, Olympus, Japan) and colony numbers were counted. Data were normalized to results for control cells.
Cell cycle analysis
Cells were cultured in 6-cm dishes and were harvested when grown to 80% confluence. Cells were washed with ice-cold D-Hanks buffer and fixed with 70% ethanol at 4 °C for 1 h. The cells were washed with ice-cold D-Hanks buffer one more time and stained with PI/RNase Staining Solution (Thermo Fisher Scientific). DNA data was analyzed by fluorescence-activated cell sorting (Guava easyCyte HT, Merck Millipore, Billerica, MA, USA).
Apoptosis analysis
The cells were washed with ice-cold D-Hanks buffer followed by binding buffer and processed with Annexin V-APC Apoptosis Detection Kit (eBioscience). The percentage of apoptosis was analyzed by fluorescence-activated cell sorting (Guava easyCyte HT, Merck Millipore, Billerica, MA, USA).
In vivo experiments
All procedures involving animals and their care was approved and performed by the Committee of China-Japan Friendship Hospital. In the whole project, animal care and experiments were performed strictly abidance by the “Guide for the Care and Use of Laboratory Animals” and the “Principles for the Utilization and Care of Vertebrate Animals”. Female BALB/c nude mice (4 weeks, 16–23 g) used in this study were bought from Shanghai Lingchang Biotech Co. Ltd (Shanghai, China) and maintained in home cages in a specific pathogen-free facility in our laboratory. Animals were randomly divided into two groups: negative control group (NC) and knockdown group (KD). The dark/light cycle were maintained at 12 h/12 h. A549 cells (1×10⁷) in 200 µL PBS were injected subcutaneously into the right flank of nude mice (at 1–2 P.M., n=10 for each group). Starting on day 15 after the first injection, tumor growth was monitored two to three times (every week for 19 days). Tumor volume (mm3) equaled (π/6) (L × W2), where L and W refer to the longest longitudinal and transverse diameters, respectively. Before mice were sacrificed for tissue collection, tumor images were obtained (at 10–11 A.M.) with an IVIS Spectrum whole live-animal imaging system (PerkinElmer, Waltham, MA, USA). Animals were sacrificed after 34 days of injection, the isoflurane was used to anesthetize the animals by the gas anesthesia system followed by the manufacture’s protocol (UGO Basile Co. Ltd). The tumors and adjacent normal tissues were collected, and a part of each sample was fixed in formalin, another part of each tumor was chopped and immediately photographed then frozen in liquid nitrogen for further analysis.
Wound healing assay
We employed the scratch motility assay to measure two-dimensional cancer cell movement. Both A549 cell line and NCI-H1975 cell line were used in the assay. A proper number of cells were seeded in 96-well plate in 100 µL medium so that they would reach 90% confluence overnight. A scratch was made on the cell monolayer with a 96-wounding replicator (VP scientific). The floating cells were removed by washing. The culture plate was incubated in a complete medium for 24 h. The images were captured and analyzed by Celigo software (Nexcelom).
Cell migration and invasion assay
The transwell assay was performed to detect cell migration. Both A549 and NCI-H1975 cell lines were used in the assay. Cells were trypsinized and resuspended in medium without serum. 105 NCI-H1975 cells or 5×10⁴ A549 cells in 100 µL medium were gently added to the upper compartment of Transwell (Corning). 600 µL DMEM with 30% FBS was added to the lower compartment of Transwell. The cells were incubated in the culture incubator at 37 °C plus 5% CO2 for 18 h (NCI-H1975 cells) or 24 h (A549 cells). The remained cells on the upper side were removed with cotton balls. The cells were stained with 0.5% crystal violet for 5 min. The images of stained cells on the lower side were obtained under microscope from 4 different randomly selected views under 100× magnification and 9 different randomly selected views under 200× magnification. The cell number averaged from the 200× magnification microscopic views was used as the migration cell number.
Statistical analyses
Statistical analysis was performed using GraphPad Prism (version 8.02; GraphPad Software) and SPSS (version 19.0, SPSS Inc) statistical software (24). The Student’s t-test and paired t-test were used to analyze significance between independent groups and paired materials, respectively. Results of continuous variables were presented as mean ± SD. unless were stated otherwise. Independent sample t-tests were used to compare the treatment groups. P≤0.05 was considered statistically significant. Biochemical experiments were performed in triplicate and a minimum of three independent experiments were evaluated.
Results
High expression of ACOT11 is found in both LUSC and LUAD patients and up-regulation in ACOT11 correlates with poor prognosis in LUSC
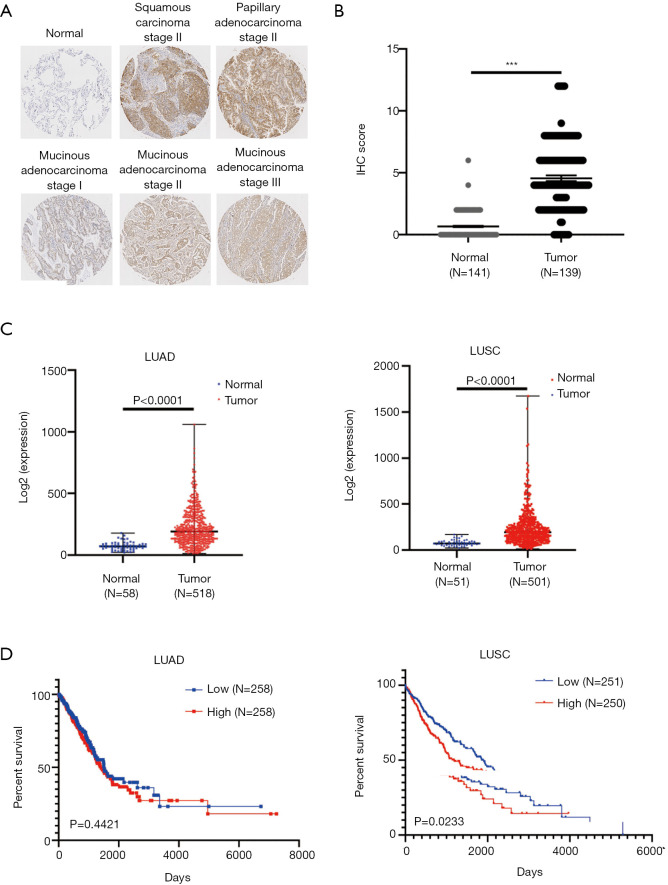
We first measured the expression of ACOT11 in a cohort (45-paired lung cancer vs adjacent noncancerous tissues and 10 normal lung tissues) of human LUAD patients through immunohistochemistry tissue microarray. Results confirmed that ACOT11 was located in tumor cytoplasm, and highly expressed in Squamous Carcinoma and different subtype of adenocarcinoma including papillary and mucinous adenocarcinoma compared with adjacent normal tissue (Figure 1A,B). The clinical features of lung cancer patients were shown in Table 2. We next analyzed the mRNA expression of ACOT11 in The Cancer Genome Atlas (TCGA, http://cancergenome.nih.gov) (25). Data showed the transcriptional level of ACOT11 was higher in both LUAD and lung squamous cell carcinoma tissues than in normal tissues (Figure 1C). Kaplan-Meier analysis showed that the overall survival time of LUSC patients with ACOT11 low or medium expression was longer than those with ACOT11 high expression. While in LUAD patients, ACOT11 showed no prognosis value (Figure 1D). These results suggested that ACOT11 was up-regulated in lung cancer and correlated with poor survival time of lung squamous cell carcinoma patients.
Figure 1.
ACOT11 is highly expressed in lung cancer tissues and correlated with poor prognosis of lung squamous carcinoma (LUSC) patient. (A,B) ACOT11 protein levels in lung cancer tissues vs. adjacent normal tissues were measured using an immunohistochemistry-based tissue microarray. Representative images (A; immunohistochemistry, ×100) of normal, squamous carcinoma, adenocarcinoma with different subtype were shown. ACOT11 protein expression was upregulated in lung cancer tissues compared with normal tissues (B). Statistic analysis was conducted using Student’s t-test. (C) ACOT11 mRNA expression in lung adenocarcinoma (LUAD) and LUSC samples was analyzed utilizing database from The Cancer Genome Atlas (TCGA). (D) Correlation between mRNA expression of ACOT11 and survival of LUAD and LUSC samples was analyzed in Kaplan-Meier plots utilizing LUAD database from TCGA. ***P<0.001.
ACOT11 knock down impairs lung cancer cell growth
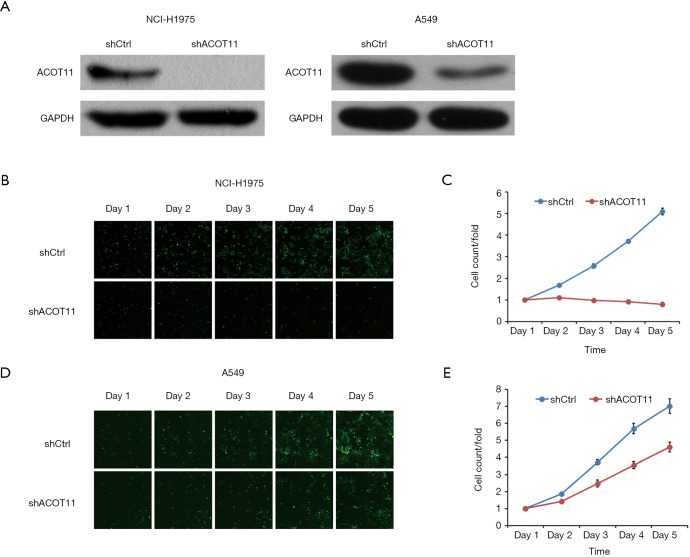
Highly expressed ACOT11 in lung cancer and correlation with poor survival in LUAD patients indicates an oncogenic role of ACOT11 in lung cancer development. To evaluate the function of ACOT11 in lung cancer, lentiviral-based shRNA strategy was employed to knockdown ACOT11 both in lung cancer cell lines A549 and NCI-H1975. Lentivirus expressing shRNA specifically targeting human ACOT11 (shACOT11) or scrambled sequence (shCtrl) were generated initially. Results showed that ACOT11 were efficiently knocked down in NCI-H1975 and A549 cells through Western blot (Figure 2A). As sustained growth is one of the most hallmarks of cancer cells (26), we first investigate the impact of ACOT11 knockdown on cell growth in NCI-H1975 and A549 using high content screening. Results showed that ACOT11 knock down significantly reduced the growing number of NCI-H1975 cells (Figure 2B,C) while a mild inhibiting effect was observed in A549 cells (Figure 2D,E).
Figure 2.
High content screening identifying ACOT11 as an essential gene in promoting lung cancer cell proliferation. (A) Western blotting was performed to determine RNAi efficiency of ACOT11 protein in NCI-H1975 and A549 cell lines 72 h after ACOT11 RNAi lentivirus or control lentivirus was transduced. Using GAPDH as an internal control. ACOT11 was efficiently knocked-down in NCI-1299 and A549 cell lines. (B,C,D,E) High content screening was conducted to measure the effect of ACOT11 knock down on growth of NCI-H1975 (B,C) and A549 (D,E) transduced with GFP-expressing ACOT11 RNAi lentivirus or control lentivirus. Representative images of GFP-expressing cells (successfully transduced cells) was shown in each time point after transduction (B,D), and GFP signaling of transduced cells was normalized to day1 for comparison of growth rate between different groups (C,E). ACOT11 knock down significantly reduced cell growth rate in both NCI-H1975 and A549 lung cancer cell lines. Data are presented as mean ± SD.
ACOT11 knock down affects clone formation and induces cell cycle arrest and apoptosis in lung cancer cells
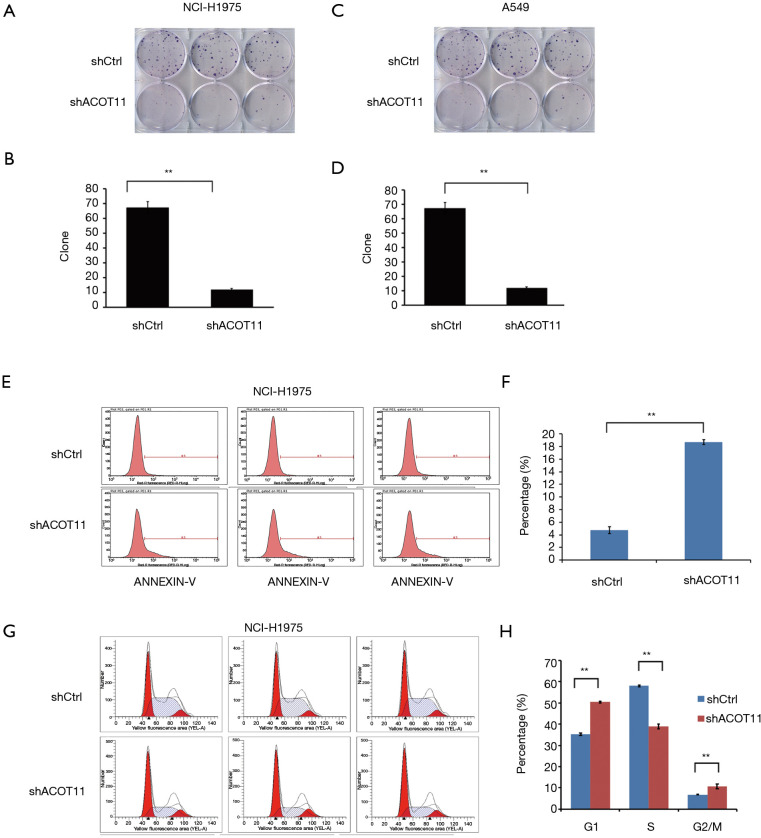
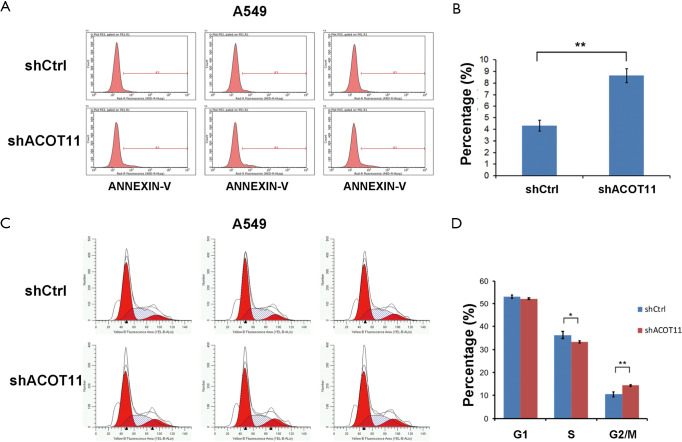
Colony formation ability is dependent on the replicative immortality of cancer cells, which is also one of the hall marks of cancer. So we also investigate if ACOT11 knock down could impair the clonogenic ability of lung cancer cells. Consistently, colony formation was significantly suppressed upon ACOT11 knock down both in NCI-H1975 (Figure 3A,B) and A549 (Figure 3C,D). These results imply an important role of ACOT11 in regulating lung cancer cell proliferation and clonogenicity. Resistance to apoptosis is another hallmark of tumor, as this confers the tumor cells to survive through anoikis and cell contact inhibition induced by rapid expansion. Annexin V-APC assay by flow cytometry were conducted to measure cell apoptosis in NCI-H1975 and A549 with ACOT11 knocked down. Results showed that the proportion of cells under apoptosis was enhanced both in NCI-H1975 (Figure 3E,F) and A549 cells (Figure S1A,B) when ACOT11 was knocked down. Uncontrolled cell cycle and accelerated cell division rates are often observed in cancer initiation progression, which is one of the major mechanisms that leads to accelerated tumor growth. So we next examined if ACOT11 could also regulate cell cycle progression in lung cancer cells. propidium iodide (PI) flow cytometric assay was conducted to evaluate the effect of ACOT11 on cell cycle. We found the proportion of cells in G1 phase was accumulated while that in S phase was reduced after ACOT11 was knocked down in NCI-H1975 (Figure 3G,H), indicating a positive role of ACOT11 in regulating G1 to S transition, which may partly explain the results that knock down of ACOT11 almost completely block cell proliferation in H1975. As a contrast, we did not observe significant changes in cell cycle when ACOT11 was knocked down in A549 cell lines (Figure S1C,D), this is consistent with results that ACOT11 knocked down cause a less inhibition effect on proliferation in A549 than in NCI-H1975 cell, indicating a cell content dependent function of ACOT11 in regulating proliferation in different lung cancer cell lines. These results indicate that the inhibition on lung cancer cell growth with ACOT11 knocked down was caused by induced cell cycle arrest and increased apoptosis.
Figure 3.
ACOT11 knock down inhibit lung cancer cell G1-S transition and induce cell apoptosis in vitro. (A,B,C,D) Colony formation assay was performed to confirm the effect of ACOT11 knock down on cell survival in NCI-H1975 (A,B) and A549 (C,D). Representative images of colony formation for NCI-H1975 (A) and A549 (C) was shown. Colony numbers was calculated in NCI-H1975 (B) and A549 (D) for each group. ACOT11 knock down inhibit colony formation in both NCI-H1975 and A549 lung cancer cell lines. (E,F) Annexin-V-APC labelling and flow cytometry was conducted to measure cell apoptosis in NCI-H1975 (E) after ACOT11 was knocked down. Percentage of cells (F) in apoptosis was quantified. ACOT11 knock down induced cell apoptosis in NCI-H1975. (G,H) PI staining and flow cytometry was performed to evaluate cell cycle in NCI-H1975 (G) after ACOT11 was knocked down. Cell numbers in indicated cell cycle phase was quantified (H). ACOT11 knock down leads to a reduction of cell numbers in S phase and an accumulation of cells in G1 phase in NCI-H1975. Data are presented as mean ± SD. Student’s t-test was conducted to calculate the significance. **P<0.01.
Knock down of ACOT11 inhibited lung cancer cell migration, invasion and epithelial-mesenchymal transition (EMT)
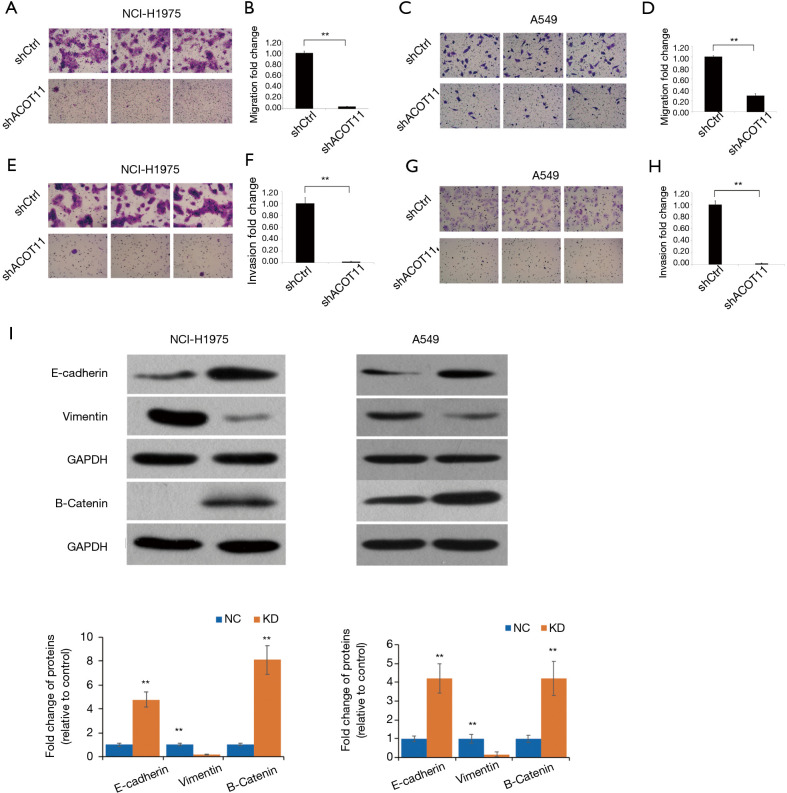
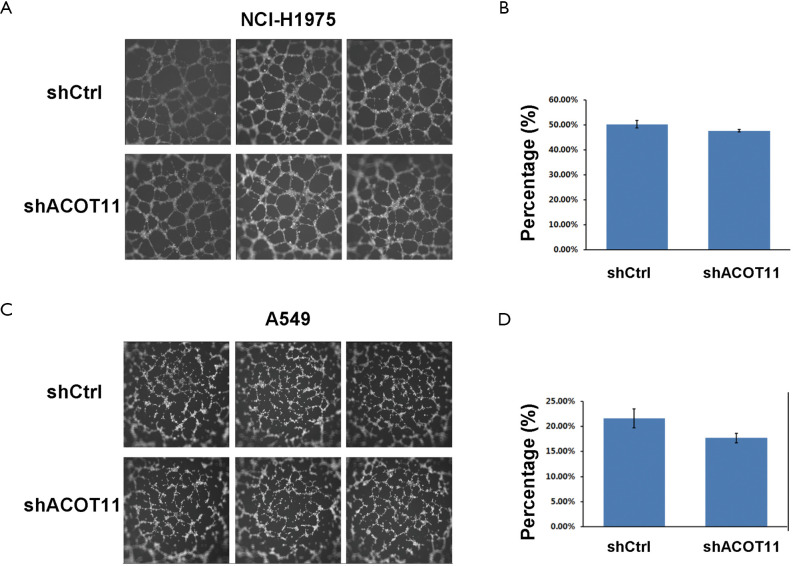
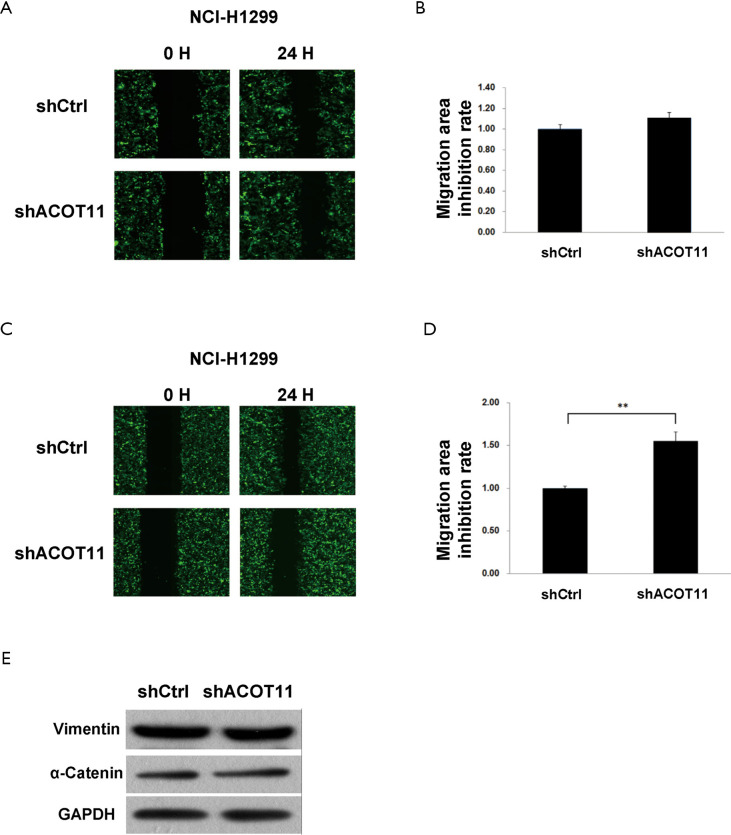
Remote metastasis is one of the main causes of lung cancer death, which requires the cancer cell to obtain migration and invasion ability during cancer progression. As ACOT11 knocked down had a strong effect on inhibiting lung cancer cell growth, we asked if ACOT11 could also regulate tumor cell migration and invasion. Using Transwell migration assay (without adding ECM), we found ACOT11 knock down significantly inhibited migration rate both in NCI-H1975 (Figure 4A,B) and A549 cells (Figure 4C,D), when switching to Transwell invasion assay (adding ECM), the inhibitory effect got more significant in NCI-H1975 (Figure 4E,F) and A549 cells (Figure 4G,H), indicating an important role of ACOT11 on regulating both migration and invasion. Wound healing assay is another classic experiment to measure cell migration and movement ability, but we had not observed inhibitory effect of ACOT11 knock down on both NCI-H1975 (Figure S2A,B) and A549 cells (Figure S2C,D), indicates the inhibition of ACOT11 knock down on migration and invasion may not depend on dampened movement ability. Activated EMT is one of the mechanisms underlying enhanced cell migration and invasion in multiple cancer (27). We found epithelial marker E-cadherin was highly expressed and mesenchymal marker Vimentin was significantly reduced in both A549 and H1299 cells (Figure 4I), when ACOT11 was knocked down, which means EMT was inhibited. These results indicate knock down of ACOT11 could inhibit lung cancer cell migration and invasion through blocking Epithelial–mesenchymal transition. We also measured the effect of ACOT11 knock down on angiogenesis, as it is often activated during cancer progression, but we had not found any difference in NCI-H1975 cells (Figure S3A,B) and A549 (Figure S3C,D,E).
Figure 4.
Knockdown of ACOT11 significantly inhibit cell migration, invasion and epithelial-mesenchymal transition in vitro. (A,B,C,D) The migration of NCI-H1975 (A,B) and A549 (C,D) was measured by the Transwell migration assay after ACOT11 was knocked down. Representative images of NCI-H1975 (A) and A549 (C) was shown. Cell numbers for NCI-H1975 (B) and A549 (D) were quantified respectively. ACOT11 knocked down inhibit cell migration both in NCI-H1975 and A549. (E,F,G,H) The invasion of NCI-H1975 (E,F) and A549 (G,H) was determined through the Transwell invasion assay after ACOT11 was knocked down. Representative images of NCI-H1975 (E) and A549 (G) was shown. Cell numbers for NCI-H1975 (F) and A549 (H) were quantified respectively. ACOT11 knocked down inhibit cell invasion both in NCI-H1975 and A549. (I) The expression level of EMT marker E-cadherin and vimentin was measured through western blot in NCI-H1975 and A549 cells after ACOT11 was knocked down. ACOT11 knock down increased epithelial cell marker E-cadherin expression and reduced mesenchymal cell marker Vimentin expression. Staining method for (A,C,E,G): 0.5% crystal violet; magnification, ×200. Data are presented as mean ± SD. Student’s t-test was conducted to **P<0.01.
Knock down of ACOT11 inhibited tumor growth in lung cancer xenograft model
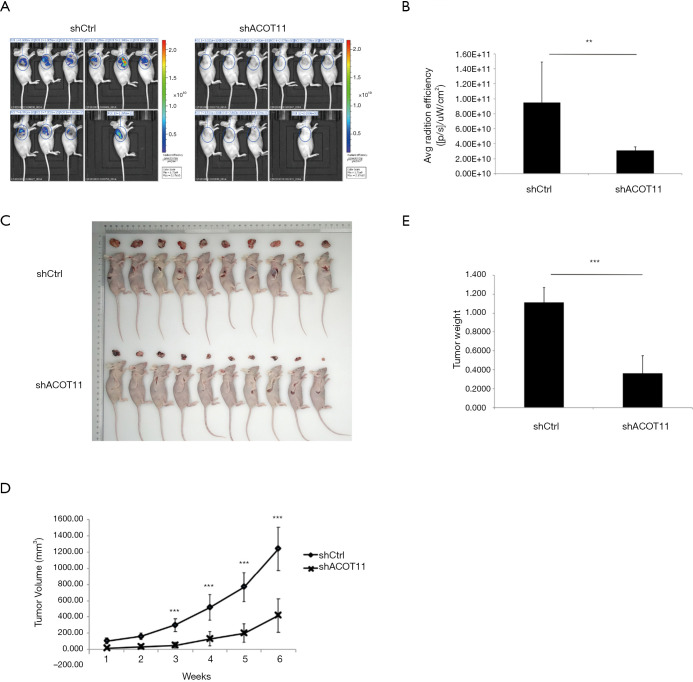
To further determine whether ACOT11 promote lung cancer cell tumorigenicity in vivo, we generated a lung cancer mouse xenograft model by subcutaneously injecting A549 cells into the flank of nude mice. By the end of the in vivo experiment, all animals were healthy. All animals were taken into analysis (n=10 for each group). As the lentivirus expressing ACOT11 shRNA or control shRNA were loaded with GFP element, which means the transfected lung cancer cells in tumors could be imaged with GFP signaling, so we measured the GFP signaling on the tumor area before the mice were sacrificed. Consistently with the tumor volume collecting data, the GFP signaling was significantly reduced in shACOT11 group (Figure 5A,B), the volumes and weight of ACOT11-deficient xenograft tumors were significantly lesser than those of the control tumors (Figure 5C,D,E). indicating transfected lung cancer cells was diminished in xenograft. These results imply that ACOT11 maybe indispensable in tumor formation.
Figure 5.
ACOT11 knock down inhibit tumor growth in vivo. In vivo tumorgenicity was measured by subcutaneously injecting GFP-expressing ACOT11 RNAi lentivirus or control lentivirus transfected A549 into nude mice, n=10. Luciferase fluorescence signaling of xenografts was imaged (A) before mice were sacrificed and the signal intensity within the interested region was quantified (B). Gross pictures of Tumors and corresponding mice was shown (C). Tumor size were monitored (D) at indicated time and tumor weight (E) were measured after mice was sacrificed. Data are presented as mean ± SD. Student t-test was conducted to **P<0.01; ***P<0.001.
Expression profile of genes regulated by ACOT11 in lung cancer
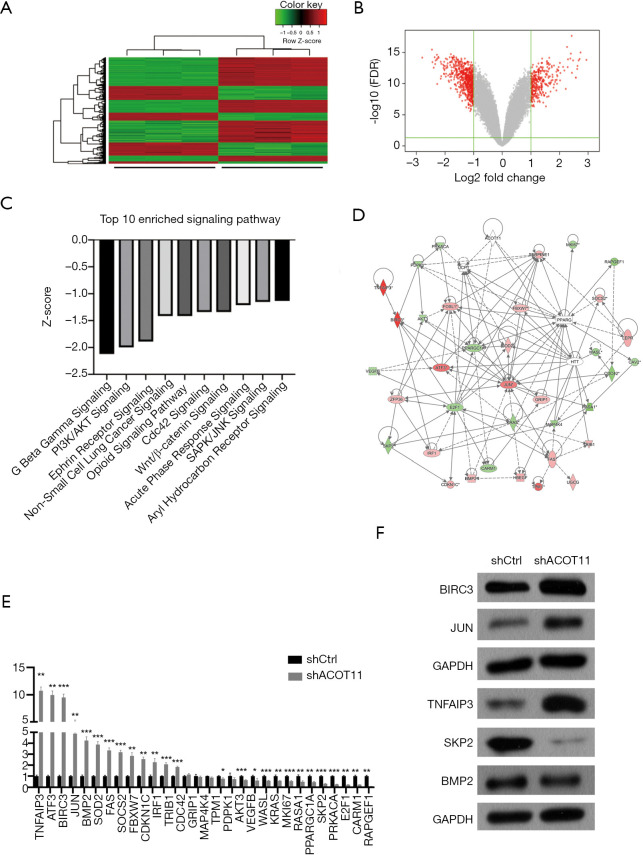
Since ACOT11 has a strong role in regulating both tumor proliferation and invasion, we next investigate the signaling mechanisms underlying it. cDNA microarray assay was conducted to identify the transcriptional profiling downstream of ACOT11 in A549 cells. In total, 611 genes were differentially expressed [false discovery rate (FDR) <0.05 and absolute fold change (FC Absolute) >2] after ACOT11 was knocked down (http://cdn.amegroups.cn/static/application/36f22769865ddea37e2878034b3deee4/TLCR-19-509-TableS2.xlsx). Of the differentially regulated genes, 214 were upregulated and 397 were downregulated (Figure 6A,B). Signaling pathway enrichment analysis revealed the TOP 10 most potentially suppressed signaling, which were ranked by the Z-score in Ingenuity Pathway Analysis (IPA). These enriched pathways including Wnt/β-catenin signaling, PI3K/AKT signaling, CDC42 signaling and SAPK/JNK signaling, etc., which were related with cancer progression as previously reported (Figure 6C). To further investigate the related regulatory network of ACOT11-induced malignancy, we analyzed the knowledge-based interactome and constructed a network map (Figure 6D) including ACOT11 and differentially expressed genes enriched in the TOP10 signaling pathway above. Multiple genes, including JUN, SKP2, TNFAIP3, that have been previously reported to be involved in tumorigenesis were confirmed differentially regulated with ACOT11 knock down by qPCR and Western blot (Figure 6E,F), indicating ACOT11 could regulate cancer proliferation and invasion through multiple signaling axis.
Figure 6.
Gene expression profiling identifies transcriptional targets downstream of ACOT11. (A,B) Transcriptome profiling through microarray assay identified differentially expressed genes (DEGs) in A549 cells transduced with ACOT11 RNAi lentivirus or blank lentivirus. DEGs was shown in a hierarchical clustering plot (A) and a volcano plot (B). Genes with absolute fold change >2.0 and FDR <0.05 were defined as DEGs. (C) Ingenuity Pathway Analysis (QIAGEN, USA) was conducted to determine the enriched signaling pathways with all DEGs. The Top 10 enriched Pathways with Z-score <0 was listed. Pathways with Z-score <0 was considered to be inhibited due to the integrative negative regulating effect performed by the DEGs involved. (D,E,F) Gene interaction network analysis (D) was performed using DEGs manually selected from the top 10 enriched pathways, and mRNA expression of the DEGs were confirmed by qPCR (E), among which BIRC3, JUN, TNFAIP3, SKP2, BMP2 protein expression (F) were further measure through Western blot. *P<0.05; **P<0.01; ***P<0.001.
Immunoprecipitation-mass spectrometry reveals ACOT11 interacting with CSE1L in lung cancer
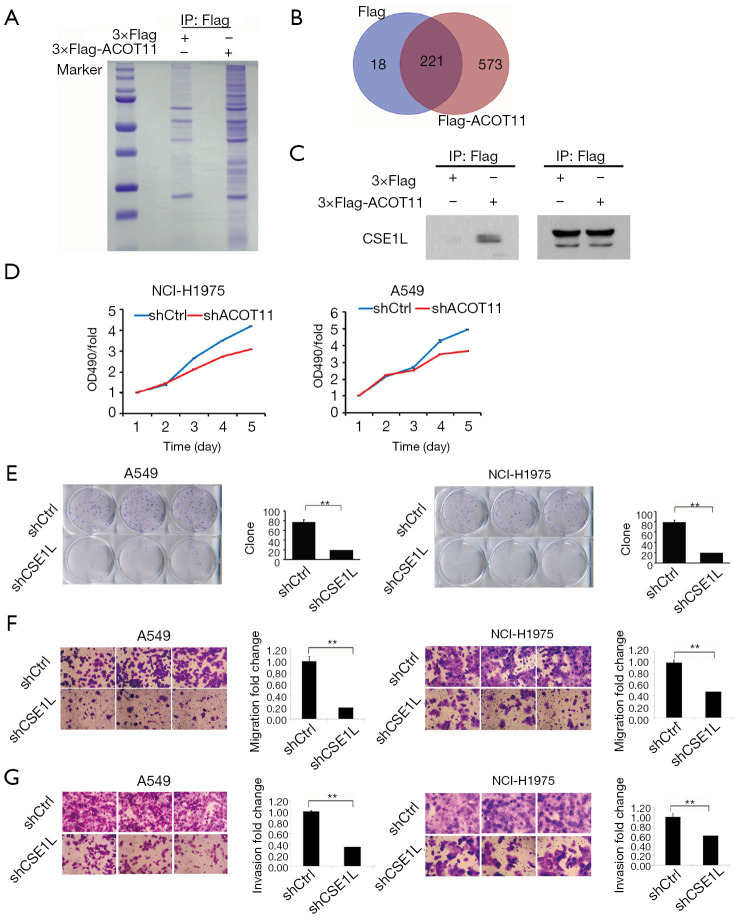
To further gain insight into the detailed molecular mechanistic basis of the tumour promotion effect of ACOT11 in lung cancer, we sought to identify its interacting partners by Co-IP followed by mass spectrometry. We found ACOT11 could interact with 573 proteins (http://cdn.amegroups.cn/static/application/82d275e928471984427a30cfcd6fa209/TLCR-19-509-TableS3.xlsx; http://cdn.amegroups.cn/static/application/c4882867ac9c15d6ddab7e65cdf9197a/TLCR-19-509-TableS4.xlsx) by comparing the anti-Flag IP product of A549 cells overexpressing ACOT11-Flag with A549 cells transfected with blank vector (Figure 7A,B). Among these interacted proteins, tumor proliferation and invasion related proteins were manually selected to further confirm their interaction with ACOT11 through CO-IP and western blot, including CAMK2D, AHCY, EZR, RHEB, SMAD3, SQSTM1, ATP2A2, CTNNB1, CSE1L. Finally, as shown in Figure 7C, we found CSE1L was validated to interact with ACOT11. Chromosome segregation 1 like (CSE1L) is an oncogene in multiple tumors such as female reproductive endometrioid cancer and colorectal cancer. Among its related pathways are p53 pathway and Cell cycle_Spindle assembly and chromosome separation. However, as far as we know, the function of CSE1L in lung cancer has not been reported. Thus, we did the following experiments to validate the functions of CSE1L in A549 cells and NCI-H1975 cells, including cell proliferation assay (Figure 7D), colony formation assay (Figure 7E), cell migration assay (Figure 7F) and invasion assay (Figure 7G). The results proved that CSE1L promotes the cell proliferation, migration and invasion in both A549 and NCI-H1975 cells, indicating that ACOT11 could regulate tumor proliferation and invasion through binding with CSE1L.
Figure 7.
Shot-gun proteomics reveals interactions between ACOT11 and multiple tumor proliferation-associated proteins. (A) Stable cell line was established by transfection of Flag-ACOT11 expressing lentivirus or flag-empty lentivirus into A549 cells followed by puromycin selection. Cell lysates were then precipitated with anti-Flag antibody and pellets were separated through SDS-PAGE followed with Coomassie brilliant blue (CBB) staining and shotgun mass spectrometry. (B) Venn diagrams showing ACOT11 specific and non-specific binding protein number. (C) Immunoprecipitation and western bolt were conducted to confirm the interactions between ACOT11 and CSE1L from ACOT11 interactome in A549 cells. (D) CSE1L knock down significantly reduced cell growth rate in both NCI-H1975 and A549 lung cancer cell lines. (E) Colony formation assay was performed to confirm the effect of CSE1L knock down on cell survival in NCI-H1975 and A549 (GIEMSA, ×2). Representative images of colony formation for NCI-H1975 and A549 was shown. Colony numbers was calculated in NCI-H1975 and A549 for each group. CSE1L knock down inhibit colony formation in both NCI-H1975 and A549 lung cancer cell lines. (F) The migration of NCI-H1975 and A549 was measured by the Transwell migration assay after CSE1L was knocked down. Representative images of NCI-H1975 and A549 was shown. Cell numbers for NCI-H1975 and A549 were quantified respectively. CSE1L knocked down inhibit cell migration both in NCI-H1975 and A549. (G) The invasion of NCI-H1975 and A549 was determined through the Transwell invasion assay after CSE1L was knocked down. Representative images of NCI-H1975 and A549 was shown. Cell numbers for NCI-H1975 and A549 were quantified respectively. CSE1L knocked down inhibit cell invasion both in NCI-H1975 and A549. (F,G) 0.5% crystal violet, ×200. Data are presented as mean ± SD. Student t-test was conducted to calculate the significance. **P<0.01.
Discussion
In this study, we first demonstrated the ACOT11 functions in lung cancer both in vitro and in vivo. ACOT11 knockdown could suppress cell growth, cell migration and invasion, as well as apoptosis in vitro. Consistent with these findings, in vivo study showed that ACOT11 knockdown significantly reduced tumor size and weight using xenograft model. For the first time, these findings clearly demonstrated the importance of ACOT11 in lung cancer and provide evidences showing that ACOT11 knockdown could suppress tumor cell growth and migration. Since ACOT11 was reported to be associated with poor prognosis (22), which was now a difficult issue in clinical treatment, ACOT11 provide a potential therapy target in the future, especially for lung cancer with poor prognosis.
To understand the regulatory mechanism of ACOT11, we investigated the downstream pathways of ACOT11 with transcriptional profiling. ACOT11 knockdown significantly up-regulated 214 genes expression and down-regulated 397 genes expression. The immunoprecipitation–mass spectrometry showed that ACOT11 could interact with 573 proteins. These proteins were enriched in multiple cancer signaling pathway including Wnt/β-catenin signaling, PI3K/AKT signaling, CDC42 signaling and SAPK/JNK signaling etc. This is a database of great value for ACOT 11 study in the future and would definitely contribute to the mechanism study of lung cancer. Among these proteins, we further selected CAMK2D, AHCY, EZR, RHEB, SMAD3, SQSTM1, ATP2A2, CTNNB1, CSE1L to confirm the interaction with ACOT11 by co-immunoprecipitation. These proteins were reported to play a role in regulating tumor proliferation and invasion, further investigation is needed to distinguish which signaling axis may be responsible for the positive regulation of ACOT11 on multiple tumor hallmarks. Finally, we proved that ACOT11 could bind with CSE1L in A549 cells. Considering the potential roles of CSE1L in cancer, we speculate that CSE1L plays an important role in the ACOT11 mediated cell signaling.
However, the regulatory mechanism behind the ACOT11 functions is still not well established. ACOT11 and ACOT12 are both belong to the type II ACOT family and they share 51 per cent sequence identity and both enzymes contain a C-terminal steroidogenic acute regulatory protein (StAR)-related lipid transfer (START) domain (28,29), indicating these two enzymes might share the same regulatory mechanism. ACOT12 regulates cellular acetyl-CoA levels and histone acetylation in promoting epithelial-mesenchymal transition and metastasis in hepatocellular carcinoma (17). This might be the regulatory mechanism of the ACOT11 function in the lung cancer.
Another possibility of the regulatory mechanism is that ACOT11 might function to promote energy expenditure in cancer. ACOT11 was initially named brown fat inducible thioesterase because it is highly enriched in brown adipose tissue. It was also significantly upregulated when mice were exposed to cold ambient temperatures (30). It was also reported that ACOT11−/− mice exhibited increased energy expenditure and were resistant to diet-induced obesity, as well as associated metabolic disorders (31). It is well demonstrated that in cancer cells, metabolic reprogramming is a very important process to accommodate their biosynthetic needs and proliferation (32,33). However, our finding is that the ACOT11 knockdown could induce the tumor size significant reduction in vivo. It is not consistent with the reported phenomenon that the ACOT11−/− mice exhibited increased energy expenditure. These findings indicating that the ACOT11 functions are very complicated. Is it possible that there is a compensatory mechanism of ACOT11? These questions need further investigation. Our study definitely showed a path on the compensatory mechanism study.
To further explore the intracellular mechanism of ACOT11 in the progression in lung cancer. Immunoprecipitation was carried out to find the potential proteins that could bind to ACOT11. Among which, we found CSE1L (also named as XPO2). CSE1L is a Protein Coding gene which was closely related to the progression of colorectal cancer. Similarly, in this study, we found ACOT11 or CSE1L knockdown could inhibit the proliferation, promote cellular apoptosis and inhibit cell invasion and migration. Furthermore, previous report has proved the roles of CSE1L in controlling cellular EMT in primary human mammary epithelial cells, and CSE1L was proved to be a potential target for reversing epithelial to mesenchymal transition. Thus, in this study we speculate that CSE1L might be a bridge between ACOT11 and cellular EMT regulation network.
After all, we confirmed that ACOT11 is upregulated in both LUAD and squamous cell carcinoma with tissue microarray test. We next reported that ACOT11 could suppress lung tumor cell growth, cell migration and invasion by potentially interacting with CSE1L, indicating ACOT11 might be a potential therapy target in the future clinical treatment. We provide a database of 214 up-regulated genes and 397 down-regulated genes induced by ACOT11 knockdown, which are of great value for the ACOT11 downstream pathways mechanism study in the future. Our study revealed ACOT11 as a potential therapy target of lung cancer and provide a database of great value for its regulatory mechanism study.
Conclusions
The results revealed that ACOT11 regulates proliferation, migration and invasion of lung cancer carcinoma via multiple signaling pathways, potentially by binding with CSE1L. The novel findings identified new roles played by ACOT11 in the progression of LUAD and LUSC, indicating its potential therapeutic target in the treatment of lung cancer.
Supplementary
The article’s supplementary files as
Figure S1.
ACOT11 knock down induced apoptosis and cell cycle dysregulation in A549 cells. (A,B) Annexin-V-APC labelling and flow cytometry was conducted to measure cell apoptosis in A549 after ACOT11 was knock down. percentage of cells in apoptosis was quantified. (C,D) PI staining and flow cytometry was performed to evaluate cell cycle in A549 after ACOT11 was knock down. Cell numbers in indicated cell cycle phase was quantified. Data are presented as mean ± SD. Student’s t-test was conducted to *P<0.05; **P<0.01.
Figure S2.
The effect of ACOT11 knock down on lung cancer cell migration through wound healing assay. The migration of NCI-H1975 (A,B) and A549 (C,D) was measured by the wound healing assay after ACOT11 was knocked down. Representative images of NCI-H1975 (A) and A549 (C) was shown (×100). The migration area inhibition rate was calculated for NCI-H1975 (B) and A549 (D) respectively. data are presented as mean ± SD.
Figure S3.
The effect of ACOT11 knock down on angiogenesis. The angiogenesis of HUVEC cultured with medium from NCI-H1975 (A,B) and A549 (C,D) was measured. NCI-H1975 and A549 were transfected with ACOT11 shRNA lentivirus or Control lentivirus before the medium was transferred to culture with HUVEC. Representative images and quantified total tube area of HUVECs cultured with medium from NCI-H1975 (A,B) and A549 (C,D) was shown (×200 for A,C). Angiogenesis related proteins in A549 cells are tested by Western blot (E). Data are presented as mean ± SD. Student’s t-test was conducted to **P<0.01.
Acknowledgments
Funding: The present study was supported by the Project of Disciplines Construction of State Key Clinical Department [grant (2011)873].
Ethical Statement: The authors are accountable for all aspects of the work in ensuring that questions related to the accuracy or integrity of any part of the work are appropriately investigated and resolved. Animal care and experiments were performed in accordance with the guidelines of the Institutional Animal Committee of Peking University China-Japan Friendship School of Clinical Medicine, and the procedure was approved by the Institutional Animal Care and Use Committee. Furthermore, we would like to make a statement that the study was performed in accordance with the 1964 Declaration of Helsinki. Patients were informed that the resected specimens were stored by the hospital and potentially used for scientific research and publication of identifying information/images (when applicable), and that their privacy would be maintained. All patients provided informed consent prior to undergoing screening procedures.
Footnotes
Reporting Checklist: The authors have completed the ARRIVE Reporting Checklist. Available at http://dx.doi.org/10.21037/tlcr-19-509
Data Sharing Statement: Available at http://dx.doi.org/10.21037/tlcr-19-509. All data are available for all researchers in the world. We would like to make a statement that we totally respect and follow the data availability policy of BJC journal (Type 3 Springer Nature data policy). The original data were available through contacting the corresponding author on reasonable request.
Conflicts of Interest: All authors have completed the ICMJE uniform disclosure form (available at http://dx.doi.org/10.21037/tlcr-19-509). The authors have no conflicts of interest to declare.
References
- 1.Siegel RL, Miller KD, Jemal A. Cancer Statistics, 2017. CA Cancer J Clin 2017;67:7-30. 10.3322/caac.21387 [DOI] [PubMed] [Google Scholar]
- 2.Siegel RL, Miller KD, Jemal A. Cancer statistics, 2015. CA Cancer J Clin 2015;65:5-29. 10.3322/caac.21254 [DOI] [PubMed] [Google Scholar]
- 3.McGuire S. World Cancer Report 2014. Geneva, Switzerland: World Health Organization, International Agency for Research on Cancer, WHO Press, 2015. Adv Nutr 2016;7:418-9. 10.3945/an.116.012211 [DOI] [PMC free article] [PubMed] [Google Scholar]
- 4.Stewart BW, Wild C, International Agency for Research on Cancer, et al. World cancer report 2014. Lyon, France; Geneva, Switzerland: International Agency for Research on Cancer. WHO Press; 2014. [Google Scholar]
- 5.Goldstraw P, Chansky K, Crowley J, et al. The IASLC Lung Cancer Staging Project: Proposals for Revision of the TNM Stage Groupings in the Forthcoming (Eighth) Edition of the TNM Classification for Lung Cancer. J Thorac Oncol 2016;11:39-51. 10.1016/j.jtho.2015.09.009 [DOI] [PubMed] [Google Scholar]
- 6.Pignon JP, Tribodet H, Scagliotti GV, et al. Lung adjuvant cisplatin evaluation: a pooled analysis by the LACE Collaborative Group. J Clin Oncol 2008;26:3552-9. 10.1200/JCO.2007.13.9030 [DOI] [PubMed] [Google Scholar]
- 7.Davies J, Patel M, Gridelli C, et al. Real-world treatment patterns for patients receiving second-line and third-line treatment for advanced non-small cell lung cancer: A systematic review of recently published studies. PLoS One 2017;12:e0175679. 10.1371/journal.pone.0175679 [DOI] [PMC free article] [PubMed] [Google Scholar]
- 8.Lazzari C, Bulotta A, Ducceschi M, et al. Historical Evolution of Second-Line Therapy in Non-Small Cell Lung Cancer. Front Med (Lausanne) 2017;4:4. 10.3389/fmed.2017.00004 [DOI] [PMC free article] [PubMed] [Google Scholar]
- 9.Ellis JM, Bowman CE, Wolfgang MJ. Metabolic and tissue-specific regulation of acyl-CoA metabolism. PLoS One 2015;10:e0116587. 10.1371/journal.pone.0116587 [DOI] [PMC free article] [PubMed] [Google Scholar]
- 10.Hunt MC, Tillander V, Alexson SE. Regulation of peroxisomal lipid metabolism: the role of acyl-CoA and coenzyme A metabolizing enzymes. Biochimie 2014;98:45-55. 10.1016/j.biochi.2013.12.018 [DOI] [PubMed] [Google Scholar]
- 11.Hunt MC, Alexson SE. Novel functions of acyl-CoA thioesterases and acyltransferases as auxiliary enzymes in peroxisomal lipid metabolism. Prog Lipid Res 2008;47:405-21. 10.1016/j.plipres.2008.05.001 [DOI] [PubMed] [Google Scholar]
- 12.Faergeman NJ, Knudsen J. Role of long-chain fatty acyl-CoA esters in the regulation of metabolism and in cell signalling. Biochem J 1997;323:1-12. 10.1042/bj3230001 [DOI] [PMC free article] [PubMed] [Google Scholar]
- 13.Wen T, Gao L, Wen Z, et al. Exploratory investigation of plasma metabolomics in human lung adenocarcinoma. Mol Biosyst 2013;9:2370-8. 10.1039/c3mb70138g [DOI] [PubMed] [Google Scholar]
- 14.Liu J, Mazzone PJ, Cata JP, et al. Serum free fatty acid biomarkers of lung cancer. Chest 2014;146:670-9. 10.1378/chest.13-2568 [DOI] [PubMed] [Google Scholar]
- 15.Jung WY, Kim YH, Ryu YJ, et al. Acyl-CoA thioesterase 8 is a specific protein related to nodal metastasis and prognosis of lung adenocarcinoma. Pathol Res Pract 2013;209:276-83. 10.1016/j.prp.2013.02.008 [DOI] [PubMed] [Google Scholar]
- 16.Guo J, Chen H, Yang B, et al. The role of acyl-CoA thioesterase ACOT8I in mediating intracellular lipid metabolism in oleaginous fungus Mortierella alpina. J Ind Microbiol Biotechnol 2018;45:281-91. 10.1007/s10295-018-2006-8 [DOI] [PubMed] [Google Scholar]
- 17.Lu M, Zhu WW, Wang X, et al. ACOT12-Dependent Alteration of Acetyl-CoA Drives Hepatocellular Carcinoma Metastasis by Epigenetic Induction of Epithelial-Mesenchymal Transition. Cell Metab 2019;29:886-900.e5. 10.1016/j.cmet.2018.12.019 [DOI] [PubMed] [Google Scholar]
- 18.Kang HW, Niepel MW, Han S, et al. Thioesterase superfamily member 2/acyl-CoA thioesterase 13 (Them2/Acot13) regulates hepatic lipid and glucose metabolism. FASEB J 2012;26:2209-21. 10.1096/fj.11-202853 [DOI] [PMC free article] [PubMed] [Google Scholar]
- 19.Zhuravleva E, Gut H, Hynx D, et al. Acyl coenzyme A thioesterase Them5/Acot15 is involved in cardiolipin remodeling and fatty liver development. Mol Cell Biol 2012;32:2685-97. 10.1128/MCB.00312-12 [DOI] [PMC free article] [PubMed] [Google Scholar]
- 20.Wang F, Wu J, Qiu Z, et al. ACOT1 expression is associated with poor prognosis in gastric adenocarcinoma. Hum Pathol 2018;77:35-44. 10.1016/j.humpath.2018.03.013 [DOI] [PubMed] [Google Scholar]
- 21.Kirkby B, Roman N, Kobe B, et al. Functional and structural properties of mammalian acyl-coenzyme A thioesterases. Prog Lipid Res 2010;49:366-77. 10.1016/j.plipres.2010.04.001 [DOI] [PubMed] [Google Scholar]
- 22.Hung JY, Chiang SR, Liu KT, et al. Overexpression and proliferation dependence of acyl-CoA thioesterase 11 and 13 in lung adenocarcinoma. Oncol Lett 2017;14:3647-56. 10.3892/ol.2017.6594 [DOI] [PMC free article] [PubMed] [Google Scholar]
- 23.Liu KT, Yeh IJ, Chou SK, et al. Regulatory mechanism of fatty acidCoA metabolic enzymes under endoplasmic reticulum stress in lung cancer. Oncol Rep 2018;40:2674-82. [DOI] [PubMed] [Google Scholar]
- 24.Mitteer DR, Greer BD, Fisher WW, et al. Teaching behavior technicians to create publication-quality, single-case design graphs in graphpad prism 7. J Appl Behav Anal 2018;51:998-1010. 10.1002/jaba.483 [DOI] [PMC free article] [PubMed] [Google Scholar]
- 25.Blum A, Wang P, Zenklusen JC. SnapShot: TCGA-Analyzed Tumors. Cell 2018;173:530. 10.1016/j.cell.2018.03.059 [DOI] [PubMed] [Google Scholar]
- 26.Cantor JR, Sabatini DM. Cancer cell metabolism: one hallmark, many faces. Cancer Discov 2012;2:881-98. 10.1158/2159-8290.CD-12-0345 [DOI] [PMC free article] [PubMed] [Google Scholar]
- 27.Du B, Shim JS. Targeting Epithelial-Mesenchymal Transition (EMT) to Overcome Drug Resistance in Cancer. Molecules 2016;21:965. 10.3390/molecules21070965 [DOI] [PMC free article] [PubMed] [Google Scholar]
- 28.Brocker C, Carpenter C, Nebert DW, et al. Evolutionary divergence and functions of the human acyl-CoA thioesterase gene (ACOT) family. Hum Genomics 2010;4:411-20. 10.1186/1479-7364-4-6-411 [DOI] [PMC free article] [PubMed] [Google Scholar]
- 29.Dillon SC, Bateman A. The Hotdog fold: wrapping up a superfamily of thioesterases and dehydratases. BMC Bioinformatics 2004;5:109. 10.1186/1471-2105-5-109 [DOI] [PMC free article] [PubMed] [Google Scholar]
- 30.Adams SH, Chui C, Schilbach SL, et al. BFIT, a unique acyl-CoA thioesterase induced in thermogenic brown adipose tissue: cloning, organization of the human gene and assessment of a potential link to obesity. Biochem J 2001;360:135-42. 10.1042/bj3600135 [DOI] [PMC free article] [PubMed] [Google Scholar]
- 31.Zhang Y, Li Y, Niepel MW, et al. Targeted deletion of thioesterase superfamily member 1 promotes energy expenditure and protects against obesity and insulin resistance. Proc Natl Acad Sci U S A 2012;109:5417-22. 10.1073/pnas.1116011109 [DOI] [PMC free article] [PubMed] [Google Scholar]
- 32.Vander Heiden MG, Cantley LC, Thompson CB. Understanding the Warburg effect: the metabolic requirements of cell proliferation. Science 2009;324:1029-33. 10.1126/science.1160809 [DOI] [PMC free article] [PubMed] [Google Scholar]
- 33.Hanahan D, Weinberg RA. Hallmarks of cancer: the next generation. Cell 2011;144:646-74. 10.1016/j.cell.2011.02.013 [DOI] [PubMed] [Google Scholar]
Associated Data
This section collects any data citations, data availability statements, or supplementary materials included in this article.
Supplementary Materials
The article’s supplementary files as


