Abstract
Microfluidic paper-based analytical devices (μPADs) are simple but powerful analytical tools that are gaining significant recent attention due to their many advantages over more traditional monitoring tools. These include being inexpensive, portable, pump-free, and having the ability to store reagents. One major limitation of these devices is slow flow rates, which are controlled by capillary action in the hydrophilic pores of cellulosic paper. Recent investigations have advanced the flow rates in μPADs through generation of a gap or channel between two closely-spaced paper sheets. This multilayered format has opened up μPADs to new applications and detection schemes, where large gap sizes (>300 μm) provide at least 169× faster flow rates than single-layer μPADs, but do not conform to established mathematical models for fluid transport in porous materials, such as the classic Lucas-Washburn equation. In the present study, experimental investigations and analytical modeling are applied to elucidate the driving forces behind the rapid flow rates in these devices. We investigate a range of hypotheses for the system fluid dynamics and establish a theoretical model to predict the flow rate in multilayered μPADs that takes into account viscous dissipation within the paper. Device orientation, sample addition method, and the gap height are found to be critical concerns when modeling the imbibition in multilayered devices.
Keywords: Microfluidic paper-based analytical devices, rapid flow, viscous dissipation, fluid transport, imbibition
INTRODUCTION
Point-of-care (POC) diagnostics are critical for the advancement of global health and preventing the spread of infectious diseases through increased accessibility and reduced time and costs associated with monitoring.1-2 This motivation is especially relevant in developing countries, where insufficient wealth and infrastructure to monitor infectious diseases. Over the last 10 years, μPADs emerged as an ideal format for performing POC diagnoses.3 μPADs are inexpensive, easy to fabricate, portable, use small (microliter) volumes, can effectively store reagents, and direct fluid transport without the need for bulky syringe pumps. These characteristics align with the World Health Organization’s ASSURED criteria (affordable, sensitive, specific, user-friendly, rapid, robust, equipment-free and deliverable) for developing diagnostics.2, 4 Compared to common paper-devices such as spot tests and lateral flow assays, μPADs can offer multiplexed assays with more complex reactions.3 Thus, μPADs have been employed as analytical tools for applications that range from nucleic acid detection in whole blood to heavy metals analysis in river water.2-3, 5
The ability for μPADs to perform complex processes is derived from their high adaptability. As a result, the field of paper microfluidics has grown with many new publications describing new capabilities. Of particular note are process optimization methods (sample loading, filtering, on device separations, etc.), flow manipulation tools (sequential injection of analytes, increasing flow rates, reduced assay times, etc.), and advanced result readouts (integrated sensors, digital readers, etc.).2-3, 6 For example, Crooks and coworkers reported that hollow channels composed of a hydrophilic ceiling and hydrophobic floor provide 7× faster flow rate improvements over single-layered devices.7 This improvement was attributed to increased pressures unique to their system through syringe pump driven sample addition to the devices. Martinez and coworkers used a similar μPAD system with a small channel height (< 25 μm) that also providing small gains in flow rate, and modelled the faster flow in their system.8 This concept has been extended to multilayered μPADs with larger gaps between the paper layers (ca 300 μm) to provide a 169× increase in flow rate over single layered devices (> 2 mL min−1).9 Up to this point, no analytical modeling work has described the fast flow rates observed in large gap multilayered μPADs. Accurate models of the fluid dynamics in multilayered μPADs are critical for both understanding results, and guiding device design for tailored applications.
The two most commonly applied models for describing flow in porous networks have remained largely unchanged over the last ~100 years, namely the Lucas-Washburn equation10 and Darcy’s law,11 which are given respectively by
| (1) |
where ℓ(t) (m) is the distance traversed down the channel at time t (s), γ is the interfacial tension (N m−1), r′ is the mean capillary radius of the paper pores (m), θ is the fluid contact angle on the paper, and μ is the fluid dynamic viscosity (N·s·m−1) and
| (2) |
where Q is the volumetric flow rate (m3 s−1), κ is the paper permeability (m2), A is the cross-sectional area of the paper normal to flow (m2), and ΔP is the pressure difference driving force (N·m−2). The average velocity is then given by u = Q/A. The Lucas-Washburn equation, Equation (1), describes fluid transport through straight and cylindrically shaped pores while assuming (i) a constant cross-sectional area, (ii) that gravitational effects are negligible, i.e., horizontal orientation, (iii) the paper is chemically homogenous, and (iv) the inlet reservoir volume is unlimited. Similarly, Darcy’s law, Equation (2), was developed for liquid flow through a porous media, e.g., sandstone, and assumes (i) negligible kinetic energy changes, (ii) a circular pore cross section and (iii) uniform permeability. While these models were not originally derived for fluid flow in paper, they serve as a good approximation for describing simple systems, for example, single layer paper devices, simple geometries, horizontal orientation, and smaller gap heights.8, 12
As μPADs grow increasingly complex, these models become less applicable, especially for in-field testing where experimental conditions are more difficult to control or less than ideal (temperature, humidity, etc.). This is particularly highlighted for hollow channel or multilayered μPADs referred to earlier, where a large proportion of fluid flow occurs between paper layers or layers of paper and other materials.7-9, 13-15 These devices can achieve rapid and tunable flow rates (0.02–3.7 cm s−1 or 3.92 mL min−1) without the use syringe pumps to drive the flow — expanding the capabilities for new point-of-care applications. Modeling the fluid dynamics for these hollow channel or multilayered μPADs systems is complicated by the multiple regions of flow (i.e., in paper and gaps) as well as consideration of variables, such as gravity, which can normally be considered negligible in single layer μPAD designs yet become critical when transporting larger volumes (hundreds of μL). For example, dipstick-type devices — where a μPAD or lateral flow assay is dipped into a reagent solution16 — exhibit no change in velocity when held in a vertically or horizontally orientated position - this is not the case for multilayered devices.9, 14
Several studies have developed new models to address the limitations of Equations (1) and (2) towards complex μPAD designs. In particular, Martinez et al. derived a modified form of the Lucas-Washburn equation to account for a 12 μm gap between two paper layers along with a consideration for humidity effects, which is given by8
| (3) |
where th is the paper thickness, q0 is the volumetric evaporation flux (the volume of evaporated liquid per unit area of wet channel and time) and r is the area-averaged effective pore size given by
| (4) |
where 2h is the gap height between the paper layers. Note, in the case of zero or negligible evaporation, q0 → 0 and Equation (3) simplifies to Equation (1), the Lucas-Washburn equation. Equation (1) has been shown to work well for small gap heights (2h ≤ 12 μm) but provides a poor fit for gap heights greater than this.9 Different models for the effective pore size discussed in this study are presented in section S5 of the Supporting Information (SI). Toley et al. employed the Richards equation17 to model imbibition in μPADs.18 Here, Toley et al. describes the paper as a series of partially saturated parallel capillaries. This model provides useful insights on flow in porous membranes but requires multiple experiments and computational modeling in order to solve the equation for a new system, making it challenging to use. Berli et al. have extended Equation (1) for devices of varying cross sectional area, which are becoming more commonplace in complex μPAD designs.19 Finally, Kim et al. have investigated the effect of hydrophobic boundaries such as wax on flow rates, providing a modified form of Equation (1) based on contact angles of the paper-wax boundary.20 In the present study, we seek to provide a detailed investigation toward establishing critical variables to the fast flow origins and model this behavior in multilayer μPADs with a universal equation that would be easy to use and extend the range of channel heights beyond that previously achieved.
EXPERIMENTAL
Materials & Equipment.
All μPADs were printed with a Xerox ColorQube 8870 wax printer on Whatman Grade 1 Chromatography paper or Whatman Grade 3MM paper. The Whatman paper was purchased from GE Healthcare Sciences. The Fisher Scientific Quantitative Grade Q8 Filter paper which served as the scaffold for the superhydrophobic surface, was purchased from Fisher Scientific. Scotch Heavy Duty Shipping Packaging Tape and Scotch Permanent Double Sided Tape were purchased from Office Max. Individual paper and tape segments were cut with a 30 W CO2 Epilog Zing Laser Cutter and Engraver. Great Value FD&C Red 40 and Blue 1 dyes purchased from Wal-Mart Stores, Inc. were prepared with ultrapure water (18.2 MΩ·cm) from an EMD Millipore Milli-Q water purification system. The heptadecafluoro-1,1,2,2-tetrahydrodecyl trichlorosilane purchased from Gelest treated the Fisher Scientific Quantitative Grade Q8 Filter Paper. The humidity in the laboratory varied between 25 and 40% during the work described herein. A 200 μL Eppendorf pipette transferred the dyes to the μPADs when appropriate. Top-down perspectives of the fluid transport through the μPADs over longer distances (> 2cm) were captured with a Nikon Coolpix L110 digital camera. A Photron Fastcam SA3 digital camera captured high speed videos of fluids traveling through the μPADs from both the side view and the top-down perspectives over short distances (< 2 cm). The Photron camera was coupled to a Navitar 1-50486 and a Nikon Micro Nikkor 105 mm lens for the side view and top-down views of the fluid transport, respectively.
Device Fabrication.
Multilayered μPADs were fashioned according to a previously described procedure (Figure 1a).9 In short, wax patterns were designed in CorelDRAW X4, printed on Whatman Grade 1 Chromatography Paper or Whatman Grade 3MM Filter Paper with “Sky Blue” (R = 0, G = 124, B = 195) colored wax. Black indicator markers were printed onto the device to serve as a scale for quantifying the fluid flow rate. The smaller markers indicate 1 mm increments while the longer markers indicate 5 mm increments. To prevent leaking, the printed wax designs were melted on a hot plate (Fisher Scientific IsoTemp) at 150°C for 90 s. All μPADs featured a channel width of 4.52 mm after melting the wax-printed features. Each paper layer was then individually separated using a CO2 laser cutter improving the manual alignment of the two layers. The multilayered paper devices were constructed by placing 78 μm thick double-sided tape along the sides of the paper channel. This double-sided tape was cut manually to fit each device. The gap between the two paper layers were varied by stacking multiple layers of double-sided tape between them, resulting in gap sizes with 78 μm increments. In cases where the side perspective was imaged, the μPADs were cut down the center along the paper channel with a 15-inch Swingline paper trimmer.
Figure 1.
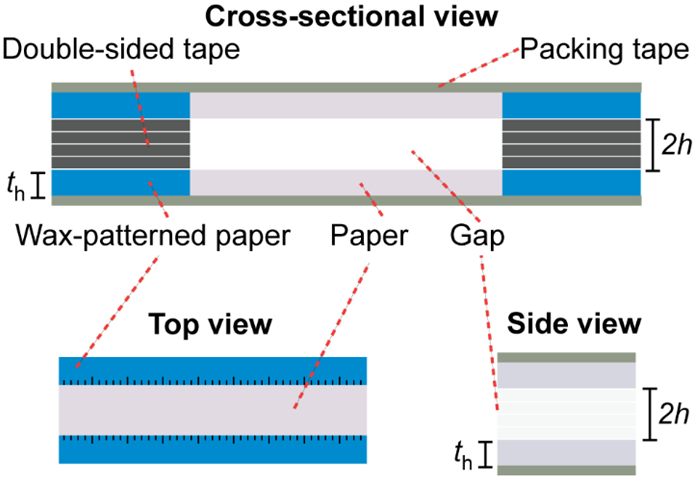
Schematic and orientation of multilayerd μPADs.
Device Testing & Imaging.
Liquids were introduced to the sample inlet in three ways. The first method required the use of a pipette to deliver liquid to a μPAD with a built-in paper inlet. Here, the bottom layer of the μPAD extended beyond the top layer where liquid was pipetted into the device. Unless otherwise stated, this pipette delivery method is used throughout. The second method utilized a reservoir separate from the μPAD made from packing tape. Here, the μPAD was manually slid into contact with the reservoir. This reservoir was constructed by laser cutting a 10×15 mm2 wide oval out of a section of packing tape and placing this on top of another layer of packing tape. This packing tape sandwich was placed onto a piece of white copy paper to complete the construction. The third method of delivering liquid to the μPAD was similar to the second, however, the packing tape was substituted for superhydrophobic paper. This superhydrophobic paper was prepared via a liquid phase silanization of Fisher Scientific Quantitative Grade Q8 filter paper. It should be noted that due to the superhydrophobicity of the treated paper, no patterns were needed to confine the liquid sample. The solution to treat the paper was prepared by diluting 500 μL of heptadecafluoro-1,1,2,2-tetrahydrodecyl trichlorosilane with 20 mL of n-hexane. This hydrophobic treatment called for the immersion of the paper in the silane solution for three days at room temperature. Unless specified, all tests used 200 μL of liquid.
When comparing the orientation at which the devices were held (0°, 45°, 90°), alligator clips mounted to a small weighted base were used to secure, lower, and slide the 90° and 45° oriented μPADs into the sample wells. The 0° oriented μPADs were slid into the sample wells as previously discussed. Videos were captured while the cameras were mounted to tripod stands to maintain a fixed frame. A Photron Fastcam SA3 digital camera captured high speed videos at 500 frames per second with an 8Bit Gray color scale. Videos of the fluid transport captured with the AM4515ZTL Dino-Lite microscope used a flexible stand to fix its position. The side view videos were imaged along the inside edge (hydrophilic paper) of the sliced μPADs. The flow rate data collected from videos captured with the Nikon Coolpix L110 camera were compiled by noting the time which the fluid front reached the printed tick marks on the μPAD using Windows Movie Maker. The flow rate data collected from videos captured with the Photron Fastcam SA3 camera used the Photron FASTCAM Viewer Version 3.6.9.1 to compile the distance-time data.
RESULTS AND DISCUSSION
Characterization of Flow Profile and Velocity.
Initially, we sought to investigate the change in fluid front velocity over increasing channel lengths. If the primary fluid driving force is capillary action as with the Lucas-Washburn equation, Equation (1), the distance traversed is proportional to the square root of time, thus the velocity is inversely proportional to distance. As shown in Figure 2, the experimental data for two different gap heights and using the sliding/tape reservoir sampling method conforms adequately to a 1/distance, i.e., (1/ℓ) curve fit, i.e., not model-based, suggesting capillary action is a major component of the fluid driving force.
Figure 2.
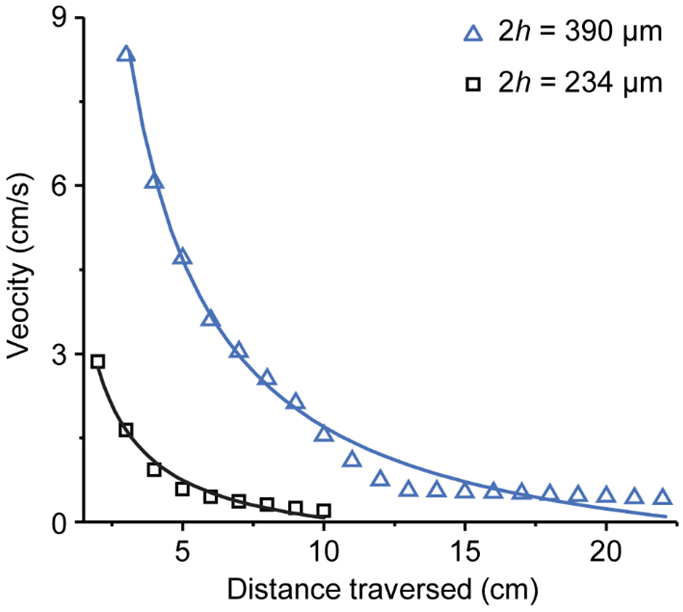
The 1/distance fit of experimental data with 3 and 5 layers of double-sided tape (height = 234 and 390 μm, respectively).
An unusual fluid front profile has previously been described in multilayered μPADs,9 where a convex fluid front processes in the paper between the wax channel edges in the top view, but a concave fluid front between the paper layers from the side view. At first it was suggested this behavior was due to an interplay between capillary and pressure driven forces driving the fast fluid transport. To further probe this observation, multilayered devices were sliced down the middle of the paper channels parallel to the direction of flow. The sliced devices were then oriented horizontally, and fluid front shape was monitored with a high-speed camera. As shown in Figure 3 and section S2 in the supporting information, the previously described concave fluid front was observed, as well as the leading fluid front in the paper closest to the gap and trailing in the paper closest to the tape. It should be noted that in order to capture videos of the fluid front within these devices, the channel was effectively cut in half, introducing a new air-liquid-paper interface where normally a tape barrier would be present.
Figure 3.
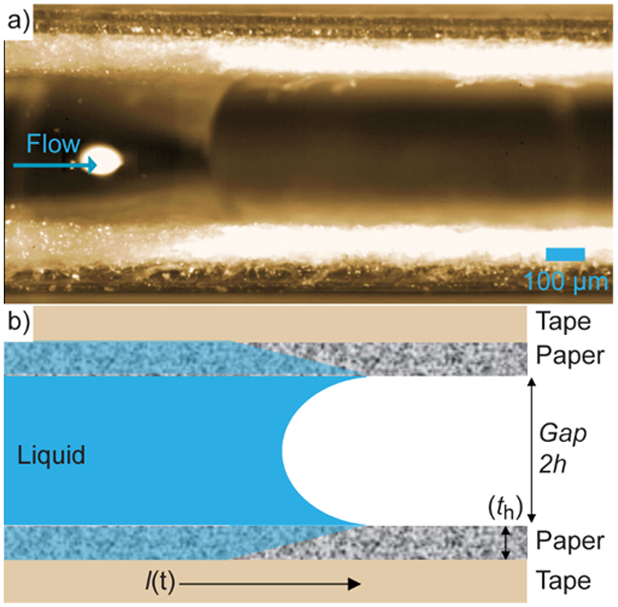
a) Side view picture and b) illustrative schematic of fluid flow in multilayered μPADs (390 μm gap height).
To assess the wetting of the paper at the fluid front, these images were further analyzed to assess the saturation of the paper beside the fluid front (Figure S1). From Equation (1), the flow rates in paper alone are significantly slower than those observed in multilayered devices. We can therefore hypothesize that liquid at the three-phase interface (air-water-paper) at the fluid front wicks into each capillary then saturates the paper normal to the direction of flow. For this proposed mechanism, the average saturation time or time for the paper to be completely wetted through the paper thickness (in the y-direction), is 5.58 ± 1.91 s for Whatman 1 Chromatography paper (n = 3 devices) and 8.17 ± 2.27 s for Whatman grade 3MM paper (n = 1 device). Given paper thicknesses of 180 and 340 μm for Chromatography and 3MM paper, respectively, these times correspond to velocities of 3.66 ± 1.31 cm s−1 and 4.16 ± 1.16 cm s−1. In sharp contrast, Equation (1) predicts that the velocity through these two thicknesses is 215 cm s−1 for 180 μm and 115 cm s−1 for 340 μm paper. This disparity between the predictions from the Lucas-Washburn equation and our experimental results in the multilayered μPAD, demonstrates the need to explore the mechanism behind the observed rapid flow behavior.
Standard practice for sample addition to microfluidic paper devices involves either addition of the sample to the start of the μPAD or a loading zone through pipetting or syringe pumps (i.e., LFAs), or bringing the device into contact with the sample to initiate flow (i.e., dipstick).9, 16 For single-layered devices under standard conditions, these sampling methods have a negligible effect on the flow rate / assay time. Three sampling methods were tested with the multilayered μPADs as shown in Figure 4, namely a pipette sampling approach and two sliding dipstick-type approaches - where sample wells of differing hydrophobicity (a super omniphobic surface and hydrophobic tape) - were used as described in the experimental section. Individual velocity-distance plots (Figure S4), as well as videos of these sample addition methods are provided as electronic supporting information titled “Pipette sampling”, “Tape sampling” and “Omniphobic sampling”.
Figure 4.
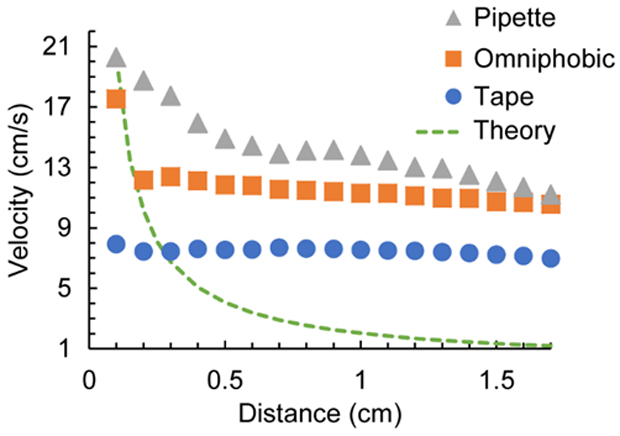
Decay of velocity with distance with different sampling methods namely addition through pipetting (grey triangles), connection to aliquots on a super omniphobic surface (orange squares), and connection to aliquots in tape wells (blue circles), flow of a dilute solution of dye down a multilayer μPAD, 390 μm gap height, Whatman 3MM paper, n = 5.
Of the three methods, faster velocities are observed with pipette sampling compared to the dipstick-type sampling methods. This is likely due to the enhanced driving forces akin to pressure-driven flow, where the pipette forcibly delivers liquid into the gap of the multilayered μPAD, as compared to other sample delivery methods in single-layer μPADs as demonstrated by Crooks and coworkers.7, 21 Faster velocities are also observed with the super omniphobic surface compared to the hydrophobic tape sample well, especially over short distances (< 1 mm). This is attributed to the increased surface tension of the sample droplet formed by the super omniphobic paper, as described in more detail in Figure S5.
The imbibition in single-layer paper-based devices, where capillary action drives fluid flow, is described in Equation 1, where the distance traversed is proportional to the square root of time. Therefore, the velocity is inversely proportional to the distance. Figure 4 also contrasts the experimental data from the different sampling methods with a 1/ℓ fit (green dashed line). The velocities for the different sampling methods are statistically significant over short distances (% relative standard deviation at 0.1 cm = 35%) and converge over longer distances traversed (% relative standard deviation at 1.7 cm = 19%). Compared with the 1/ℓ curve fit, all sampling methods present higher magnitude and slower decaying velocities, suggesting that pressure-driven flow contributes significantly to the velocity over the first 2 cm of the channel. This data confirms that, in contrast to single-layered paper devices, different sampling methods have a significant effect on the initial velocities in multilayered μPADs.
The final variable we assess is the humidity, which has previously been shown to affect the flow rate and sample loss through evaporation of the solvent (water).8, 22 Elevated humidity levels are particularly problematic for paper devices as it can slow flow rates, and unexpectedly change assay times for unsealed devices (i.e., paper open to air).9 For the multilayered μPAD design described in this study, the devices are sealed in tape with only the sample addition edge open to air. The percentage mass loss from these devices was found to be 0.90% after 1 min, 7.4% after 15 min, and 0.063% over typical timescales for multilayered μPAD sample transport (6 s) as shown in Figure S6. Based on this data, the effects of humidity on the flow rate can be neglected for our model.
Modeling Flow in Horizontal Multilayer Devices.
The majority of modeling studies performed on fluid transport in μPADs have used the form of Lucas-Washburn shown in Equation (1) to predict penetration distance as a function of time, and it has worked extremely well. For paper often used for capillary pumping applications, gravity has a negligible effect on imbibition rate regardless of device orientation, except at unrealistically long times, and the interface height in the feed reservoir above the inlet creates a hydraulic head three to four orders of magnitude smaller than capillary forces in the paper. Thus, the original Lucas-Washburn equation has proven reliable even when some of the underlying assumptions are relaxed.
Refinement of the Lucas-Washburn equation has continued, though, to better capture effects such as paper sub-saturation or physical modifications of a system to more precisely tailor flow. A recent and thorough review of these various activities23 highlights the importance of the ongoing theoretical studies, model development, and need for accurate predictive capability, additionally the authors explicitly note that the mechanisms controlling wicking physics remain unclear. The studies discussed in the supporting information (SI) document suggest how flow behavior in the current multilayer device might be analyzed and explained; those approaches are examined in turn and none are found to capture the observed flow behavior in the multilayer device (Figure S7). These models all represent variations on a theme in which the Lucas-Washburn equation is assumed to apply under different scenarios. However, since the Lucas-Washburn and derivative equations were developed to describe flow in porous media, it is not obvious that any should apply to a system with a distinct homogenous, non-porous flow domain. The reason for the focus on Lucas-Washburn in this study is that the imbibition in the device is inarguably capillary driven, and the observations follow consistent dependencies. For example, as illustrated in Figure 2, the observed penetration velocity exhibits the expected u ∝ ℓ−1 behavior. Results are also consistent with the well-known ℓ2 ∝ t response (data not shown).
What distinguishes the present study from others in the literature is the sheer magnitude of the Laplace pressure driving force in the gap between the paper layers. As evidenced by the still image in Figure 3, as well as Figure S3 in the SI and the supporting video “side on flow”, the flow in the gap is dragging the liquid in the paper layer. In other words, despite the existence of a capillary pressure driving force within the paper layer, the flow in that region is dominated by the “moving wall” of liquid at the gap boundary. The resulting situation is a predominantly shear flow within the paper, resulting in a linear velocity profile. The question, then, is why system behavior isn’t accurately predicted by the modeling attempts described in SI section S5; the answer is that viscous dissipation (ViDi) within the paper layer creates an appreciable pressure loss as predicted by the macroscopic mechanical energy balance. If the capillary pressure driving force in the gap is denoted as Pc and the pressure loss due to viscous dissipation is Pv, then the net pressure driving force in the Lucas-Washburn formulation is
| (5) |
where r = h/cosθ, Q is the volumetric flow rate, ux is the liquid velocity component parallel to the channel boundaries in the paper layer, y is the coordinate perpendicular to the boundaries, μ is the liquid viscosity, and the integral is over the volume of liquid in the paper. Since ux is independent of x at any time t and the slope of the velocity profile is constant in the paper the integral can be directly evaluated to obtain
| (6) |
where u = dℓ/dt is the speed of the liquid front at any time t and th is the paper thickness. As described in the SI, substituting this net driving force expression into the Navier-Stokes solution for pressure-driven flow in a horizontal slit yields, after rearranging,
| (7) |
where and . This nonlinear differential equation is a form of the d’Alembert equation24 and was originally solved by Jacob Bernoulli. Details of the derivation and solution procedure may be found in the SI, and an intermediate result is an implicit expression relating time t and velocity u:
| (8) |
The parameters a and c are as above, and β is a constant resulting from indefinite integration. The unknown constant is determined by applying the initial condition that u = u0 at time t = 0. Then,
| (9) |
and after substituting into Equation (8) and simplifying, the expression is
| (10) |
Laboratory results for u0 may then be used as input to the model. Specifically, because it is difficult to accurately measure the velocity at short times/distances, a Matlab script was written that fit a low-order polynomial to the velocity data and the fit used to extrapolate back to t → 0.
Last, the solution can be taken one step further by using Equation (7) to eliminate velocity from Equation (8), resulting in a general expression for penetration depth as a function of time:
| (11) |
where β is a different constant from that shown in Equation (9).
The following parameters were used in order to compare the model predictions against observations: γ = 0.0728 N/m, μ = 0.001 Pa·s, th = 9.6×10⁻⁵ m, and θ = 34°, the last parameter based on analyzing a number of still images such as the ones in Figure 3a and S3. Layers of 7.8×10⁻⁵ m thick double-sided tape were used to create the different gap heights, so h is in increments of 3.9×10⁻⁵ m. Based on the model result it is expected that the imbibition velocity will increase with gap height, and this has been confirmed by experiment. Measured data for penetration distance and time enables the use of Equation (10) to predict the velocity in the device at given penetration time or distance. As shown in Figure 5, the velocity does increase significantly, almost exponentially, with increasing gap height. At the largest gap height, 390 μm, the velocity at 5.5 cm is almost 240× greater than what could be achieved in a single-layer, paper-based microfluidic device (indicated by the symbols labeled LW). Different values of the initial velocity u0 were used in the model for each gap height in addition to the extrapolated values, and it was found that the predictions shown in Figure 5 were insensitive to that parameter. The model also corroborates the previously observed phenomena9 that the thickness of the paper walls has a negligible effect on the imbibition velocity (Figure S2). Note, a zoom-in of Figure 5 over the lower velocity values is provided in the supporting information (Figure S7b).
Figure 5.
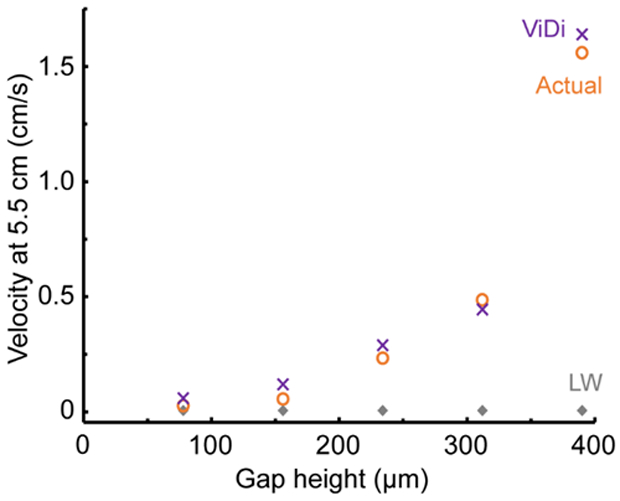
Comparison of experimental data (actual), the Lucas Washburn equation (LW) and our viscous dissipation (ViDi) model, velocity of fluid flow is taken at 5.5 cm.
The same Equation (10) was also used to predict the velocity as a function of time for three gap heights: 234 μm (3 tape layers), 312 μm (4 layers), and 390 μm 5 layers). The initial velocities used in the model were u0 = 4 cm/s, 5.5 cm/s, and 6.5 cm/s, respectively. It was found that, as above, even for relatively short penetration distances (~1 cm) the prediction was relatively insensitive to u0. This result is consistent with the experiments, where the measured initial velocities varied, but the values were very consistent at all but the shortest times. As shown in Figure 6, the predicated velocities (black lines) are in good agreement with the measured values (circles).
Figure 6.
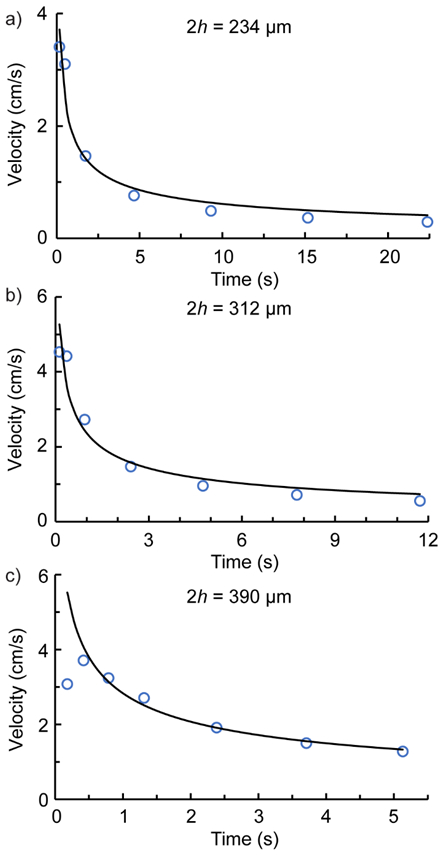
The liquid front velocity as a function of time in horizontal operation. The circle symbols ( ) correspond to the experimental values while the black line represents the model predictionl. The gap heights are (a) 234 μm, (b) 312 μm, and (c) 390 μm.
The decay of u with t follows the usual Lucas-Washburn behavior for imbibition in paper, except for the significantly greater magnitude resulting from the gap flow. The discrepancy between theory and experiment at t = 0.18 s for the largest gap (Figure 6c) is due to the difficulty in obtaining an accurate interpolation of distance versus time from the high-speed video images. The model correctly captures the penetration rate observed in the laboratory for all gap heights tested, provided that the multilayer device is oriented horizontally. It is clear that viscous dissipation plays an important role in this fast-flow device. Neglecting that phenomenon yields significantly different predictions for velocity, as shown in Figure S7, and discussed at length in the SI.
CONCLUSIONS AND PERSPECTIVES
In this work, the flow phenomena within multilayered μPADs are investigated and modelled. The sampling method and gap height are shown to be the two critical variables in multilayered devices — which are typically negligible in common single-layered paper-based devices such as lateral flow assays. Experimental data is analyzed against a wide range of literature methods for capillary action driven and Laplace pressure driven flow, from which a model is generated, Equation (10), that accurately describes the flow within these devices. The fluid transport is found to be driven over short distances (~1 cm) by Laplace pressure, i.e., by the sampling method for which solution is added to the device. Over longer distances, the fluid transport is driven along the gap between the layers, with liquid dissipating into the porous channel walls at the three phase (paper/liquid/air) boundary, leading to the usually convex/concave fluid front observed. Future work will seek to apply these findings towards more complex multilayer μPADs designs and extend the model to cover a greater number of experimental variables. In addition to revising steadfast equations for this new device architecture, the findings herein provide those aiming to work with multilayer μPADs the power to better predict liquid penetration time and improve device performance with time-sensitive manipulations and measurements.
Supplementary Material
ACKNOWLEDGEMENT
Support for this project was provided by the National Institute of Occupational Safety and Health (NIOSH) through R01OH010662 and National Institute for Environmental Health and Safety (NIEHS) through 4R33ES024719-04. The authors declare no competing financial interests. An early version of this work presented at MicroTAS 2018.25
REFERENCES
- 1.Organization, W. H. World Health Organization Model List of Essential In Vitro Diagnostics; 16-20 April 2018, 2018.
- 2.Gong MM; Sinton D, Turning the Page: Advancing Paper-Based Microfluidics for Broad Diagnostic Application. Chem. Rev 2017, 117 (12), 8447–8480. [DOI] [PubMed] [Google Scholar]
- 3.Yang Y; Noviana E; Nguyen MP; Geiss BJ; Dandy DS; Henry CS, Paper-Based Microfluidic Devices: Emerging Themes and Applications. Anal. Chem 2017, 89 (1), 71–91. [DOI] [PubMed] [Google Scholar]
- 4.Wu G; Zaman Muhammad H., Low-cost tools for diagnosing and monitoring HIV infection in low-resource settings. Bulletin of the World Health Organization 2012, 90 (12), 914–920. [DOI] [PMC free article] [PubMed] [Google Scholar]
- 5.Yamada K; Shibata H; Suzuki K; Citterio D, Toward practical application of paper-based microfluidics for medical diagnostics: state-of-the-art and challenges. Lab Chip 2017, 17 (7), 1206–1249. [DOI] [PubMed] [Google Scholar]
- 6.Fu E; Downs C, Progress in the development and integration of fluid flow control tools in paper microfluidics. Lab Chip 2017, 17, 614–628. [DOI] [PubMed] [Google Scholar]
- 7.Renault C; Li X; Fosdick SE; Crooks RM, Hollow-Channel Paper Analytical Devices. Anal. Chem 2013, 85 (16), 7976–7979. [DOI] [PubMed] [Google Scholar]
- 8.Camplisson CK; Schilling KM; Pedrotti WL; Stone HA; Martinez AW, Two-ply channels for faster wicking in paper-based microfluidic devices. Lab Chip 2015, 15 (23), 4461–4466. [DOI] [PubMed] [Google Scholar]
- 9.Channon RB; Nguyen M; Scorzelli A; Henry E; Volckens J; Dandy D; Henry C, Rapid Flow in Multilayer Microfluidic Paper-Based Analytical Devices. Lab Chip 2018, 18, 793–802. [DOI] [PMC free article] [PubMed] [Google Scholar]
- 10.Washburn EW, The Dynamics of Capillary Flow. Physical Review 1921, 17 (3), 273–283. [Google Scholar]
- 11.Darcy H, Les fontaines publiques de la ville de Dijon: exposition et application. Victor Dalmont: 1856. [Google Scholar]
- 12.Cate DM; Adkins JA; Mettakoonpitak J; Henry CS, Recent Developments in Paper-Based Microfluidic Devices. Anal. Chem 2015, 87 (1), 19–41. [DOI] [PubMed] [Google Scholar]
- 13.Adkins JA; Noviana E; Henry CS, Development of a Quasi-Steady Flow Electrochemical Paper-Based Analytical Device. Anal. Chem 2016, 88 (21), 10639–10647. [DOI] [PubMed] [Google Scholar]
- 14.Shangguan J-W; Liu Y; Wang S; Hou Y-X; Xu B-Y; Xu J-J; Chen H-Y, Paper Capillary Enables Effective Sampling for Microfluidic Paper Analytical Devices. ACS Sens. 2018. [DOI] [PubMed] [Google Scholar]
- 15.Draz MS; Moazeni M; Venkataramani M; Lakshminarayanan H; Saygili E; Lakshminaraasimulu NK; Kochehbyoki KM; Kanakasabapathy MK; Shabahang S; Vasan A, Hybrid Paper–Plastic Microchip for Flexible and High‐Performance Point‐of‐Care Diagnostics. Advanced Functional Materials 2018, 1707161. [DOI] [PMC free article] [PubMed] [Google Scholar]
- 16.Rivas L; Reuterswärd P; Rasti R; Herrmann B; Mårtensson A; Alfvén T; Gantelius J; Andersson-Svahn H, A vertical flow paper-microarray assay with isothermal DNA amplification for detection of Neisseria meningitidis. Talanta 2018, 183, 192–200. [DOI] [PubMed] [Google Scholar]
- 17.Perez-Cruz A; Stiharu I; Dominguez-Gonzalez A, Two-dimensional model of imbibition into paper-based networks using Richards’ equation. Microfluid. Nanofluid 2017, 21 (5), 98. [Google Scholar]
- 18.Rath D; Sathishkumar N; Toley BJ, Experimental measurement of parameters governing flow rates and partial saturation in paper-based microfluidic devices. Langmuir 2018. [DOI] [PubMed] [Google Scholar]
- 19.Elizalde E; Urteaga R; Berli CLA, Rational design of capillary-driven flows for paper-based microfluidics. Lab Chip 2015, 15 (10), 2173–2180. [DOI] [PubMed] [Google Scholar]
- 20.Hong S; Kim W, Dynamics of water imbibition through paper channels with wax boundaries. Microfluid. Nanofluid 2015, 19 (4), 845–853. [Google Scholar]
- 21.Renault C; Anderson MJ; Crooks RM, Electrochemistry in Hollow-Channel Paper Analytical Devices. J. Am. Chem. Soc 2014, 136 (12), 4616–4623. [DOI] [PubMed] [Google Scholar]
- 22.Santhiago M; da Costa PG; Pereira MP; Corrêa CC; de Morais VB; Bufon CCB, Versatile and Robust Integrated Sensors To Locally Assess Humidity Changes in Fully Enclosed Paper-Based Devices. ACS Appl. Mater. Interfaces 2018. [DOI] [PubMed] [Google Scholar]
- 23.Liu Z; He X; Han J; Zhang X; Li F; Li A; Qu Z; Xu F, Liquid wicking behavior in paper-like materials: mathematical models and their emerging biomedical applications. Microfluid. Nanofluid 2018, 22 (11), 132. [Google Scholar]
- 24.Davis HT, Introduction to nonlinear differential and integral equations. Dover Publications: 1962; p 53. [Google Scholar]
- 25.Channon RB; Nguyen MP; Dandy DS; Henry CS In Understanding and Modelling Rapid Flow in Multilayered Paper-Based Devices, 22nd International Conference on Miniaturized Systems for Chemistry and Life Sciences Kaohsiung, Taiwan, Kaohsiung, Taiwan, 2018; pp 479–481. [Google Scholar]
Associated Data
This section collects any data citations, data availability statements, or supplementary materials included in this article.


