

Abstract
Our recent studies of microRNA (miRNA) expression signatures have indicated that the miR‐143/145 cluster is significantly downregulated in several types of cancer and represents a putative tumor‐suppressive miRNA in human cancers. The aim of this study was to investigate the functional significance of the miR‐143/145 cluster in cancer cells and to identify novel molecular targets of the miR‐143/145 cluster in renal cell carcinoma (RCC). The expression levels of miR‐143 and miR‐145 were significantly downregulated in RCC tissues compared with adjacent non‐cancerous tissues. A significant positive correlation was recognized between miR‐143 and miR‐145 expression. Restoration of mature miR‐143 or miR‐145 in 786‐O and A498 RCC cells revealed that both mature miRNAs significantly inhibited cancer cell proliferation and invasion, suggesting that the miR‐143/145 cluster functioned as a tumor suppressor in RCC. Gene expression data and in silico database analysis showed that the hexokinase‐2 (HK2) gene, which encodes a glycolytic enzyme crucial for the Warburg effect in cancer cells, was a candidate target of the miR‐143/145 cluster. Luciferase reporter assays showed that both miR‐143 and miR‐145 directly regulated HK2. In RCC clinical specimens, the expression of HK2 was significantly higher in cancer tissues than in non‐cancerous tissues. Silencing HK2 suppressed RCC cell proliferation and invasion, suggesting that HK2 has oncogenic functions in RCC. Thus, our data showed that loss of the tumor‐suppressive miR‐143/145 cluster enhanced RCC cell proliferation and invasion through targeting HK2.
Renal cell carcinoma (RCC) is a disease in which cancer cells form in the tubules of the kidney. Globally, the incidence and mortality rates of RCC are increasing 2–3% per decade.1 The 5‐year survival rate of advanced‐stage RCC is very poor (5–10%) due to recurrence or distant metastasis.2 The latest treatment for RCC includes molecular targeted therapies, which have been developed and are being widely used for patients with metastatic or recurrent RCC. However, these types of therapies are not expected to have curative effects.3 Therefore, to improve outcomes in patients with RCC, it is necessary to fully elucidate the molecular mechanisms of RCC.
The discovery of non‐coding RNAs (ncRNAs) in the human genome was an important conceptual breakthrough in the post‐genome sequencing era,4 and it is now evident that improved understanding of ncRNAs is necessary for continued progress in cancer research. MicroRNAs (miRNAs) are endogenous small ncRNA molecules (19–22 bases in length) that regulate protein‐coding gene expression by repressing translation or cleaving RNA transcripts in a sequence‐specific manner.5 Currently, 2578 human mature miRNAs are registered at miRBase (release 20, June 2013; http://www.mirbase.org/). miRNAs are unique in their ability to regulate multiple protein‐coding genes and are predicted to regulate more than 60% of the protein‐coding genes in the human genome.6
A growing body of evidence suggests that miRNAs are aberrantly expressed in many human cancers and that they play significant roles in the initiation, development, and metastasis of those cancers.7 Some highly expressed miRNAs can function as oncogenes by repressing tumor suppressors, whereas low‐level miRNAs can function as tumor suppressors by negatively regulating oncogenes.8 It is believed that normal regulatory mechanisms can be disrupted by the aberrant expression of tumor‐suppressive or oncogenic miRNAs in cancer cells. Therefore, identification of aberrantly expressed miRNAs is an important first step toward elucidating miRNA‐mediated oncogenic pathways.
Our laboratory and other research groups have constructed miRNA expression signatures to seek out differentially expressed miRNAs in human cancer cells.7, 9, 10 According to miRNA signatures, miR‐143 and miR‐145 are the most frequently downregulated miRNAs in various types of human cancers.11, 12 Both miR‐143 and miR‐145 are known to be located close together on human chromosome 5q32, where they form a cluster.13 Several reports have suggested that these clustered miRNAs function as tumor suppressors, targeting several oncogenic genes.11, 12 However, functional analysis of this cluster has not yet been carried out in RCC.
The aim of the present study was to investigate the functional significance of the miR‐143/145 cluster and to identify the molecular targets regulated by these miRNAs in RCC cells. Our in silico and gene expression analyses of the miR‐143/145 cluster showed that several oncogenes were possible targets of these miRNAs. To validate these targets, we focused on the hexokinase‐2 (HK2) gene and investigated its functional significance in RCC. In malignant cells, the rate of glucose uptake is significantly accelerated, and oxidative phosphorylation in mitochondria is often decreased compared to normal cells. This change is termed the aerobic glycolysis effect or the Warburg effect.14 The glycolytic enzyme HK2 is crucial for the Warburg effect in cancer cells. It catalyzes the essentially irreversible first step of the glycolytic pathway in which glucose is phosphorylated to glucose‐6‐phosphate with concomitant dephosphorylation of ATP.15
Thus, the current elucidation of novel tumor‐suppressive miR‐143/145‐mediated cancer pathways and target genes provides insights into the potential mechanisms of RCC oncogenesis and suggests novel therapeutic strategies for treatment of RCC.
Material and Methods
Clinical specimens and tissue collection
A total of 18 pairs of clear cell RCC and adjacent non‐cancerous specimens were collected from patients who had undergone radical nephrectomies at Kagoshima University Hospital (Kagoshima, Japan). Patient characteristics and representative pathological features are shown in Table S1. The samples were processed and stored in RNAlater (Qiagen, Valencia, CA, USA) at −20°C until RNA extraction. These specimens were staged according to the American Joint Committee on Cancer–Union Internationale Contre le Cancer TNM classification and were histologically graded.16 Our study was approved by the Bioethics Committee of Kagoshima University; written prior informed consent and approval were given by all patients prior to enrolment in the study.
Cell culture and RNA extraction
In this study, we used two RCC cell lines, 786‐O and A498, obtained from the ATCC (Manassas, VA, USA). These cell lines are VHL‐deficient and expressed hypoxia‐inducible factor (HIF)2a under normoxic conditions; 786‐O cells have a p53 mutation whereas A498 cells contain wild‐type p53 (NCI‐60 cell line database; http://dtp.nci.nih.gov/branches/btb/ivclsp.html).17, 18 Cells were incubated in RPMI‐1640 medium supplemented with 10% FBS and maintained in a humidified incubator (5% CO2) at 37°C. Total RNA was extracted as previously described.19
Quantitative real‐time RT‐PCR
TaqMan probes and primers for HK2 (P/N: Hs00606086_m1; Applied Biosystems, Foster City, CA, USA) were assay‐on‐demand gene expression products. We followed the manufacturer's protocol for PCR conditions. Stem‐loop RT‐PCR (TaqMan MicroRNA Assays; Assay ID: 002249 for miR‐143 and 002278 for miR‐145; Applied Biosystems) was used to quantify miRNA expression according to earlier published conditions.20 To normalize the data for quantification of HK2 mRNA and the miRNAs, we used the human GUSB (P/N: Hs99999908_m1; Applied Biosystems) and U6 genes (Assay ID: 001973; Applied Biosystems), respectively, and the delta–delta Ct method was used to calculate the fold change.
Transfection with mature miRNA, siRNA, and HK2 expression vectors
As described elsewhere,20 RCC cells were transfected with 10 nM mature miRNAs using Lipofectamine RNAiMAX transfection reagent (Invitrogen, Carlsbad, CA, USA) and Opti‐MEM (Invitrogen). Pre‐miR and negative control miRNA (CN‐002000‐01‐05 for 786‐O, Thermo Fisher Scientific, Waltham, MA, USA; AM17111 for A498, Applied Biosystems) were used in gain‐of‐function experiments, whereas HK2 siRNA (HSS179238 and HSS179240, Invitrogen) and negative control siRNA (D‐001810‐10 for 786‐O, Thermo Fisher Scientific; MISSION siRNA Universal Negative Control for A498, Sigma‐Aldrich, St. Louis, MO, USA) were used in loss‐of‐function experiments. In this study, we selected different negative controls (miRNAs/siRNAs) for each cancer cell line to avoid off‐target effects.
We evaluated the transfection efficiency of the miRNAs in RCC cells based on the downregulation of protein tyrosine kinase 9 (PTK9, also known as twinfilin [TWF1]) mRNA expression after miR‐1 transfection, as described previously, using the manufacturer's recommended protocols (Applied Biosystems).21
Plasmid construction and dual‐luciferase reporter assay
According to the TargetScan database search, HK2 has three putative miR‐143 binding sites and one miR‐145 binding site in its 3′‐UTR. To check the actual binding sites of miR‐143 or miR‐145 in the HK2, we constructed a total of eight types of vectors (with target site, wild‐type; lacking target site, deletion‐type). MiRNA target sequences (three of miR‐143 sites and one of miR‐145 site) were inserted between the XhoI‐PmeI restriction sites in the 3′‐UTR of the hRluc gene in the psiCHECK‐2 vector (C8021; Promega, Madison, WI, USA). Detailed insert sequences are shown in Table S2. The RCC cells were then transfected with 15 ng vector, 10 nM miRNA, and 1 μL Lipofectamine 2000 in 100 μL Opti‐MEM. The activities of firefly and Renilla luciferases in cell lysates were recorded, as described previously.19
Cell proliferation and invasion assays
Seventy‐two hours after transfection, cell proliferation was determined with an XTT assay (Roche Applied Science, Tokyo, Japan) according to the manufacturer's instructions. Cell invasion assays were carried out using modified Boyden chambers consisting of Transwell‐precoated Matrigel membrane filter inserts with 8‐mm pores in 24‐well tissue culture plates (BD Biosciences, Bedford, MA, USA), as described previously.22
Screening of miR‐143‐ and miR‐145‐regulated genes: Pathway analysis using databases
The predicted target genes and their miRNA binding site seed regions were investigated using TargetScan (release 6.2, http://www.targetscan.org/). The sequences of the predicted mature miRNAs were confirmed using miRBase. To identify signaling pathways regulated by miR‐143 and miR‐145 in RCC, upregulated genes targeted by these miRNAs were analyzed in terms of the Kyoto Encyclopedia of Genes and Genomes (KEGG) pathway categories using the genecodis program (http://genecodis.cnb.csic.es/).
Western blot analysis
Immunoblotting was carried out using diluted (1:500) monoclonal anti‐HK2 antibodies (SAB2701698; Sigma‐Aldrich) and anti‐GAPDH antibodies (MAB374; Chemicon, Temecula, CA, USA), as described previously.19
Statistical analysis
The relationships between two variables and the numerical values obtained by real‐time RT‐PCR were analyzed using Mann–Whitney U‐tests. The relationships among three variables and numerical values were analyzed using Bonferroni‐adjusted Mann–Whitney U‐tests. Expert StatView analysis software (version 4; SAS Institute, Cary, NC, USA) was used in both cases.
Results
Expression levels of miR‐143 and miR‐145 in cancer cell lines and RCC clinical specimens
We evaluated the expression levels of miR‐143 and miR‐145 in RCC tissues (n = 18) and adjacent non‐cancerous specimens (n = 18). Quantitative stem‐loop RT‐PCR showed that miR‐143 expression was significantly lower in clinical RCC specimens and RCC cell lines (786‐O and A498) compared with adjacent non‐cancerous tissues (P = 0.0074 and P < 0.0001, respectively; Fig. 1a). Also, miR‐145 expression was significantly reduced in clinical RCC specimens and RCC cell lines (P < 0.0001; Fig. 1b); miR‐143 expression was highly correlated with that of miR‐145 (r = 0.862, P < 0.0001, Fig. 1c).
Figure 1.
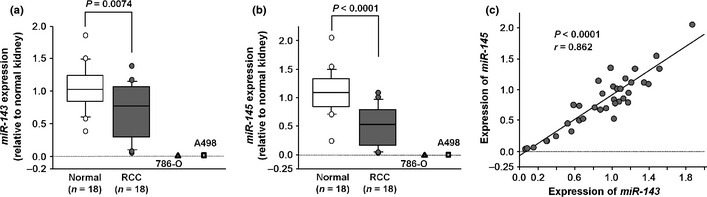
(a,b) Expression levels of miR‐143 and miR‐145 in clinical renal cell carcinoma (RCC) specimens and RCC cell lines compared with clinically normal kidneys. U6 was used as the internal control. (c) Correlation between the relative expression levels of miR‐143 (x‐axis) and miR‐145 (y‐axis). Levels are plotted as a scatterplot.
Effects of miR‐143 and miR‐145 restoration on cell proliferation and invasion in RCC cell lines
To investigate the functional role of the miR‐143/145 cluster, we carried out gain‐of‐function studies using 786‐O and A498 RCC cells that had been transfected with mature miR‐143 or miR‐145. The XTT assays indicated that cell proliferation was significantly suppressed in miR‐143 and miR‐145 transfectants compared with mock‐transfected cells, with the exception of miR‐143‐transfected 786‐O cells (P = 0.0563 and P < 0.0001; P = 0.0063 and P < 0.0001; Fig. 2a). Matrigel invasion assays showed that the number of invading cells was significantly decreased in miRNA transfectants compared with their counterparts (P < 0.0001; P < 0.0001; Fig. 2b).
Figure 2.
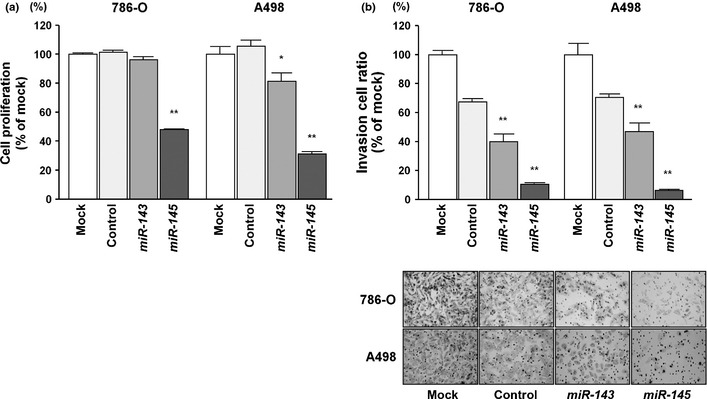
Effects of transfection with mature miR‐143 and miR‐145 on renal cell carcinoma cell lines. (a) Cell proliferation was determined with XTT assays in 768‐O and A498 cell lines after 72 h of transfection with 10 nM miR‐143, miR‐145, miR‐control, or mock transfection. (b) Cell invasion activity was determined by Matrigel invasion assay. *P < 0.01; **P < 0.0001.
It is plausible that the miR‐143/145 cluster could have an important role as tumor suppressors through downregulating several oncogenes. However, we found no synergic effects of cell viability inhibition by cotransfection of mature miR‐143 and miR‐145 (Fig. S1).
Identification of target genes and molecular pathways commonly regulated by both miR‐143 and miR‐145 in RCC
To gain further insights into the molecular mechanisms and molecular targets regulated by the tumor‐suppressive miR‐143/145 cluster in RCC, we first identified putative target genes of miR‐143 or miR‐145 by searching the TargetScan database. The database revealed 3288 target genes, with a total of 421 conserved sites and 3813 poorly conserved sites for miR‐143. For miR‐145, 3247 target genes were listed, with a total of 824 conserved sites and 3267 poorly conserved sites. We extracted candidate genes that were regulated by both miR‐143 and miR‐145. Among them, 1053 genes were listed as candidate oncogenes that were regulated by the miR‐143/145 cluster. Therefore, we investigated their expression status in RCC clinical specimens and examined gene expression profiles in the GEO database (accession numbers GSE36895 and GSE22541) to evaluate upregulated or downregulated genes in RCC specimens. Among the 1053 genes, 293 genes were significantly upregulated in 53 RCC specimens compared to 23 non‐cancerous kidney tissues. Expression data for the top 20 genes are summarized in Table 1, and the next 49 genes are shown in Table S3. Furthermore, those 293 genes were assigned KEGG annotations using singular enrichment analysis of GeneCodis23, 24 to identify molecular pathways regulated by miR‐143 and miR‐145 in RCC. Seven signaling pathways were identified in this analysis (Table 2).
Table 1.
Top 20 highly expressed genes putatively regulated by miR‐143 and miR‐145 in clinical renal cell carcinoma specimens
| Entrez Gene ID | Symbol | Expression | Fold change | Description | P‐value |
|---|---|---|---|---|---|
| 3099 | HK2 | Up | 26.67 | Hexokinase 2 | 7.09E‐10 |
| 29923 | C7orf68 | Up | 17.60 | Hypoxia inducible lipid droplet‐associated | 9.62E‐10 |
| 285 | ANGPT2 | Up | 13.14 | Angiopoietin 2 | 7.09E‐10 |
| 7903 | ST8SIA4 | Up | 9.03 | ST8 alpha‐N‐acetyl‐neuraminide alpha‐2,8‐sialyltransferase 4 | 7.09E‐10 |
| 5027 | P2RX7 | Up | 8.05 | Purinergic receptor P2X, ligand‐gated ion channel, 7 | 1.56E‐08 |
| 9770 | RASSF2 | Up | 6.15 | Ras association (RalGDS/AF‐6) domain family member 2 | 7.99E‐10 |
| 2335 | FN1 | Up | 5.45 | Fibronectin 1 | 1.95E‐09 |
| 10859 | LILRB1 | Up | 5.07 | Leukocyte immunoglobulin‐like receptor, subfamily B (with TM and ITIM domains), member 1 | 7.83E‐10 |
| 3778 | KCNMA1 | Up | 4.99 | Potassium large conductance calcium‐activated channel, subfamily M, alpha member 1 | 9.22E‐10 |
| 8542 | APOL1 | Up | 4.72 | Apolipoprotein L, 1 | 6.95E‐08 |
| 1846 | DUSP4 | Up | 4.44 | Dual specificity phosphatase 4 | 5.11E‐09 |
| 56833 | SLAMF8 | Up | 4.38 | SLAM family member 8 | 3.63E‐07 |
| 6507 | SLC1A3 | Up | 4.30 | Solute carrier family 1 (glial high affinity glutamate transporter), member 3 | 1.93E‐08 |
| 55824 | PAG1 | Up | 3.99 | Phosphoprotein associated with glycosphingolipid microdomains 1 | 9.22E‐10 |
| 84687 | PPP1R9B | Up | 3.80 | Protein phosphatase 1, regulatory subunit 9B | 1.82E‐06 |
| 3587 | IL10RA | Up | 3.71 | Interleukin 10 receptor, alpha | 2.03E‐08 |
| 8832 | CD84 | Up | 3.65 | CD84 molecule | 4.00E‐09 |
| 9201 | DCLK1 | Up | 3.63 | Doublecortin‐like kinase 1 | 2.61E‐06 |
| 963 | CD53 | Up | 3.62 | CD53 molecule | 3.72E‐09 |
| 5054 | SERPINE1 | Up | 3.49 | Serpin peptidase inhibitor, clade E (nexin, plasminogen activator inhibitor type 1), member 1 | 0.00194 |
Table 2.
Top seven enriched Kyoto Encyclopedia of Genes and Genomes (KEGG) pathways based on upregulated genes that were commonly targeted by miR‐143 and miR‐145 in renal cell carcinoma
| No. of genes | Annotations | KEGG entry number | P‐value | Genes |
|---|---|---|---|---|
| 6 | RNA degradation | 3018 | 0.00142926 | PABPC1, DCP2, XRN1, NAA38, DIS3, CNOT4 |
| 9 | Endocytosis | 4144 | 0.00193920 | MDM2, IL2RA, AP2B1, ARAP2, ADRBK2, ARRB1, EEA1, CBL, SMURF1 |
| 9 | Tuberculosis | 5152 | 0.00234740 | APAF1, MAPK1, CAMK2D, HLA‐DOA, TLR6, HLA‐DPB1, IL10RA, MAPK14, EEA1 |
| 5 | Shigellosis | 5131 | 0.00589653 | MAPK1, DIAPH1, ELMO1, MAPK14, CD44 |
| 5 | Long‐term potentiation | 4720 | 0.00656683 | MAPK1, CAMK2D, NRAS, PRKX, RPS6KA3 |
| 5 | p53 signaling pathway | 4115 | 0.00735070 | APAF1, MDM2, TNFRSF10B, CCND2, SERPINE1 |
| 9 | MAPK signaling pathway | 4010 | 0.00829911 | MAPK1, NRAS, DUSP4, ELK4, TAOK1, PRKX, MAPK14, RPS6KA3, ARRB1 |
Expression of HK2 mRNA in RCC cell lines and clinical RCC specimens
To validate the functional significance of miR‐143‐ and miR‐145‐regulated genes, we focused on HK2 because it was the most highly upregulated in RCC specimens and had putative target sites for these miRNAs. Quantitative real‐time RT‐PCR analysis showed that HK2 mRNA expression was significantly higher in clinical RCC specimens than in adjacent non‐cancerous tissues (13.311 ± 2.381 and 1.000 ± 0.302, respectively, P < 0.0001; Fig. 3a). Also, HK2 mRNA expression in 786‐O and A498 cells was higher than that in normal kidney tissues (relative to the normal, 16.121 ± 4.885 and 38.591 ± 3.998, respectively, P < 0.0001; Fig. 3a). No significant relationship was found between the patients' clinicopathological characteristics and HK2 mRNA expression (data not shown).
Figure 3.
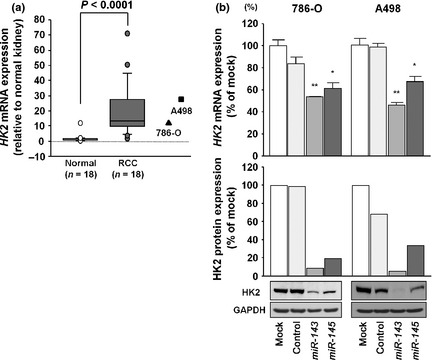
(a) Expression levels of hexokinase‐2 (HK2) mRNA in clinical renal cell carcinoma specimens and cell lines compared with clinically normal kidneys; GUSB was used as the internal control. (b, upper) HK2 mRNA expression after 24 h of transfection with 10 nM miR‐143 or miR‐145. (b, lower) HK2 protein expression after 96 h of transfection with 10 nM miR‐143 or miR‐145. GAPDH was used as a loading control. *P < 0.01; **P < 0.0001.
The correlations between HK2 mRNA expression and miR‐143 or miR‐145 expression were investigated in clinical specimens. A significant inverse correlation was recognized between HK2 and miR‐145 expression (P = 0.0085, r = −0.445; Fig. S2). In contrast, no correlation was recognized between HK2 and miR‐143 expression.
HK2 as a target of post‐transcriptional repression by miR‐143/145 cluster
Next, we carried out quantitative real‐time RT‐PCR and Western blot analysis to investigate whether HK2 mRNA and protein were downregulated by restoration of miR‐143 or miR‐145. Importantly, HK2 mRNA and protein levels were significantly repressed in miR‐143 or miR‐145 transfectants in comparison with mock‐transfected cells or miRNA‐control transfectants (Fig. 3b). Thus, we concluded that HK2 was regulated by miR‐143 and miR‐145 in RCC cells.
To determine whether the 3′‐UTR of HK2 contained an actual binding site for miR‐143 and miR‐145, we carried out luciferase reporter assays using several vectors containing the partial sequences of 3′‐UTR of HK2 mRNA, including one of the specific binding sites (for miR‐143: position 143–149, position 671–677, or position 2291–2298; for miR‐145: position 2170–2176) or each mutant vector. For miR‐143, we found that the luminescence intensity was significantly reduced only in the vector including position 2291–2298 (P < 0.001; Fig. 4). In contrast, the luminescence intensity was not decreased when the seed sequence of each target site was deleted from the vectors. For miR‐145, the luminescence intensity was significantly reduced by transfection of the wild‐type vector (position 2170–2176), whereas transfection with the deletion‐type vector blocked this decrease in luminescence (Fig. 4).
Figure 4.
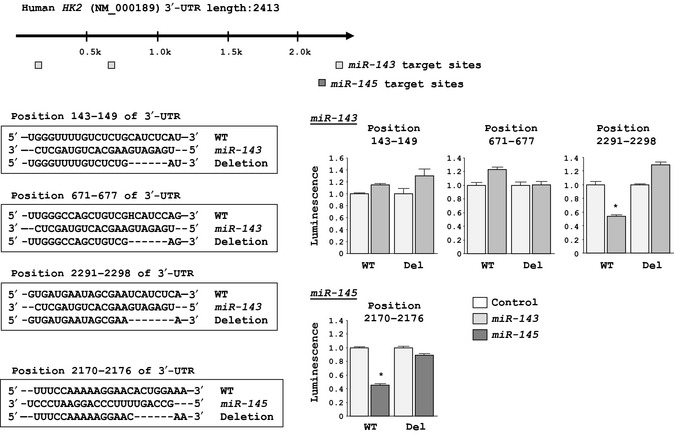
Binding sites of miR‐143 and miR‐145 in the 3′‐UTR of hexokinase‐2 (HK2) mRNA. Results of luciferase reporter assays using six vectors encoding putative miR‐143‐target sites: position 143–149 (+); position 671–677 (+); position 2291–2298 (+); and each mutated vector, in which the specific sites targeted by miR‐143 were deleted (Del). Assays also used two vectors encoding the putative miR‐145 target sites: position 2170–2176 (+); and the position‐deleted vector. Renilla luciferase values were normalized to firefly luciferase values. *P < 0.001.
Effects of HK2 knockdown on cell proliferation and invasion in RCC cells
Next, we investigated the oncogenic role of HK2 in RCC cells. The expression levels of HK2 mRNA and protein were markedly decreased in si‐HK2‐1 and si‐HK2‐2 transfectants in comparison with mock‐transfected cells and si‐control transfectants (P < 0.0001; Fig. 5a). This result showed that the two siRNAs were useful for loss‐of‐function assays in this study. Thus, to examine the functional role of HK2, we carried out loss‐of‐function studies using si‐HK2‐transfected 786‐O and A498 cells. The XTT assays indicated significant inhibition of cell proliferation in the two si‐HK2 transfectants in comparison with mock‐transfected cells and si‐control transfectants (P < 0.0001; Fig. 5b, upper). Matrigel invasion assays showed that the number of invading cells was significantly decreased in the two si‐HK2 transfectants compared with controls (P < 0.0001; Fig. 5b, lower).
Figure 5.
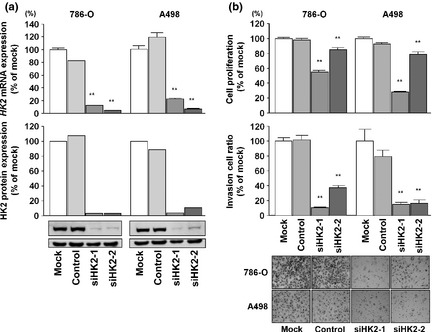
Effects of hexokinase‐2 (HK2) silencing by si‐HK2 in 786‐O and A498 renal cell carcinoma cell lines. (a, upper) HK2 mRNA expression after 24 h of transfection with 10 nM si‐HK2. (a, lower) HK2 protein expression after 72 h of transfection with 10 nM si‐HK2. GAPDH was used as a loading control. (b, upper) Cell proliferation was determined with XTT assays in 768‐O and A498 cells after 72 h of transfection with 10 nM si‐HK2 or siRNA‐control, or after mock transfection. (b, lower) Cell invasion activity was determined with the Matrigel invasion assay after 48 h of transfection with si‐HK2. **P < 0.0001.
Discussion
Accumulating evidence of abnormally expressed miRNAs in human cancers has confirmed the existence of miRNA‐mediated functions and has shown that differentially expressed miRNAs contribute to cancer initiation, development, and metastasis.7 In cancer cells, aberrant expression of miRNAs causes destruction of tightly regulated miRNA protein‐coding RNA networks. Therefore, studies of differentially expressed miRNAs in cancer cells provide important information regarding the molecular mechanisms underlying oncogenesis and metastasis. To better understand human oncogenesis, we have identified tumor‐suppressive miRNAs, miRNA‐mediated molecular pathways, and target genes based on miRNA expression signatures in several types of cancers.9, 10, 19
Analysis of downregulated miRNAs in miRNA signatures has revealed that several miRNAs form clusters in the human genome.7 Indeed, 247 human miRNAs have been found to be located in 64 clusters at inter‐miRNA distances of <5000 bp in the human genome.25 The miR‐15a/16 cluster acts as a tumor suppressor by targeting multiple oncogenes, including BCL2, MCL1, CCND1, and WNT3A.26 We previously reported that miR‐1‐1/133a‐2 and miR‐1‐2/133a‐1 formed clusters in different chromosomal loci in the human genome (i.e., 20q13.33 and 18q11.2, respectively).9, 27 These clusters are frequently expressed at reduced levels in cancer cells and function as tumor suppressors in human cancers, including RCC, where they target several oncogenes.21 As shown in our previous reports, although the seed sequences of miR‐1 and miR‐133a are different, the miR‐1/miR‐133a cluster regulates common oncogenic genes, such as transgelin‐2 and purine nucleoside phosphorylase, in cancer cells.9, 21, 27 Thus, investigating downregulated clustered miRNAs helps to elucidate important molecular mechanisms in human oncogenesis.
Studies of miRNA signatures have shown that the miR‐143/145 cluster is frequently downregulated in several types of cancers.12, 28 Also, many reports have indicated that these miRNAs function as tumor suppressors.11, 12 In this study, we confirmed that the miR‐143/145 cluster was significantly reduced in RCC and functioned as a tumor suppressor, similar to its role in other cancers. MiRNAs are unique in their ability to regulate multiple protein‐coding genes. Bioinformatic predictions have indicated that miRNAs may regulate more than 60% of the protein‐coding genes in the human genome.6 Therefore, if these clustered miRNAs function as tumor suppressors, it is important to determine the molecular pathways and target genes that these miRNAs regulate. Unfortunately, in this study we could not find more effective cell viability inhibition through cotransfection of mature miR‐143 and miR‐145 at the same time (Fig. S1). Further examinations are necessary to elucidate the interaction between the miRNAs.
In the current study, we used the TargetScan database and GEO expression data to search for oncogenes regulated by the miR‐143/145 cluster in RCC. A total of 293 genes were listed as oncogenic genes putatively regulated by the miR‐143/145 cluster. Furthermore, a total of 293 targets were categorized into known molecular pathways using KEGG pathways, seven of which, including the p53 signaling pathway, were selected. In the p53 signaling pathway, five genes (ARAF1, MDM2, TNFRSF10B, CCND2, and SERPINE1) were upregulated in RCC clinical specimens and had putative miR‐143 and miR‐145 binding sites. Among them, p53 E3 ubiquitin protein ligase homolog, double minute 2 protein (MDM2) and serpin peptidase inhibitor, clade E, member 1 (SERPINE1)/plasminogen activator inhibitor‐1 have been reported to be directly regulated by the miR‐143/145 cluster in human cancers.11, 12 These findings support the accuracy of our list of oncogenes targeted by the miR‐143/145 cluster in this study.
Based on recent miRNA studies, novel cancer pathways mediated by miR‐145 have been identified. The tumor suppressor p53 induces the expression of miR‐145 by interaction with a potential p53 response element in the miR‐145 promoter region.29 In the current study, we used two RCC cell lines, 786‐O and A498, which show very low expression levels of miR‐143/145. The NCI‐60 cell line database (http://dtp.nci.nih.gov/branches/btb/ivclsp.html) indicates that 786‐O has a p53 mutation whereas A498 contains wild‐type p53. However, p53 phosphorylation was not actually induced in either wild‐type 786‐O or A498 cells.18 These facts might be the reason why miR‐143/145 expressions were strongly repressed in 786‐O and A498.
Moreover, c‐Myc, a well‐known oncogene that plays an important role in human cancers, is directly repressed by miR‐145.29 Thus, tumor‐suppressive miR‐145, a new member of the p53 regulatory network, contributes to the direct linkage between p53 and c‐Myc in human cancer regulatory networks. Therefore, elucidation of the miR‐143/145 cluster‐mediated molecular network provides important information to the cancer research field.
Several key molecules of human cancer such c‐Myc, HIF1a, and p53 are found to be master regulators of metabolism. Recent studies indicate the interplay between miRNAs and oncogenes / tumor suppressor genes (c‐Myc and p53), through key metabolic enzyme effectors, which could facilitate the Warburg effect in cancer cells.30, 31 For example, p53‐inducible miR‐34a inhibited key metabolic enzymes such as HK2, HK1, glucose‐6‐phosphate isomerase, and pyruvate dehydrogenase kinase‐1.32 Therefore, silencing of the p53 expression induces glycolysis in cancer cells and might be promoted to cancer cell proliferation, invasion, and resistance of apoptosis. In this study, we focused on the HK2 gene and investigated the putative targets of the miR‐143/145 cluster and its functional role in RCC. Although there was no significant relationship between HK2 expression and clinicopathological parameters, including tumor stage, tumor grade, or patient prognosis, due to the small size of the cohort, we found significantly elevated expression of HK2 mRNA in clinical RCC specimens in comparison with adjacent normal tissues. Furthermore, we showed that HK2 was directly regulated by miR‐143 and miR‐145. Although similar results have been reported in other cancers, such as colorectal cancer and head and neck squamous cell carcinoma, in which HK2 was revealed to be regulated by only miR‐143,33, 34 this is the first report showing that HK2 was directly regulated by miR‐143 and miR‐145.
Cancer cells have a characteristic metabolic phenotype, termed aerobic glycolysis or the Warburg effect, whereby there is increased metabolism of glucose to lactate in the presence of sufficient oxygen.14 The glycolytic enzyme HK2 is crucial for the Warburg effect in cancer cells.15 Thus, we also investigated the functional role of HK2 in RCC cells. Silencing of HK2 in RCC cells significantly inhibited cancer cell proliferation and invasion, suggesting that HK2 functioned as an oncogene in RCC. These data indicated that the tumor‐suppressive miR‐143/145‐HK2 pathway may represent a new target in the development of therapies to treat RCC. Glycolytic enzymes including HK1, HK2, glucose transporter protein type 1 (GLUT1), and GLUT3 appear to have other functions, such as resistance to apoptosis and invasiveness, that directly contribute to human oncogenesis.35 Several reports indicated that the binding capacity and activity of HK2 to mitochondria were significantly elevated in cancer cells and this phenomenon might be controlled to prevent apoptosis.36 In a clinical study, overexpression of HK2 was associated with brain metastasis of breast cancer.37 The detailed molecular mechanisms that overexpression of HK2 causes in cancer cell invasion and metastasis are still unclear and it is a future research theme. Interestingly, we also found that GLUT1 was overexpressed in RCC cells and that GLUT1 was directly regulated by tumor‐suppressive miR‐1291.38 A facilitator of the transport of glucose across the plasma membranes of mammalian cells,39 GLUT1 is also responsible for the low level of basal glucose uptake required to sustain respiration in all cells.39 Our results (and other studies) indicated that tumor suppressive miRNA contributed to the regulation of glucose metabolism in cancer cells.
A unique aspect of miRNA biogenesis is that one miRNA regulates many protein‐coding genes. At present, it is not clear how an miRNA or a cluster of miRNAs, especially the miR‐143/145 cluster, is downregulated. In fact, the nature of the network of miRNAs and protein‐coding genes in the human genome remains to be clarified. Further examinations are necessary to develop a better understanding of underlying cancer mechanisms.
In conclusion, the miR‐143/145 cluster was significantly downregulated in RCC clinical specimens and appeared to function as a tumor suppressor through regulation of oncogenic HK2 in RCC. Elucidation of the cancer pathways and target genes regulated by the tumor‐suppressive miR‐143/145 cluster could provide new information on potential therapeutic targets in the treatment of RCC.
Disclosure Statement
The authors declare no conflict of interest.
Supporting information
Fig. S1. Effects of miR‐143 and miR‐145 transfection on 786‐O and A498 renal cell carcinoma cells. Suppression effects of 786‐O and A498 cell proliferation after transfection with miR‐143, miR‐145, and cotransfection of miR‐143 and miR‐145 as determined by XTT assay. *P < 0.0005; **P < 0.0001.
Fig. S2. Inverse correlations between hexokinase‐2 (HK2) mRNA and miR‐143 or miR‐145 expression in RCC clinical specimens.
Table S1. Patient characteristics.
Table S2. Insert sequences of wild‐type and deletion vectors for luciferase assay.
Table S3. Last 49 highly expressed genes regulated by the putative targets miR‐143 and miR‐145 in clinical renal cell carcinoma specimens.
Acknowledgments
This study was supported by the Ministry of Education, Sciences, Sports, and Culture of Japan, Grants‐in‐Aid for Science Research (B and C), 23501298 and 23592340.
(Cancer Sci 2013; 104: 1567–1574)
References
- 1. Gupta K, Miller JD, Li JZ, Russell MW, Charbonneau C. Epidemiologic and socioeconomic burden of metastatic renal cell carcinoma (mRCC): a literature review. Cancer Treat Rev 2008; 34: 193–205. [DOI] [PubMed] [Google Scholar]
- 2. Hadoux J, Vignot S, De La Motte Rouge T. Renal cell carcinoma: focus on safety and efficacy of temsirolimus. Clin Med Insights Oncol 2010; 4: 143–54. [DOI] [PMC free article] [PubMed] [Google Scholar]
- 3. Margulis V, Master VA, Cost NG et al International consultation on urologic diseases and the European Association of Urology international consultation on locally advanced renal cell carcinoma. Eur Urol 2011; 60: 673–83. [DOI] [PubMed] [Google Scholar]
- 4. Carthew RW, Sontheimer EJ. Origins and mechanisms of miRNAs and siRNAs. Cell 2009; 136: 642–55. [DOI] [PMC free article] [PubMed] [Google Scholar]
- 5. Bartel DP. MicroRNAs: genomics, biogenesis, mechanism, and function. Cell 2004; 116: 281–97. [DOI] [PubMed] [Google Scholar]
- 6. Friedman RC, Farh KK, Burge CB, Bartel DP. Most mammalian mRNAs are conserved targets of microRNAs. Genome Res 2009; 19: 92–105. [DOI] [PMC free article] [PubMed] [Google Scholar]
- 7. Calin GA, Croce CM. MicroRNA signature in human cancers. Nat Rev Cancer 2006; 6: 857–66. [DOI] [PubMed] [Google Scholar]
- 8. Esquela‐Kerscher A, Slack FJ. Oncomirs‐microRNAs with a role in cancer. Nat Rev Cancer 2006; 6: 259–69. [DOI] [PubMed] [Google Scholar]
- 9. Yoshino H, Chiyomaru T, Enokida H et al The tumor suppressive function of miR‐1 and miR‐133a targeting TAGLN2 in bladder cancer. Br J Cancer 2010; 104: 808–18. [DOI] [PMC free article] [PubMed] [Google Scholar]
- 10. Fuse M, Kojima S, Enokida H et al Tumor suppressive microRNAs (miR‐222 and miR‐31) regulate molecular pathways based on microRNA expression signature in prostate cancer. J Hum Genet 2012; 57: 691–9. [DOI] [PubMed] [Google Scholar]
- 11. Zhang J, Sun Q, Zhang Z, Ge S, Han ZG, Chen WT. Loss of microRNA‐143/145 disturbs cellular growth and apoptosis of human epithelial cancers by impairing the MDM2‐p53 feedback loop. Oncogene 2013; 32: 61–9. [DOI] [PubMed] [Google Scholar]
- 12. Villadsen SB, Bramsen JB, Ostenfeld MS et al The miR‐143/‐145 cluster regulates plasminogen activator inhibitor‐1 in bladder cancer. Br J Cancer 2012; 106: 366–74. [DOI] [PMC free article] [PubMed] [Google Scholar]
- 13. Dostalova Merkerova M, Krejcik Z, Votavova H, Belickova M, Vasikova A, Cermak J. Distinctive microRNA expression profiles in CD34+ bone marrow cells from patients with myelodysplastic syndrome. Eur J Hum Genet 2011; 19: 313–9. [DOI] [PMC free article] [PubMed] [Google Scholar]
- 14. Warburg O. On the origin of cancer cells. Science 1956; 123: 309–14. [DOI] [PubMed] [Google Scholar]
- 15. Mathupala SP, Ko YH, Pedersen PL. Hexokinase II: cancer's double‐edged sword acting as both facilitator and gatekeeper of malignancy when bound to mitochondria. Oncogene 2006; 25: 4777–86. [DOI] [PMC free article] [PubMed] [Google Scholar]
- 16. Sobin LH, Gospodarowicz MK, Wittenkind C. TNM Classification of Malignant Tumour, 7th edn New York: Wiley–Liss Inc., 2009; 255–7. [Google Scholar]
- 17. Stickle NH, Cheng LS, Watson IR et al Expression of p53 in renal carcinoma cells is independent of pVHL. Mutat Res 2005; 578: 23–32. [DOI] [PubMed] [Google Scholar]
- 18. Bertout JA, Majmundar AJ, Gordan JD et al HIF2alpha inhibition promotes p53 pathway activity, tumor cell death, and radiation responses. Proc Natl Acad Sci U S A 2009; 106: 14391–6. [DOI] [PMC free article] [PubMed] [Google Scholar]
- 19. Hidaka H, Seki N, Yoshino H et al Tumor suppressive microRNA‐1285 regulates novel molecular targets: aberrant expression and functional significance in renal cell carcinoma. Oncotarget 2012; 3: 44–57. [DOI] [PMC free article] [PubMed] [Google Scholar]
- 20. Nohata N, Hanazawa T, Kikkawa N et al Caveolin‐1 mediates tumor cell migration and invasion and its regulation by miR‐133a in head and neck squamous cell carcinoma. Int J Oncol 2011; 38: 209–17. [PubMed] [Google Scholar]
- 21. Kawakami K, Enokida H, Chiyomaru T et al The functional significance of MiR‐1 and miR‐133a in renal cell carcinoma. Eur J Cancer 2012; 48: 827–36. [DOI] [PubMed] [Google Scholar]
- 22. Nohata N, Sone Y, Hanazawa T et al miR‐1 as a tumor suppressive microRNA targeting TAGLN2 in head and neck squamous cell carcinoma. Oncotarget 2011; 2: 29–42. [DOI] [PMC free article] [PubMed] [Google Scholar]
- 23. Carmona‐Saez P, Chagoyen M, Tirado F, Carazo JM, Pascual‐Montano A. GENECODIS: a web‐based tool for finding significant concurrent annotations in gene lists. Genome Biol 2007; 8: R3. [DOI] [PMC free article] [PubMed] [Google Scholar]
- 24. Nogales‐Cadenas R, Carmona‐Saez P, Vazquez M et al GeneCodis: interpreting gene lists through enrichment analysis and integration of diverse biological information. Nucleic Acids Res 2009; 37: W317–22. [DOI] [PMC free article] [PubMed] [Google Scholar]
- 25. Chhabra R, Dubey R, Saini N. Cooperative and individualistic functions of the microRNAs in the miR‐23a~27a~24‐2 cluster and its implication in human diseases. Mol Cancer 2010; 9: 232. [DOI] [PMC free article] [PubMed] [Google Scholar]
- 26. Aqeilan RI, Calin GA, Croce CM. miR‐15a and miR‐16‐1 in cancer: discovery, function and future perspectives. Cell Death Differ 2010; 17: 215–20. [DOI] [PubMed] [Google Scholar]
- 27. Kojima S, Chiyomaru T, Kawakami K et al Tumour suppressors miR‐1 and miR‐133a target the oncogenic function of purine nucleoside phosphorylase (PNP) in prostate cancer. Br J Cancer 2012; 106: 405–13. [DOI] [PMC free article] [PubMed] [Google Scholar]
- 28. Nohata N, Hanazawa T, Kikkawa N et al Tumour suppressive microRNA‐874 regulates novel cancer networks in maxillary sinus squamous cell carcinoma. Br J Cancer 2011; 105: 833–41. [DOI] [PMC free article] [PubMed] [Google Scholar]
- 29. Sachdeva M, Zhu S, Wu F et al p53 represses c‐Myc through induction of the tumor suppressor miR‐145. Proc Natl Acad Sci U S A 2009; 106: 3207–12. [DOI] [PMC free article] [PubMed] [Google Scholar]
- 30. Vousden KH, Ryan KM. p53 and metabolism. Nat Rev Cancer 2009; 9: 691–700. [DOI] [PubMed] [Google Scholar]
- 31. Wu W, Zhao S. Metabolic changes in cancer: beyond the Warburg effect. Acta Biochim Biophys Sin (Shanghai) 2013; 45: 18–26. [DOI] [PubMed] [Google Scholar]
- 32. Kim HR, Roe JS, Lee JE, Cho EJ, Youn HD. p53 regulates glucose metabolism by miR‐34a. Biochem Biophys Res Commun 2013; 437: 225–31. [DOI] [PubMed] [Google Scholar]
- 33. Gregersen LH, Jacobsen A, Frankel LB, Wen J, Krogh A, Lund AH. MicroRNA‐143 down‐regulates Hexokinase 2 in colon cancer cells. BMC Cancer 2012; 12: 232. [DOI] [PMC free article] [PubMed] [Google Scholar]
- 34. Peschiaroli A, Giacobbe A, Formosa A et al miR‐143 regulates hexokinase 2 expression in cancer cells. Oncogene 2013; 32: 797–802. [DOI] [PubMed] [Google Scholar]
- 35. Kim JW, Dang CV. Multifaceted roles of glycolytic enzymes. Trends Biochem Sci 2005; 30: 142–50. [DOI] [PubMed] [Google Scholar]
- 36. Johnson RF, Perkins ND. Nuclear factor‐κB, p53, and mitochondria: regulation of cellular metabolism and the Warburg effect. Trends Biochem Sci 2012; 37: 317–24. [DOI] [PubMed] [Google Scholar]
- 37. Palmieri D, Fitzgerald D, Shreeve SM. Analyses of resected human brain metastases of breast cancer reveal the association between up‐regulation of hexokinase 2 and poor prognosis. Mol Cancer Res 2009; 7: 1438–45. [DOI] [PMC free article] [PubMed] [Google Scholar]
- 38. Yamasaki T, Seki N, Yoshino H et al Tumor‐suppressive microRNA‐1291 directly regulates glucose transporter 1 (GLUT1) in renal cell carcinoma. Cancer Sci 2013; 104: 1411–9. [DOI] [PMC free article] [PubMed] [Google Scholar]
- 39. Macheda ML, Rogers S, Best JD. Molecular and cellular regulation of glucose transporter (GLUT) proteins in cancer. J Cell Physiol 2005; 202: 654–62. [DOI] [PubMed] [Google Scholar]
Associated Data
This section collects any data citations, data availability statements, or supplementary materials included in this article.
Supplementary Materials
Fig. S1. Effects of miR‐143 and miR‐145 transfection on 786‐O and A498 renal cell carcinoma cells. Suppression effects of 786‐O and A498 cell proliferation after transfection with miR‐143, miR‐145, and cotransfection of miR‐143 and miR‐145 as determined by XTT assay. *P < 0.0005; **P < 0.0001.
Fig. S2. Inverse correlations between hexokinase‐2 (HK2) mRNA and miR‐143 or miR‐145 expression in RCC clinical specimens.
Table S1. Patient characteristics.
Table S2. Insert sequences of wild‐type and deletion vectors for luciferase assay.
Table S3. Last 49 highly expressed genes regulated by the putative targets miR‐143 and miR‐145 in clinical renal cell carcinoma specimens.