

Abstract
Biliary tract cancer (BTC) has a generally poor prognosis. Furthermore, it is difficult to distinguish BTC from benign biliary disease (BBD) with commonly used modalities. Therefore, a novel biomarker to facilitate cancer detection is highly desirable. Recent studies have reported the use of circulating microRNAs (miRNAs) as biomarkers for cancers. The purpose of this study was to evaluate whether circulating miRNA‐21 (miR‐21) could be used as a biomarker for BTC. Plasma samples were obtained from 94 BTC patients, 50 healthy volunteers (HVs), and 23 BBD patients. miR‐21 levels in the samples were measured by qRT‐PCR. Plasma miR‐21 levels in patients with BTC were significantly higher than in HVs or in patients with BBD (P < 0.0001 for both). Receiver–operator curve (ROC) curve analysis in differentiating BTC patients from HVs indicated that area under the curve (AUC), optimal sensitivity and specificity was 0.93, 85.1% and 100%, respectively, and those in differentiating BTC patients from BBD patients was 0.83, 72.3%, 91.3%, respectively. Validation of these results indicated that the negative predictive value, positive predictive value, sensitivity, specificity, and accuracy in differentiating BTC patients from HVs was 76.6%, 98.6%, 84.0%, 98.0%, and 88.9%, respectively, and those in differentiating BTC patients from BBD patients was 42.2%, 93.0%, 71.2%, 82.6%, and 72.6%, respectively. These sets of values were improved by combining miR‐21 and CA19‐9 measurements. Plasma miR‐21 is a novel diagnostic biomarker for BTC, and may be useful in distinguishing between BTC and BBD patients.
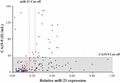
In the present study, we evaluated the usefulness of plasma miR‐21 as a diagnostic biomarker for biliary tract cancer (BTC). Judging solely by CA19‐9 levels, many BTC patients were within the normal range. More BTC patients could be diagnosed by miR‐21 levels. (Black circle, BTC patients; blue circle, HVs; red circle, BBD patients).
Biliary tract cancer (BTC) is one of the most aggressive malignant tumors, and it is associated with local invasiveness and a high rate of metastasis.1 Most BTC patients present with symptoms of biliary tract obstruction, similar to the symptoms presented by patients with benign biliary diseases (BBD).2 In addition, as a forming mass, BTC typically grows along the bile duct without projecting outward from the bile ducts; hence, commonly used diagnostic modalities, such as computed tomography (CT), magnetic resonance imaging (MRI), and ultrasonography, are often inadequate for revealing tumor lesions.3 Furthermore, the diagnostic yield for cytological diagnosis is not high.4, 5, 6 Additionally, it is difficult to distinguish between BTC and BBD by using standard tumor markers, such as carbohydrate antigen 19‐9 (CA19‐9), because they lack diagnostic accuracy.7, 8 Therefore, novel biomarkers are urgently needed for cancer detection and clinical management. We focused on circulating microRNAs as potential diagnostic biomarkers for BTC.
MicroRNAs (miRNAs) are a class of noncoding small RNAs known to post‐transcriptionally modulate gene expression by negatively regulating the stability or translational efficiency of their target mRNAs.9, 10 MiRNAs play a crucial role in almost all cellular biological processes, including metabolism, survival, differentiation, and apoptosis. Several recent studies have shown that miRNAs are stably detectable in plasma and serum.11, 12 Mitchell et al.13 reported that circulating miRNAs can originate from cancer tissues and are protected from endogenous RNase activity. This finding raises the possibility that assaying miRNAs in plasma/serum could serve as a novel approach for the noninvasive blood‐based detection of human cancers. The potential of circulating miRNAs as cancer biomarkers has been evaluated in some studies.14, 15, 16, 17, 18, 19, 20, 21 Among the candidate miRNAs evaluated as cancer biomarkers, circulating miRNA‐21 (miR‐21) has been reported to be a useful biomarker for various types of cancers.14, 19, 20, 21 miR‐21 has been reported to contribute to cancer cell proliferation, migration, invasion, and chemoresistance, and to be secreted by cancer cells.22, 23, 24 Furthermore, miR‐21 is overexpressed in human cholangiocarcinoma tissue and cell lines, and it regulates programmed cell death 4 (PDCD4) and tissue inhibitor of metalloproteinase 3 (TIMP3).25, 26 To our knowledge, there are no reports on the significance of circulating miRNAs in patients with BTC. In the present study, we evaluated whether plasma miR‐21 levels could be used as a diagnostic biomarker for BTC.
Materials and Methods
Patients and samples
Plasma samples were obtained from 94 patients with histologically proven BTC: 21 intrahepatic cholangiocarcinoma (ICC) patients, 48 bile duct cancer (BDC) patients, 14 gallbladder cancer (GBC) patients, and 11 ampulla vater cancer (APC) patients. Samples were also obtained from 23 patients with BBD. All of the samples were obtained from patients who had undergone surgical resection at Osaka University Hospital in April 2004–January 2011. The diagnosis of these patients was based on histological assessment after surgical resection. Additionally, plasma samples were collected from 50 healthy volunteers (HVs). In HVs, tumor markers, including carcinoembryonic antigen (CEA), CA19‐9, squamous cell carcinoma‐related antigen (SCC), prostate specific antigen (PSA; in men), and carbohydrate antigen 15‐3 (CA15‐3; in women), were confirmed to be within the normal range. Healthy volunteers were also confirmed to be free of malignant disease for >2 years. The clinicopathological backgrounds of the patients and HVs are shown in Table 1. After sample collection, blood samples were centrifuged at 1700 g for 20 min at 4°C to spin down the blood cells. Plasma samples were then transferred into fresh collection tubes and stored at −80°C until further processing.
Table 1.
Clinicopathological characteristics of patients with biliary tract cancer or benign biliary disease and healthy volunteers
| Characteristics | BTC patients (n = 94) | BBD patients (n = 23) | HVs (n = 50) | ||
|---|---|---|---|---|---|
| Gender (men/women) | 56/38 | 12/11 | 37/13 | ||
| Age (years)a | 66 ± 9 | 56 ± 14 | 61 ± 9 | ||
| Disease type | Intrahepatic chorangiocarcinoma | 21 | Gallstone | 3 | |
| Biliary duct cancer | 48 | Cholecystitis | 8 | ||
| Gallbladder cancer | 14 | Adenomyomatosis | 1 | ||
| Ampulla of vater cancer | 11 | Gallbladder polyp | 2 | ||
| Cholangitis | 1 | ||||
| Choledocal cyst | 3 | ||||
| Malfusion of pancreaticobiliary duct | 1 | ||||
| Bile duct dysplasia | 1 | ||||
| Postoperative stenosis | 1 | ||||
| CA19‐9 (U/mL)a | 161 ± 605 | 12.1 ± 9.8 | 3 ± 5 | ||
| ≤37 | 60 | 23 | |||
| >37 | 34 | 0 | |||
| Maximum tumor size (cm)a | 3.2 ± 2.3 | ||||
| Tumor number: single/multiple | 91/3 | ||||
| T factor: T1/T2/T3/T4 | 13/22/49/10 | ||||
| Lymph node metastasis: negative/positive | 50/44 | ||||
| TNM staging: I/II/III/IV | 15/35/27/17 | ||||
| Curative/non‐curative resection | 69/25 | ||||
Data are mean ± standard deviation. CA19‐9, carbohydrate antigen 19‐9.
Study design
First, we examined whether plasma miR‐21 expression levels are profoundly affected by the existence of cancer in the body and plasma miR‐21 may be a biomarker for BTC. Plasma miR‐21 expression was measured in the 10 BTC patients before and after curative resection. In addition, plasma miR‐21 expression in the 94 BTC patients was compared to that of the 50 HVs. Then receiver–operator curve (ROC) curve analysis was conducted to evaluate the diagnostic power of plasma miR‐21 to differentiate between BTC patients and HVs. In the next phase, the significance of plasma miR‐21 in differentiating BTC patients from BBD patients was examined. Furthermore, we evaluated the utility of plasma miR‐21 as a diagnostic biomarker compared to CA19‐9.
The aim of the study was explained in detail to all patients, and written informed consent was obtained from the patients before enrollment in the study. The study protocol was approved by the Human Ethics Review Committee of Osaka University Hospital.
RNA extraction
Total RNA was extracted from 400 μL of plasma with a mirVana PARIS Kit (Ambion, Austin, TX, USA) and eluted into 100 μL of preheated (95°C) Elution Solution according to the manufacturer's instructions. The concentration and purity of all RNA samples were evaluated by their absorbance ratio at 260/280 nm, as determined with a NanoDrop ND‐1000 spectrophotometer (NanoDrop Technologies, Rockland, DE, USA).
Quantification of microRNA by quantitative real‐time PCR
Amounts of miRNAs were quantified by quantitative real‐time PCR (qRT‐PCR) using the human TaqMan MicroRNA Assay Kit (Applied Biosystems, Foster City, CA, USA). The reverse transcription reaction was carried out with the TaqMan MicroRNA Reverse Transcription Kit (Applied Biosystems) in 15 μL containing 5 μL of RNA extract, 1.5 μL of 10× reverse transcription buffer, 0.15 μL of 100 mM dNTPs, 1 μL of MultiScribe reverse transcriptase, 0.19 μL of RNase inhibitor, 1 μL of gene‐specific primer, and 4.16 μL of nuclease‐free water. For synthesis of cDNA, the reaction mixtures were incubated with the PC818 thermal cycler (ASTEC, Fukuoka, Japan) at 16°C for 30 min, 42°C for 30 min, and 85°C for 15 min, and then held at 4°C. Then, 1.33 μL of cDNA solution was amplified by using 10 μL of TaqMan 2× Universal PCR Master Mix with No AmpErase UNG (Applied Biosystems), 1 μL of gene‐specific primer, and 7.67 μL of nuclease‐free water. Quantitative PCR was performed on the 7900HT Fast Real‐Time PCR system (Applied Biosystems), and reaction mixtures were incubated at 95°C for 10 min, followed by 45 cycles at 95°C for 15 s and 60°C for 1 min. The cycle threshold (C t) values were calculated with SDS 2.4 software (Applied Biosystems).
In the present study, expression of the target miRNAs in plasma was normalized relative to the expression of the endogenous control miR‐16. Data were analyzed by the ΔC t method: ΔC t = C t value (miR‐16) − C t value (miRNA of interest). All data were represented by value.
Statistical analysis
Differences between groups were assessed by Mann–Whitney U‐test, Fisher's exact test, or chi‐square‐test, and Steel–Dwass test was performed for multiple comparisons. Paired samples were analyzed by Wilcoxon's single‐rank test. The diagnostic value for differentiating between BTC patients and the control was assessed by calculating the area under the receiver‐operator characteristic curve (AUC). Validation of ROC results was performed by the leave‐one‐out cross‐validation method as described before.27 In the validation, first, by using the subset of all but one sample, we built a ROC model, and defined the cut‐off value in such a way that the sum of sensitivity and specificity was maximum. Then, using the cut‐off value, the model was used to predict the left‐out recorded samples. When this process was repeated for each sample, the prediction was obtained for every record in the dataset using a model that was blind to the predicted observation. All statistical analyses were performed with the use of JMP software (version 9.02; SAS Institute, Cary, NC, USA). A P‐value of <0.05 denoted the presence of a statistically significant difference.
Results
Plasma miR‐21 expression levels as a potential diagnostic biological marker
First, expression levels of plasma miR‐21 from the 10 BTC patients who underwent curative surgical resection were measured before and after surgery by qRT‐PCR. Plasma miR‐21 expression levels were significantly lower after surgery than before surgery (P < 0.05; Fig. 1). Subsequently, plasma miR‐21 expression levels were examined in the 94 patients with BTC and in the 50 HVs by qRT‐PCR. Expression levels in the patients with BTC were significantly higher than in HVs (P < 0.0001; Fig. 2). The ROC curve analysis in differentiating BTC patients from HVs indicated that the AUC for plasma miR‐21 was 0.93. At a cut‐off value of 0.17, the optimal sensitivity and specificity was 85.1%, and 100%, respectively (Fig. 3a). These results were validated by using the leave‐one‐out cross‐validation method. The results indicated that the negative predictive value (NPV), positive predictive value (PPV), sensitivity, specificity, and accuracy in differentiating BTC patients from HVs was 76.6%, 98.6%, 84.0%, 98.0%, and 88.9%, respectively (Table 2). In the next phase, plasma miR‐21 expression levels in the 23 BBD patients were measured by qRT‐PCR. Expression levels in the patients with BTC were significantly higher than in patients with BBD (P < 0.0001; Fig. 2). Next, the significance of plasma miR‐21 expression levels in differentiating BTC patients from BBD patients was also examined. The AUC was 0.83, and at a cut‐off value of 0.23, the optimal sensitivity and specificity was 72.3%, 91.3%, respectively (Fig. 3b). The validation also indicated that NPV, PPV, sensitivity, specificity, and accuracy in differentiating BTC patients from BBD patients was 42.2%, 93.0%, 71.2%, 82.6%, and 72.6%, respectively (Table 2).
Figure 1.
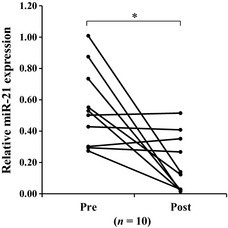
Plasma miR‐21 expression levels before and after surgery. miR‐21 expression levels in patients with biliary tract cancer (BTC) were significantly lower after surgery than before surgery (P = 0.0032). *P < 0.05.
Figure 2.

Plasma miR‐21 expression levels in biliary tract cancer (BTC) patients, benign biliary disease (BBD) patients, and healthy volunteers (HVs). Plasma miR‐21 levels in BTC patients (n = 94), BBD patients (n = 23), and in HVs (n = 50). Plasma miR‐21 expression levels were significantly higher in patients with BTC than in both HVs and BBD patients (P < 0.0001). *P < 0.05.
Figure 3.
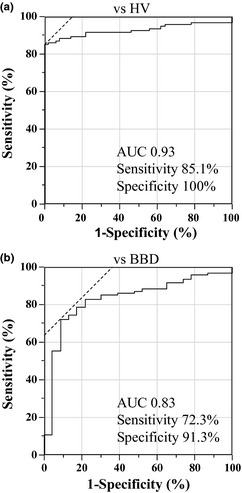
Receiver–operator curve (ROC) curve analysis for biliary tract cancer (BTC) versus healthy volunteers (HVs) and BTC versus benign biliary disease (BBD). (a) In differentiating BTC patients from HVs, the area under the curve (AUC) was 0.93, and at a cut‐off value of 0.17, the optimal sensitivity and specificity was 85.1%, and 100%, respectively. (b) In differentiating BTC patients from BBD patients, the AUC was 0.83, and at a cut‐off value of 0.23, the optimal sensitivity and specificity was 72.3%, 91.3%, respectively.
Table 2.
Diagnostic power of CA19‐9, miR‐21, and combination of CA19‐9 and miR‐21 in differentiating biliary tract cancer (BTC) patients from healthy volunteers and benign biliary disease (BBD) patients
| Biomarkers | NPV (%) | PPV (%) | Sensitivity (%) | Specificity (%) | Accuracy (%) |
|---|---|---|---|---|---|
| BTC patients versus HVs | |||||
| CA19‐9 | 45.5 | 100 | 36.2 | 100 | 58.3 |
| miR‐21 | 76.6 | 98.6 | 84.0 | 98.0 | 88.9 |
| CA19‐9 + miR‐21 | 84.7 | 100 | 90.4 | 100 | 93.8 |
| BTC patients versus BBD patients | |||||
| CA19‐9 | 27.7 | 100 | 36.1 | 100 | 48.7 |
| miR‐21 | 42.2 | 93.0 | 71.2 | 82.6 | 72.6 |
| CA19‐9 + miR‐21 | 52.5 | 97.4 | 79.8 | 91.3 | 82.1 |
CA19‐9, carbohydrate antigen 19‐9; HVs, healthy volunteers; miR‐21, microRNA‐21; NPV, negative predictive value; PPV, positive predictive value.
miR‐21 expression in patients with each type of BTC was significantly higher than in the HVs and BBD patients. miR‐21 expression levels in patients with each type of BTC and in BBD patients and HVs are summarized in Figure 4.
Figure 4.
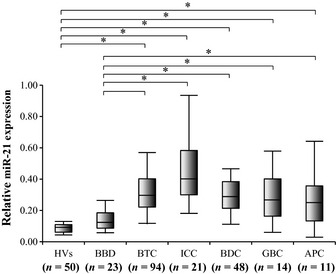
Plasma miR‐21 expression levels in each type of cancer. Bile duct cancer (BDC; n = 48), intrahepatic cholangiocarcinoma (ICC; n = 21), gallbladder cancer (GBC; n = 14), and ampulla vater cancer (APC; n = 11). Plasma miR‐21 levels in patients with each cancer type were also significantly higher than in patients with benign biliary disease (BBD)or in healthy volunteers (HVs). *P < 0.05.
Combination of plasma miR‐21 and CA19‐9 as biomarkers for BTC
The use of a combination of plasma miR‐21 and CA19‐9 levels to differentiate BTC patients from HVs or BBD patients was investigated and compared to when either marker was used individually. The miR‐21 expression levels and CA19‐9 levels of the BTC patients, BBD patients, and HVs were plotted in Figure 5. The normal range of CA19‐9 in the blood of healthy individuals is 0–37 U/mL. At a cut‐off value of 37 U/mL for CA19‐9, the NPV, PPV, sensitivity, specificity, and accuracy in differentiating BTC patients from HVs was 45.5%, 100%, 36.2%, 100%, 58.3%, and those in differentiating BTC patients from BBD patients was 27.7%, 100%, 36.1%, 100%, and 48.7%, respectively (Table 2). At the cut‐off value identified by ROC curve analysis for plasma miR‐21 and that of 37 U/mL for CA19‐9, the diagnostic power of the combination of plasma miR‐21 and CA19‐9 levels was evaluated. The NPV, PPV, sensitivity, specificity, and accuracy for the combination in differentiating BTC patients from HVs was 84.7%, 100%, 90.4%, 100%, and 93.8%, respectively, and those in differentiating BTC patients from BBD patients was 52.5%, 97.4%, 79.8%, 91.3%, and 82.1%, respectively (Table 2).
Figure 5.
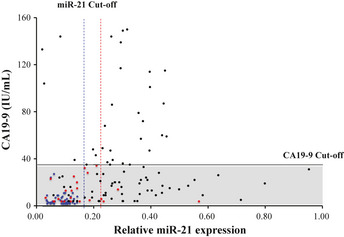
Combination of CA19‐9 and plasma miR‐21 levels. Judging solely by CA19‐9 levels, 60 biliary tract cancer (BTC) patients (63.8%) were within the normal range (marked by gray box). More BTC patients could be diagnosed by a combination of CA19‐9 and miR‐21 levels. Black circle, BTC patients; blue circle, healthy volunteers (HVs); red circle, benign biliary disease (BBD) patients; black line, cut‐off value for CA19‐9 (37 IU/mL); blue dotted line, cut‐off value for miR‐21 for differentiating BTC patients from HVs (0.17); red dotted line, cut‐off value for miR‐21 for differentiating BTC patients from HVs (0.23).
Correlation between miR‐21 expression levels and clinical and tumor‐related factors
The correlation between miR‐21 expression levels and various clinical and tumor‐related factors was examined. These factors included gender, age, CA19‐9, tumor size, T factor, lymph node metastasis, and TNM staging. Biliary tract cancer patients were divided into two groups according to their clinicopathological characteristics. As shown in Table 3, miR‐21 expression was significantly higher in patients with Stage III/IV BTC compared to those with Stage I/II BTC. miR‐21 expression increased with the progression of TNM staging, and miR‐21 expression in patients at each stage was significantly higher than in patients with BBD or in HVs (Fig. 6a). Although there was a tendency for miR‐21 expression to be higher in T3/4 patients compared to T1/2 patients, no significant difference in miR‐21 expression was found between each other (Fig. 6b). There was no correlation between miR‐21 expression and any of the other factors.
Table 3.
Plasma miR‐21 expression and clinicopathological chara‐cteristics
| Characteristics | Patients | miR‐21 expression (mean ± SD) | P‐value |
|---|---|---|---|
| Gender | |||
| Men | 56 | 0.32 ± 0.17 | 0.5504 |
| Women | 38 | 0.37 ± 0.34 | |
| Age (years)[Link] | |||
| <68 | 45 | 0.35 ± 0.20 | 0.6308 |
| ≥68 | 49 | 0.36 ± 0.35 | |
| CA19‐9 (U/mL)[Link] | |||
| ≤37 | 60 | 0.36 ± 0.32 | 0.6118 |
| >37 | 34 | 0.34 ± 0.22 | |
| Tumor size (cm)[Link] | |||
| <3.0 | 46 | 0.34 ± 0.35 | 0.1652 |
| ≥3.0 | 48 | 0.36 ± 0.21 | |
| T factor | |||
| T1, T2 | 35 | 0.29 ± 0.16 | 0.0765 |
| T3, T4 | 59 | 0.39 ± 0.34 | |
| Lymph node metastasis | |||
| Negative | 50 | 0.30 ± 0.16 | 0.1679 |
| Positive | 44 | 0.40 ± 0.38 | |
| TNM staging | |||
| I, II | 50 | 0.14 ± 0.14 | 0.0023[Link] |
| III, IV | 44 | 0.44 ± 0.37 | |
**P < 0.01. †Divided into two groups by median value. CA19‐9, carbohydrate antigen 19‐9; miR‐21, microRNA‐21.
Figure 6.
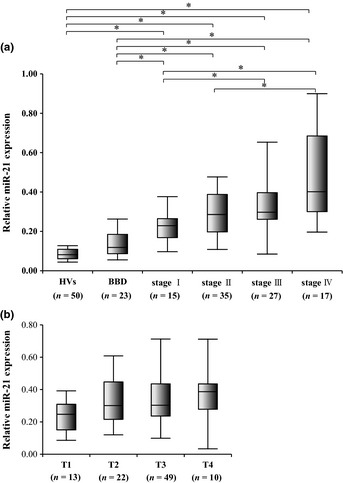
Correlation between miR‐21 expression levels and T factor, by TNM staging. (a) Mir‐21 expression levels increased with the progression of TNM staging, and miR‐21 expression in patients at each stage was significantly higher than in patients with benign biliary disease (BBD) or in healthy volunteers (HVs). (b) There was no significant difference in miR‐21 expression between each other. *P < 0.05.
Discussion
Previous studies have shown that circulating miRNAs may be potential biomarkers for several disease conditions, including human cancer. Circulating miRNA is stably expressed in serum and plasma and can be readily detected by qRT‐PCR. With this blood‐based biomarker, it might be possible to diagnose various diseases without invasive procedures. In the present study, we focused on miR‐21, which targets phosphatase and tensin homolog deleted from chromosome 10 (PTEN), programmed cell death 4 (PDCD4), and tissue inhibitor of metalloproteinase 3 (TIMP3) genes. miR‐21 has been reported to be overexpressed in the bloodstream in the presence of several types of cancers. To our knowledge, there are no previous reports on the significance of circulating miR‐21 in patients with BTC.
In the present study, the utility of plasma miR‐21 as a diagnostic biomarker in differentiating BTC from BBD was evaluated by means of a two‐phase study design. First, plasma miR‐21 expression levels in BTC patients were significantly reduced after surgery compared to before surgery, and miR‐21 level in patients with BTC were significantly higher than in HVs. Receiver–operator curve analysis in differentiating BTC patients from HVs indicated that AUC, optimal sensitivity and specificity was 0.93, 85.1% and 100%, respectively. These results suggest that plasma miR‐21 expression levels are profoundly affected by the existence of cancer in the body, and that plasma miR‐21 may be a useful biomarker for differentiating between patients with BTC and non‐cancer patients. In the next phase, we examined the usefulness of miR‐21 in differentiating BTC patients from BBD patients. Plasma miR‐21 expression levels in patients with BTC were significantly higher than in patients with BBD. Receiver–operator curve analysis in differentiating BTC patients from BBD patients indicated that AUC, optimal sensitivity and specificity was 0.83, 72.3%, 91.3%, respectively. In addition, there was a tendency for miR‐21 expression in BTC patients to increase with the progression of TNM staging; expression even in Stage I patients was significantly higher than in patients with BBD or in HVs. Based on these results, we suggest that plasma miR‐21 may be a useful biomarker in patients with very small tumors, since in these patients it may be difficult to distinguish between BTC and BBD.
CA19‐9 has been used as a diagnostic biomarker for BTC, and elevated concentrations of serum CA19‐9 (>37 U/mL) in BTC patients have been frequently reported.28, 29 In the present study, serum CA19‐9 was elevated in only 36.1% of BTC patients. CA19‐9 levels are known to be elevated under conditions of biliary tract obstruction or inflammation, but they often decrease to within normal levels when these conditions are improved by drainage and antibiotics. Thus, CA19‐9 levels may change depending on the conditions when samples are collected. Because expression of miR‐21 in patients with BBD, such as cholecystitis and cholangitis, was higher than in HVs, it is conceivable that miR‐21 expression also increases under conditions of inflammation, similar to CA19‐9. Previous reports have also shown that circulating miR‐21 expression increase in inflammatory diseases, such as ulcerative colitis and chronic hepatitis.21, 30 Nevertheless, in the present study, plasma miR‐21 sufficiently distinguished BTC patients from BBD patients. In addition, the miR‐21 expression in some patients did not change after surgical resection in the present results. In these patients, surgical stress and postoperative inflammatory response prolonged, which can induce the expression of miR‐21, because the postoperative plasma samples were collected 7–21 days after surgery.
The utility of using a combination of plasma miR‐21 and CA19‐9 levels was compared to the use of either marker individually. According to our results, plasma miR‐21 was a highly sensitive biomarker, while CA19‐9 was a highly specific marker. Thus, a combination of plasma miR‐21 and CA19‐9 levels could ameliorate the weaknesses inherent in each marker when used individually.
Circulating miR‐21 has been reported as a useful biomarker for other types of cancers, such as lymphoma, colorectal cancer, esophageal squamous cell carcinoma, and hepatoce‐llular carcinoma.14, 19, 20, 21 Thus, circulating miR‐21 is not a specific biomarker for BTC, and miR‐21 expression alone should not be relied upon for cancer detection. However, a combination of miR‐21 and other diagnostic modalities may be useful in distinguishing BTC from benign diseases.
Circulating miRNAs are known to be encapsulated in microparticles such as microvesicles, exosomes, and apoptotic bodies, and to be coupled with argonaute 2 (AGO2).24, 31, 32 Recent studies have shown that these microparticles are secreted actively from cancer cells and have important roles in cell–cell interactions.33, 34, 35 Kosaka et al.34 reported that overexpression of miRNA in cells leads to increased secretion of exosomes into the extracellular environment. Turchinovich et al. showed that miRNA/AGO2 complexes are byproducts of dead cells. Many miRNA/AGO2 complexes are thought to be released from dead or dying cells in tumor tissue.24 Thus, overexpression of miRNAs in tumor tissue may be reflected by high expression in the bloodstream. In colorectal cancer, overexpression of miR‐21 was observed in cancer‐associated fibroblasts in tumor tissue.36 Chen et al. have shown that miR‐21 expression level in cancer cells was significantly higher than in normal cholangiocyte cells in ICC tumor.25 Expression of miR‐21 in cells that compose tumor tissue differs depending on each type of cancer. In the present study, we did not evaluate miR‐21 expression in tumor tissues and the correlation between plasma miR‐21 expression levels and miR‐21 expression level in tumor tissues. Therefore, it is unclear which cell in tumor tissue is secreting miR‐21. However, the results that plasma miR‐21 expression level in the BTC patients were significant higher than in non‐cancer patients, and that plasma miR‐21 expression levels were significantly lower after surgery than before surgery suggests that circulating miR‐21 in BTC patients is released in large amounts from tumor tissue. Further analysis of miR‐21 expression in tumor tissue is necessary to assess the source of circulating miR‐21.
For the analysis of qRT‐PCR for plasma miRNA expression levels, there is no current consensus on the use of an endogenous control. Several miRNAs, including miR‐16, have been used in the normalization of circulating miRNAs. In the present study, expression of the target miRNAs in plasma was normalized relative to the expression of the endogenous control miR‐16, which was confirmed in previous reports to exist abundantly and stably in plasma.14, 16, 21 In the present analysis, we could detect miR‐16 abundantly in all samples.
In conclusion, the present study demonstrates that circulating miR‐21 is a novel and noninvasive diagnostic biomarker for BTC that could be used along with other diagnostic modalities to detect early‐stage disease. Further investigations are necessary to identify circulating miRNAs that can be used as specific biomarkers for BTC.
Disclosure Statement
The authors have no conflict of interest.
(Cancer Sci 2013; 104: 1626–1631)
References
- 1. Lazaridis KN, Gores GJ. Cholangiocarcinoma. Gastroenterology 2005; 128: 1655–67. [DOI] [PubMed] [Google Scholar]
- 2. Deng FT, Li YX, Ye L, Tong L, Yang XP, Chai XQ. Hilar inflammatory pseudotumor mimicking hilar cholangiocarcinoma. Hepatobiliary Pancreat Dis Int 2010; 9: 219–21. [PubMed] [Google Scholar]
- 3. Van Beers BE. Diagnosis of cholangiocarcinoma. HPB (Oxford) 2008; 10: 87–93. [DOI] [PMC free article] [PubMed] [Google Scholar]
- 4. Desa LA, Akosa AB, Lazzara S, Domizio P, Krausz T, Benjamin IS. Cytodiagnosis in the management of extrahepatic biliary stricture. Gut 1991; 32: 1188–91. [DOI] [PMC free article] [PubMed] [Google Scholar]
- 5. Kurzawinski T, Deery A, Dooley J, Dick R, Hobbs K, Davidson B. A prospective controlled study comparing brush and bile exfoliative cytology for diagnosing bile duct strictures. Gut 1992; 33: 1675–7. [DOI] [PMC free article] [PubMed] [Google Scholar]
- 6. Davidson B, Varsamidakis N, Dooley J et al Value of exfoliative cytology for investigating bile duct strictures. Gut 1992; 33: 1408–11. [DOI] [PMC free article] [PubMed] [Google Scholar]
- 7. Marrelli D, Caruso S, Pedrazzani C et al CA19‐9 serum levels in obstructive jaundice: clinical value in benign and malignant conditions. Am J Surg 2009; 198: 333–9. [DOI] [PubMed] [Google Scholar]
- 8. Sandanayake NS, Sinclair J, Andreola F et al A combination of serum leucine‐rich alpha‐2‐glycoprotein 1, CA19‐9 and interleukin‐6 differentiate biliary tract cancer from benign biliary strictures. Br J Cancer 2011; 105: 1370–8. [DOI] [PMC free article] [PubMed] [Google Scholar]
- 9. Bartel DP. MicroRNAs: genomics, biogenesis, mechanism, and function. Cell 2004; 116: 281–97. [DOI] [PubMed] [Google Scholar]
- 10. Calin GA, Croce CM. MicroRNA‐cancer connection: the beginning of a new tale. Cancer Res 2006; 66: 7390–4. [DOI] [PubMed] [Google Scholar]
- 11. Calin GA, Croce CM. MicroRNA signatures in human cancers. Nat Rev Cancer 2006; 6: 857–66. [DOI] [PubMed] [Google Scholar]
- 12. Chen X, Ba Y, Ma L et al Characterization of microRNAs in serum: a novel class of biomarkers for diagnosis of cancer and other diseases. Cell Res 2008; 18: 997–1006. [DOI] [PubMed] [Google Scholar]
- 13. Mitchell PS, Parkin RK, Kroh EM et al Circulating microRNAs as stable blood‐based markers for cancer detection. Proc Natl Acad Sci USA 2008; 105: 10513–8. [DOI] [PMC free article] [PubMed] [Google Scholar]
- 14. Lawrie CH, Gal S, Dunlop HM et al Detection of elevated levels of tumour‐associated microRNAs in serum of patients with diffuse large B‐cell lymphoma. Br J Haematol 2008; 141: 672–5. [DOI] [PubMed] [Google Scholar]
- 15. Liu R, Chen X, Du Y et al Serum microRNA expression profile as a biomarker in the diagnosis and prognosis of pancreatic cancer. Clin Chem 2012; 58: 610–8. [DOI] [PubMed] [Google Scholar]
- 16. Roth C, Rack B, Muller V, Janni W, Pantel K, Schwarzenbach H. Circulating microRNAs as blood‐based markers for patients with primary and metastatic breast cancer. Breast Cancer Res 2010; 12: R90. [DOI] [PMC free article] [PubMed] [Google Scholar]
- 17. Tsujiura M, Ichikawa D, Komatsu S et al Circulating microRNAs in plasma of patients with gastric cancers. Br J Cancer 2010; 102: 1174–9. [DOI] [PMC free article] [PubMed] [Google Scholar]
- 18. Zhang C, Wang C, Chen X et al Expression profile of microRNAs in serum: a fingerprint for esophageal squamous cell carcinoma. Clin Chem 2010; 56: 1871–9. [DOI] [PubMed] [Google Scholar]
- 19. Kanaan Z, Rai SN, Eichenberger MR et al Plasma miR‐21: a potential diagnostic marker of colorectal cancer. Ann Surg 2012; 256: 544–51. [DOI] [PubMed] [Google Scholar]
- 20. Komatsu S, Ichikawa D, Takeshita H et al Circulating microRNAs in plasma of patients with oesophageal squamous cell carcinoma. Br J Cancer 2011; 105: 104–11. [DOI] [PMC free article] [PubMed] [Google Scholar]
- 21. Tomimaru Y, Eguchi H, Nagano H et al Circulating microRNA‐21 as a novel biomarker for hepatocellular carcinoma. J Hepatol 2012; 56: 167–75. [DOI] [PubMed] [Google Scholar]
- 22. Asangani IA, Rasheed SA, Nikolova DA et al MicroRNA‐21 (miR‐21) post‐transcriptionally downregulates tumor suppressor Pdcd4 and stimulates invasion, intravasation and metastasis in colorectal cancer. Oncogene 2008; 27: 2128–36. [DOI] [PubMed] [Google Scholar]
- 23. Tomimaru Y, Eguchi H, Nagano H et al MicroRNA‐21 induces resistance to the anti‐tumour effect of interferon‐alpha/5‐fluorouracil in hepatocellular carcinoma cells. Br J Cancer 2010; 103: 1617–26. [DOI] [PMC free article] [PubMed] [Google Scholar]
- 24. Turchinovich A, Weiz L, Langheinz A, Burwinkel B. Characterization of extracellular circulating microRNA. Nucleic Acids Res 2011; 39: 7223–33. [DOI] [PMC free article] [PubMed] [Google Scholar]
- 25. Chen L, Yan HX, Yang W et al The role of microRNA expression pattern in human intrahepatic cholangiocarcinoma. J Hepatol 2009; 50: 358–69. [DOI] [PubMed] [Google Scholar]
- 26. Selaru FM, Olaru AV, Kan T et al MicroRNA‐21 is overexpressed in human cholangiocarcinoma and regulates programmed cell death 4 and tissue inhibitor of metalloproteinase 3. Hepatology 2009; 49: 1595–601. [DOI] [PMC free article] [PubMed] [Google Scholar]
- 27. Simon R, Radmacher MD, Dobbin K, McShane LM. Pitfalls in the use of DNA microarray data for diagnostic and prognostic classification. J Natl Cancer Inst 2003; 95: 14–8. [DOI] [PubMed] [Google Scholar]
- 28. Patel AH, Harnois DM, Klee GG, LaRusso NF, Gores GJ. The utility of CA 19‐9 in the diagnoses of cholangiocarcinoma in patients without primary sclerosing cholangitis. Am J Gastroenterol 2000; 95: 204–7. [DOI] [PubMed] [Google Scholar]
- 29. Qin XL, Wang ZR, Shi JS, Lu M, Wang L, He QR. Utility of serum CA19‐9 in diagnosis of cholangiocarcinoma: in comparison with CEA. World J Gastroenterol 2004; 10: 427–32. [DOI] [PMC free article] [PubMed] [Google Scholar]
- 30. Paraskevi A, Theodoropoulos G, Papaconstantinou I, Mantzaris G, Nikiteas N, Gazouli M. Circulating MicroRNA in inflammatory bowel disease. J Crohns Colitis 2012; 6: 900–4. [DOI] [PubMed] [Google Scholar]
- 31. Kosaka N, Iguchi H, Ochiya T. Circulating microRNA in body fluid: a new potential biomarker for cancer diagnosis and prognosis. Cancer Sci 2010; 101: 2087–92. [DOI] [PMC free article] [PubMed] [Google Scholar]
- 32. Arroyo JD, Chevillet JR, Kroh EM et al Argonaute2 complexes carry a population of circulating microRNAs independent of vesicles in human plasma. Proc Natl Acad Sci USA 2011; 108: 5003–8. [DOI] [PMC free article] [PubMed] [Google Scholar]
- 33. Simpson RJ, Lim JW, Moritz RL, Mathivanan S. Exosomes proteomic insights and diagnostic potential. Expert Rev Proteomics 2009; 6: 267–83. [DOI] [PubMed] [Google Scholar]
- 34. Kosaka N, Iguchi H, Yoshioka Y, Takeshita F, Matsuki Y, Ochiya T. Secretory mechanisms and intercellular transfer of microRNAs in living cells. J Biol Chem 2010; 285: 17442–52. [DOI] [PMC free article] [PubMed] [Google Scholar]
- 35. Taylor DD, Gercel‐Taylor C. MicroRNA signatures of tumor‐derived exosomes as diagnostic biomarkers of ovarian cancer. Gynecol Oncol 2008; 110: 13–21. [DOI] [PubMed] [Google Scholar]
- 36. Yamamichi N, Shimomura R, Inada K et al Locked nucleic acid in situ hybridization analysis of miR‐21 expression during colorectal cancer development. Clin Cancer Res 2009; 15: 4009–16. [DOI] [PubMed] [Google Scholar]