Abstract
Pyroptosis is critical for macrophages against pathogen infection, but its role and mechanism in cancer cells remain unclear. PD-L1 has been detected in the nucleus with unknown function. Here, we show that PD-L1 switches TNFα-induced apoptosis to pyroptosis in cancer cells, resulting in tumor necrosis. Under hypoxia, p-Stat3 physically interacts with PD-L1 and facilitates its nuclear translocation, enhancing gasdermin C (GSDMC) gene transcription. GSDMC is specifically cleaved by caspase-8 with TNFα treatment, generating a GSDMC N-terminal domain that forms pores on cell membrane and induces pyroptosis. Nuclear PD-L1, caspase-8, and GSDMC are required for macrophage-derived TNFα-induced tumor necrosis in vivo. Moreover, high expression of GSDMC correlates with poor survival. Antibiotic chemotherapy drugs induce pyroptosis in breast cancer. These findings identify a non-immune checkpoint function of PD-L1 and provide an unexpected concept that GSDMC/Caspas-8 mediates non-canonical pyroptosis pathway in cancer cells, causing tumor necrosis.
Keywords: PD-L1, gasdermin C, caspase-8, p-Stat3, TNFα, pyroptosis, tumor necrosis, hypoxia, cell death
Cleavage of gasdermin D (GSDMD) by caspase-1, −4, −5, or −11 defines the canonical pyroptosis pathway1-4. Most gasdermin family members, except DFNB59, are conserved, maintain similar N-terminal domain structures which harbor pore-forming activity5. Caspase-3 was reported to specifically cleave gasdermin E (GSDME), leading to chemotherapy drug-induced normal-tissue damage or viral infection-mediated secondary necrosis6, 7, revealing that GSDME also has pyroptotic potential. Interestingly, emerging evidence indicates that selective delivery of active gasdermin proteins to cancer cells or the granzyme-directed cleavage of gasdermin B (GSDMB) and GSDME in cancer cells can induce robust antitumor immunity8-10, suggesting a potential strategy for anticancer therapy by inducing pyroptosis in tumor cells. Among all six human gasdermin family members, five are associated with important biological functions, such as asthma, sepsis, and deafness; gasdermin C (GSDMC) is the only one whose biological function has not yet been identified11.
The critical immune checkpoint programmed death ligand 1 (PD-L1) suppresses anti-tumor immunity through interaction with its receptor programmed cell death protein1 (PD-1) on the cell membrane12. Blockade of the PD-L1/PD-1 interaction enhances anti-tumor immune response, provides substantial survival benefit for cancer patients, and is a major breakthrough in cancer therapy13-15. Nuclear localization of PD-L1 in circulating tumor cells or doxorubicin-treated breast cancer cells was recently reported16, 17, but the function and translocation mechanism of nuclear PD-L1 (nPD-L1) are unclear.
Tumor necrosis is initiated by hypoxic stress due to rapid tumor growth and inadequate blood supply18. Tumor necrosis has been correlated with tumor progression and increased resistance to chemotherapy and radiotherapy19. In solid tumors, tumor-associated macrophages, which secrete tumor necrosis factor α (TNFα), tend to accumulate within necrotic foci20, 21. TNFα has long been known to induce tumor necrosis22, but the molecular mechanism by which it does so has been poorly understood.
Results
Hypoxic stress induces nPD-L1 translocation through p-Y705-Stat3
To investigate the physiological role of nPD-L1, we screened for stimuli that may affect its expression levels in MDA-MB-231 cells. Among the various stimuli, including stress, autophagy, cytokines, clinical drugs, and PD-L1 antibodies, hypoxic stress induced the strongest nuclear translocation of PD-L1 (Fig. 1a). This was validated by cellular fractionation, confocal assay, and three-dimensional reconstruction of z-stack images using PD-L1 specific antibodies that have been tested by PD-L1 knockout validation (Fig. 1b-e). Nuclear localization of PD-L1 peaked after 72h under hypoxia (Fig. 1f,g). Although hypoxia is known to upregulate PD-L1 through HIF1α23, our data indicated that HIF1α is not required for PD-L1 nuclear translocation (Fig. 1h-j).
Fig. 1: PD-L1 translocates into the nucleus in response to hypoxia.
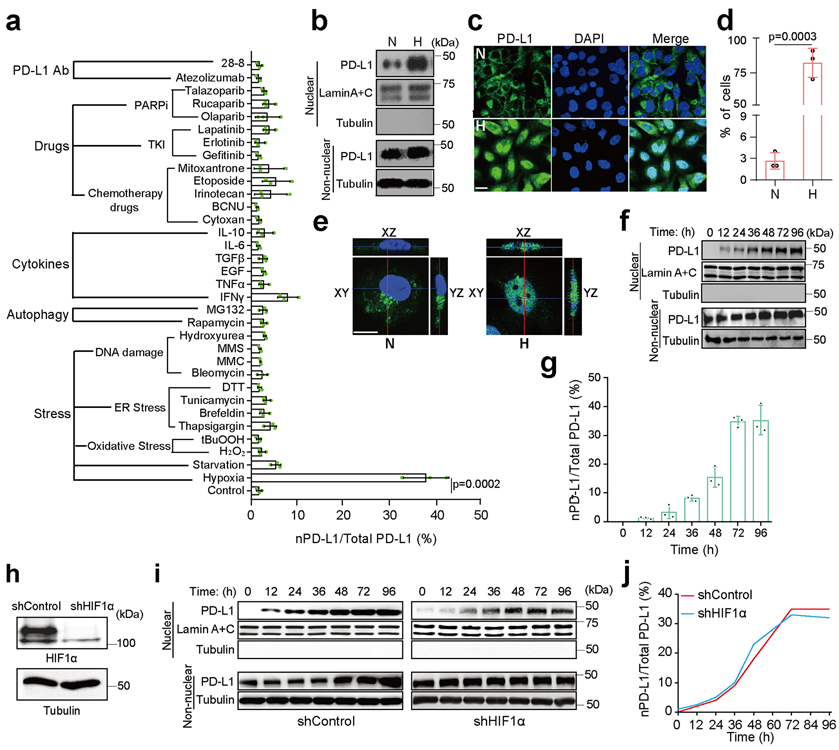
(a) The relative ratio of nPD-L1 to total PD-L1 in MDA-MB-231 cells treated with various stimuli was evaluated on the basis of immunoblot quantification using the Image J software (version 1.38x). Data are shown of n = 3 independent experiments. TKI, tyrosine kinase inhibitor; PARPi, poly (ADP-ribose) polymerase inhibitor; PD-L1 Ab, PD-L1 antibody; MMC, mitomycin C; MMS, methyl methanesulfonate; 28-8, PD-L1 antibody from clone 28-8. (b) Immunoblotting of PD-L1 after cellular fractionation in MDA-MB-231 cells. N, normoxia; H, hypoxia. Blots are representative of three independent experiments. (c) Confocal microscopy analysis of PD-L1 expression in MDA-MB-231 cells. Scale bar, 20 μm. Images are representative of three independent experiments. (d) Percentage of MDA-MB-231 cells with nPD-L1 as determined in (c). Fifty nuclei were counted in each treatment group. Data are shown of n = 3 independent experiments. (e) 3D visualization of nPD-L1 (scale bar, 20 μm). Images are representative of three independent experiments. (f) Immunoblotting of PD-L1 in cellular fractions at the indicated time points under hypoxia. The experiment was repeated three times with similar results. (g) The percentage of PD-L1 nuclear translocation under hypoxia. Diagram showing the relative ratio of nPD-L1 to total PD-L1 based on the immunoblot quantification in (f) using the Image J software. Data are shown of n = 3 independent experiments. (h) Knockdown of HIF1α using shRNA and immunoblotting validation of its protein level. The experiment was repeated three times with similar results. (i) Comparison of nPD-L1 translocation in shControl stable transfectants to that in shHIF1α under hypoxia. The experiment was repeated three times with similar results. (j) Kinetics of PD-L1 nuclear translocation under hypoxia. Diagram showing the relative ratio of nPD-L1 to total PD-L1 based on immunoblot quantification in (i) using Image J software. Data are shown of n = 3 independent experiments. All error bars represent SD. P values were determined by two-sided Student’s t-test. Statistical source data and unprocessed blots are provided in Source Data Fig. 1.
Given that Stat3-Y705 is phosphorylated in response to hypoxia24, we examined the interaction between p-Y705-Stat3 and PD-L1 in MDA-MB-231 cells. The results indicated that p-Y705-Stat3 physically interacted with PD-L1 (Fig. 2a) and the intracellular domain of PD-L1 was required for this interaction (Fig. 2b). Results from Duolink assay and three-dimensional visualization indicated that their interaction was located mainly in the nucleus (Fig. 2c,d). To determine whether p-Y705-Stat3 is required for hypoxia-induced nPD-L1, we deleted endogenous Stat3 by CRISPR/Cas9 and re-expressed equal amounts of Stat3-wild type (WT) and Stat3-Y705F mutant in MDA-MB-231 cells (Extended Data Fig. 1a,b). Indeed, nuclear translocation of PD-L1 was significantly impaired in cells with stable expression of Stat3-Y705F mutant (Fig. 2e,f). Consistently, inhibition of p-Y705-Stat3 by its inhibitor HO-3867 not only suppressed the interaction between PD-L1 and p-Y705-Stat3 (Duolink assay; Fig. 2g) but also blocked nuclear translocation of PD-L1 (Fig. 2h,i). Although PD-L1 and p-Y705-Stat3 bound to each other in the cytosol (Fig. 2g), treatment with the importin α/β inhibitor ivermectin blocked translocation of PD-L1 into the nucleus (Fig. 2h,i). Together, these results suggested that hypoxia-induced p-Y705-Stat3 associates with PD-L1 and facilitates its nuclear import via the importin α/β pathway.
Fig. 2: p-Y705-Stat3 binds to PD-L1 and facilitates its nuclear translocation under hypoxia.
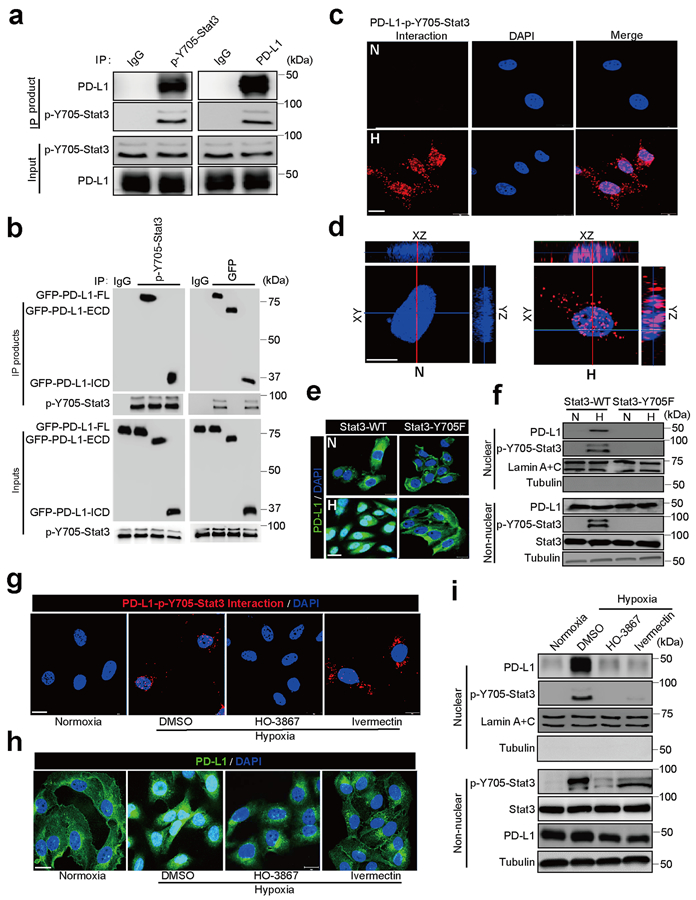
(a) Immunoprecipitation (IP) and Western blot analysis of PD-L1–p-Y705-Stat3 interaction under hypoxia in MDA-MB-231 cells. The experiment was repeated three times with similar results. (b) IP and Western blot analysis of the interaction of truncated PD-L1 with p-Y705-Stat3. PD-L1-FL, full-length PD-L1; PD-L1-ECD, PD-L1 extracellular domain; PD-L1-ICD, PD-L1 intracellular domain. The experiment was repeated three times with similar results. (c) Duolink assay (red dot: interaction between p-Y705-Stat3 and PD-L1) with antibodies specific for p-Y705-Stat3 and PD-L1. Scale bar, 20 μm. N, normoxia; H, hypoxia. The experiment was repeated three times with similar results. (d) 3D visualization of nPD-L1–p-Y705-Stat3 interaction. Scale bar, 20 μm. The experiment was repeated three times with similar results. (e) Confocal microscopy analysis of PD-L1 expression. Representative images shown. Wild-type Stat3 (Stat3-WT) or Stat3-Y705F mutant (Stat3-Y705F) were stably expressed in Stat3-knockout MDA-MB-231 cells. Scale bar, 20 μm. The experiment was repeated three times with similar results. (f) Immunoblotting of PD-L1 and p-Y705-Stat3 in the cellular fraction of the indicated MDA-MB-231 stable transfectants. The experiment was repeated three times with similar results. (g–i) MDA-MB-231 cells were treated with p-Y705-Stat3 inhibitor HO-3867 (20 μM) or importin α/β inhibitor ivermectin (25 μM). Localization of PD-L1 or PD-L1–p-Y705-Stat3 interaction (red dots) was analyzed by Duolink assay (g), confocal microscopy (h), and cellular fractionation (i). Scale bar, 20 μm. The experiments were repeated three times with similar results. Unprocessed blots are provided in Source Data Fig. 2.
nPD-L1 switches TNFα-induced apoptosis to pyroptosis
To study the biological function of nPD-L1, we sought to enrich nPD-L1 by mutating its nuclear export signal (NES). To this end, we first searched for and identified a NES sequence in PD-L1 using NetNES1.1 Server program (http://www.cbs.dtu.dk/services/NetNES/) (Extended Data Fig. 1c), then stably expressed equal amounts of NES-mutant PD-L1 (PD-L1-NES) and PD-L1-WT in the previously established MDA-MB-231 cells with PD-L1 knockout25 (Extended Data Fig. 1d). We detected increased nPD-L1 expression in PD-L1-NES cells (Fig. 3a). We then tested the effects of various cytotoxic cytokines on these cells; under TNFα plus cycloheximide (CHX) treatment, we unexpectedly observed cell swelling with large bubbles in PD-L1-NES cells but not in PD-L1-WT or PD-L1-knockout (KO) cells (Fig. 3b), suggesting that nPD-L1 is sufficient to induce pyroptosis. This observation was further validated by lactate dehydrogenase (LDH) release and increased cell death speed (Fig. 3c,d). However, nPD-L1-induced pyroptotic cell death was largely suppressed by treatment with HO-3867 (Fig. 3e) or PD-L1-nuclear localization signal (NLS) mutation (Fig. 3f) which blocked nuclear translocation of PD-L1 under hypoxia (Extended Data Fig. 1e,f), indicating that accumulation of nPD-L1 is also required for pyroptosis induction. We next asked whether the death pattern of cells treated with TNFα plus CHX switches from apoptosis to pyroptosis in response to hypoxia. Indeed, large bubbles and significantly increased LDH release were observed under hypoxia (Fig. 3g,h and Supplementary Videos 1 and 2). This hypoxia-induced pyroptosis required p-Y705-Stat3 and importin α/β (Fig. 3i-k and Supplementary Videos 2 and 3). On the basis of the PD-L1 expression level in a panel of cell lines of multiple cancer types examined previously26 and in the current study (Extended Data Fig. 2a), we selected several which exhibited high PD-L1 expression and evaluated pyroptotic cell death under hypoxia. We found that pyroptosis occurred in multiple cancer cell types, including lung, breast, liver, and ovarian cancers, and melanoma, and was blocked by p-Stat3 inhibitor HO-3867 (Extended Data Fig. 2b), indicating that nPD-L1-induced pyroptosis may be a common occurrence in cancer cells. Together, these results indicated that nPD-L1 switches TNFα-induced apoptosis to pyroptosis in tumor cells of multiple cancer types.
Fig. 3: nPD-L1 switches TNFα-induced apoptosis to pyroptosis under hypoxia.
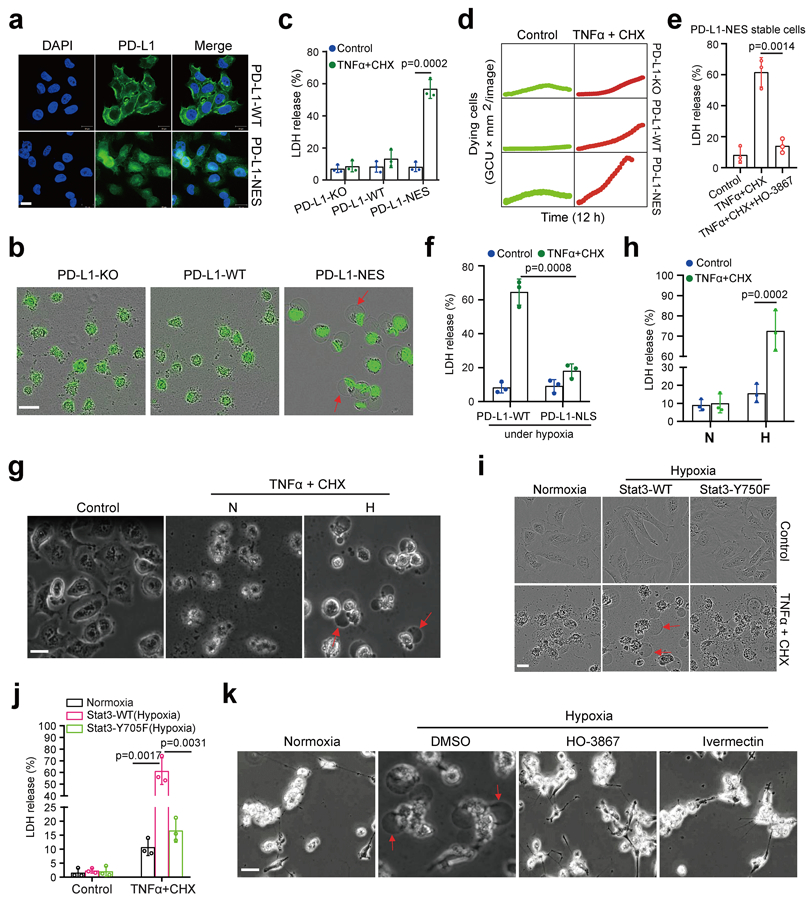
(a) Stable re-expression of WT or NES-mutated PD-L1 in the PD-L1–knockout MDA-MB-231 cells. Images of PD-L1 distribution are representative of three independent experiments. Scale bar, 20 μm. (b) Fluorescent imaging of nPD-L1-induced apoptosis-to-pyroptosis switch under TNFα plus CHX treatment. Dying cells were stained with nucleic acid dye SYTOX green. Red arrows indicate cell swelling with large bubbles. Images are representative of three independent experiments. Scale bar, 20 μm. (c) LDH-released cell death is shown as mean ± SD of n = 3 independent experiments. (d) Time-lapse microscopy quantification of dying cells treated as described in (b). (e) LDH-released cell death in PD-L1-NES stable cells treated with TNFα plus CHX and/or HO-3867. Data are shown as mean ± SD of n = 3 independent experiments. (f) MDA-MB-231-PD-L1–KO cells with stable expression of WT or NLS-mutated PD-L1 were treated with TNFα plus CHX under hypoxia. LDH-released cell death is shown as mean ± SD of n = 3 independent experiments. (g and h) MDA-MB-231 cells were treated with TNFα plus CHX under hypoxia. Representative images of dying cell morphology of three independent experiments; red arrows indicate cell swelling with large bubbles (g). Scale bar, 20 μm. LDH-released cell death is shown as mean ± SD of n = 3 independent experiments (h). N, normoxia; H, hypoxia. (I and j) MDA-MB-231 stable transfectants were treated with TNFα plus CHX under hypoxia. Representative images of dying cell morphology of three independent experiments (i). Scale bar, 20 μm. LDH-released cell death is shown as mean ± SD of n = 3 independent experiments (j). (k) MDA-MB-231 cells were co-treated with TNFα plus CHX and the p-Y705-Stat3 inhibitor HO-3867 or the importin α/β inhibitor ivermectin under hypoxia. Representative images of dying cell morphology of three independent experiments. Scale bar, 20 μm. P values of all statistical analysis were determined by two-sided Student’s t-test. Statistical source data are provided in Source Data Fig. 3.
nPD-L1 forms a complex with p-Y705-Stat3 to transcriptionally activate GSDMC expression under hypoxia
To determine whether the gasdermin family members are involved in nPD-L1–mediated pyroptosis, we screened mRNA levels of all six gasdermins in PD-L1-NES-expressing MDA-MB-231 cells. Interestingly, GSDMC but not other gasdermin family members was upregulated in the PD-L1-NES cells (Fig. 4a,b and Extended Data Fig. 3a). Similar results were obtained in MDA-MB-231 cells under hypoxia (Extended Data Fig. 3b,c). In addition, hypoxia-induced GSDMC expression was dramatically suppressed by PD-L1-NLS mutation (Extended Data Fig. 3d), Stat3-Y705F mutation (Fig. 4c,d), or treatment with HO-3867 or ivermectin (Extended Data Fig. 3e,f), indicating that nPD-L1, p-Y705-Stat3, and importin α/β are required for hypoxia-induced GSDMC expression. We used a GSDMC promoter-driven luciferase reporter assay to evaluate GSDMC transcriptional activity. Consistent with the GSDMC mRNA level, luciferase activity was significantly decreased by PD-L1-NLS mutation, Stat3-Y705F mutation, or treatment with HO-3867 or ivermectin (Fig. 4e,f and Extended Data Fig. 3g). We searched for and identified a putative p-Y705-Stat3-binding site in the GSDMC promoter using the GPMiner program (http://gpminer.mbc.nctu.edu.tw/) (Extended Data Fig. 4a). The p-Y705-Stat3-binding site mutation largely suppressed the GSDMC promoter activity under hypoxia (Fig. 4g). Sequential chromatin immunoprecipitation (ChIP)-PCR indicated that p-Y705-Stat3 partnered with PD-L1 for binding to the GSDMC promoter (Fig. 4h). Additionally, GSDME expression in MDA-MB-231 cells was nearly undetectable endogenously or under hypoxia (Extended Data Fig. 4b,c). In total, these results suggested that under hypoxia, the nPD-L1/p-Y705-Stat3 complex binds to the Stat3-binding site of the GSDMC promoter to transcriptionally activate GSDMC.
Fig. 4: nPD-L1 as co-activator together with p-Y705-Stat3 transcriptionally activates GSDMC expression in response to hypoxia.
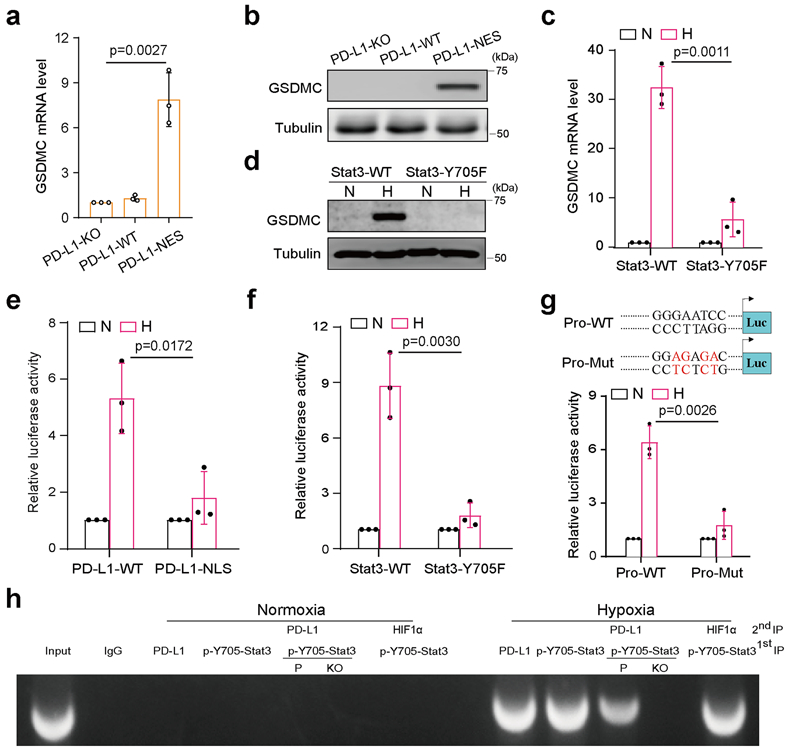
(a–d) GSDMC mRNA (a and c) and protein (b and d) levels in the indicated MDA-MB-231 stable transfectants were determined by RT-qPCR and immunoblotting, respectively. Data are shown as mean ± SD of n = 3 biologically independent experiments. Blots are representative of three independent experiments. N, normoxia; H, hypoxia. (e and f), GSDMC promoter luciferase reporter plasmids were transfected into the indicated MDA-MB-231 stable transfectants and assayed for luciferase reporter activities. Data are shown as mean ± SD of n = 3 biologically independent experiments. (g) GSDMC promoter luciferase reporter plasmids were co-transfected with PD-L1 and Stat3 in HEK293T cells and assayed for luciferase activities. Data are shown as mean ± SD of n = 3 biologically independent experiments. Pro-WT, wild-type GSDMC promoter; Pro-Mut, GSDMC promoter with predicted p-Y705-Stat3 binding site mutation (red). (h) Sequential ChIP-PCR analysis of interactions between PD-L1, p-Y705-Stat3, and GSDMC promoter. VEGF promoter which interacts with HIF1α and p-Y705-Stat3 under hypoxia as a positive control. The experiment was repeated three times with similar results. P, MDA-MB-231 parental cells; KO, MDA-MB-231-PD-L1-knockout cells. P values of all statistical analysis were determined by two-sided Student’s t-test. Statistical source data and unprocessed blots are provided in Source Data Fig. 4.
GSDMC cleavage by caspase-8 induces pyroptosis
To further validate the involvement of GSDMC in hypoxia-mediated pyroptosis, we first generated the GSDMC-knockout MDA-MB-157 cells which normally express high levels of GSDMC (Fig. 5a). Interestingly, deletion of GSDMC switched TNFα-induced pyroptosis to apoptosis (Fig. 5a,b). In contrast, enforced GSDMC expression in HeLa cells induced pyroptosis (Fig. 5c,d), indicating that GSDMC is critical for TNFα-induced pyroptosis in tumor cells. GSDMC cleavage was observed under hypoxia with TNFα plus CHX treatment (Fig. 5e). Furthermore, using a set of caspases, we showed that GSDMC protein was cleaved by caspase-6 and caspase-8 (Fig. 5f). However, only caspase-8 was activated by TNFα plus CHX (Fig. 5g), and deletion of caspase-8 blocked GSDMC cleavage (Fig. 5h,i). In line with those observations, deletion (Fig. 5j,k) or inhibition (Supplementary Videos 2 and 4) of caspase-8 switched pyroptosis to apoptosis, a phenomenon that was not observed with caspase-6 or caspase-3 inhibitor treatment (Extended Data Fig. 5), further supporting the idea that caspase-8 specifically mediates GSDMC-induced pyroptosis. Moreover, PD-L1-expressing cells (BT549 and MDA-MB-231) underwent pyroptosis with or without GSDMC expression under hypoxia. However, pyroptosis occurred only in GSDMC-positive cells (BT549) under normoxia. In PD-L1-deficient cells (Hs578T and MCF-7), pyroptosis occurred only in GSDMC-positive cells (Hs578T) under either normoxic or hypoxic condition (Extended Data Fig. 6a,b). These results suggested that the presence of GSDMC, either endogenously or induced by hypoxia/nPD-L1, leads to pyroptosis.
Fig. 5: GSDMC cleavage by caspase-8 determines hypoxia-induced apoptosis-to-pyroptosis switch with TNFα treatment.
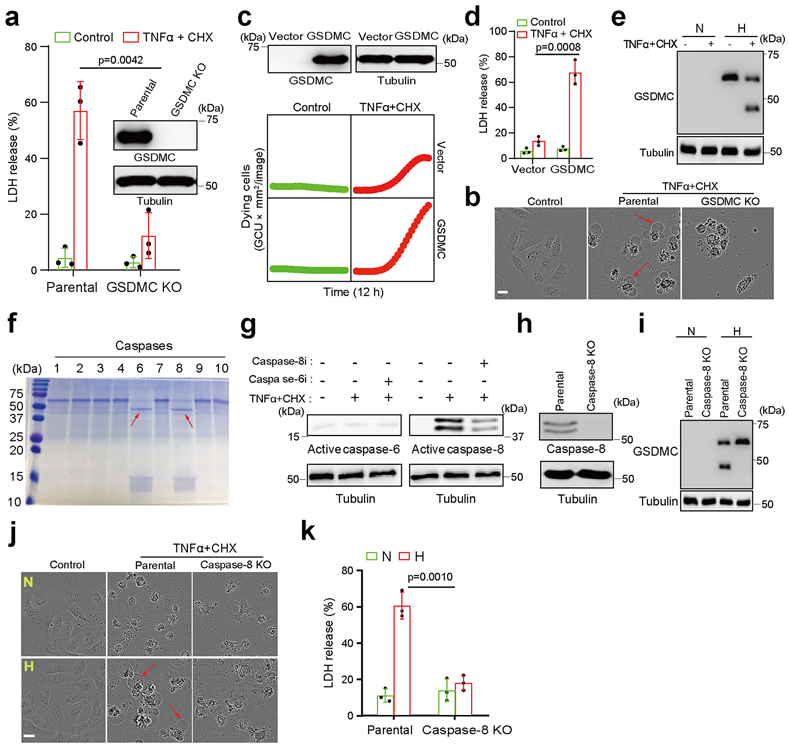
(a) % of LDH-released cell death in parental and GSDMC-knockout MDA-MB-157 cells treated with TNFα plus CHX under normoxia. Data are shown as mean ± SD of n = 3 independent experiments. (b) Representative images of dying cell morphology in (a) of three independent experiments. Red arrows indicate cell swelling with large bubbles. Scale bar, 20 μm. (c) GSDMC or vector control was transiently expressed in HeLa cells. Time-lapse microscopy quantification of dying cells treated with TNFα plus CHX under normoxia. The experiment was repeated three times with similar results. (d) LDH-released cell death in HeLa cells expressing GSDMC or vector control and treatment of TNFα plus CHX under normoxia. Data are shown as mean ± SD of n = 3 independent experiments. (e) Immunoblotting of GSDMC in MDA-MB-231 cells treated with TNFα plus CHX under hypoxia. N, normoxia; H, hypoxia. Blots are representative of three independent experiments. (f) Cleavage of human GSDMC by various active caspases. Red arrows indicate cleaved GSDMC. The experiment was repeated four times with similar results. (g) Immunoblotting of active caspase-6 and caspase-8 in MDA-MB-231 cells treated as indicated. Caspase-6i, caspase-6 inhibitor Z-VEID-FMK (10 μM); Caspase-8i, caspase-8 inhibitor Z-IETD-FMK (10 μM). Blots are representative of three independent experiments. (h) Deletion of caspase-8 by CRISPR/Cas9 in MDA-MB-231 cells. Blots are representative of three independent experiments. (i) Immunoblotting of GSDMC in parental and caspase-8–knockout MDA-MB-231 cells treated with TNFα plus CHX under hypoxia. Blots are representative of three independent experiments. (j) Representative images of dying cell morphology of three independent experiments. Parental and caspase-8-knockout MDA-MB-231 cells were treated with TNFα plus CHX under normoxia or hypoxia. Scale bar, 20 μm. (k) LDH-released cell death with and without caspase-8 knockout. Data are shown as mean ± SD of n = 3 independent experiments. P values of all statistical analysis were determined by two-sided Student’s t-test. Statistical source data and unprocessed blots are provided in Source Data Fig. 5.
GSDMC N-terminal domain (1–365) is sufficient to induce pyroptosis
We used liposomes to mimic the cell membrane and assayed the lipid-binding ability of GSDMC by mixing full-length or caspase-8-cleaved GSDMC protein with the liposomes as described previously1-5. Upon incubation with caspase-8-cleaved GSDMC, the liposome surface showed multiple pores of regular shape and size (Fig. 6a) and severe liposome leakage as indicated by Tb3+ release (Fig. 6b) compared with liposomes incubated with the positive control, caspase-1-cleaved GSDMD. On the basis of three-dimensional modeling analysis (Extended Data Fig. 7a) and the molecular weight of GSDMC fragments, we found that the N-terminal domain, but not full-length GSDMC, bound to liposomes, as evidenced by its detection in the liposome pellet (Fig. 6c, lane 4 vs. 8). To determine the function of the GSDMC N-terminal domain (GSDMC-N), we generated a GSDMC construct consisting of amino acids 1–365 (GSDMC 1–365) for mammalian expression. Confocal microscopy analysis indicated that GSDMC (1–365) was present on the cell membrane similar to that of the N-terminal domain of the positive control, GSDMD, whereas full-length GSDMC was seen in the cytosol (Extended Data Fig. 7b). Pyroptosis induced by GSDMC (1-365) was further validated by cell swelling with large bubbles and increased LDH release (Extended Data Fig. 7c,d). Although the probability of detecting endogenous gasdermin-N terminal domain in the supernatant is low as the proteins are embedded in cell membrane5, the cell lysis function of gasdermin-N terminal domain can be evaluated by its overexpression in HEK293T cells3. Indeed, the GSDMC (1-365) protein was detected in the supernatant in cells ectopically expressing Flag-GSDMC (1-365) but not in those expressing Flag-GSDMC-FL (Extended Data Fig. 7e). These findings indicated that the N-terminal domain (aa 1–365) of GSDMC is sufficient to induce pyroptosis.
Fig. 6: GSDMC N-terminal domain (aa 1–365) binds to cell membrane and induces pyroptosis.
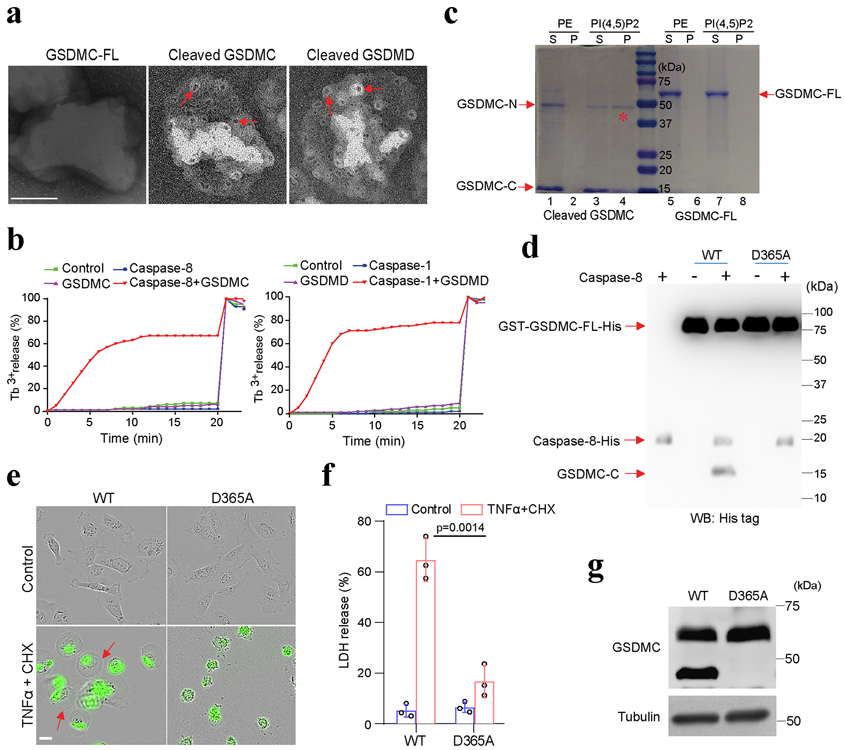
(a and b) Analysis of the pore-forming activity of caspase-8-cleaved GSDMC by high-resolution electron microscopy (a) and liposome leakage assay (b). Red arrows in (a) indicate pores. Triton X-100 was added at 20 min to achieve 100% leakage in (b). GSDMC-FL, full-length GSDMC. Scale bar, 100 nm. The experiments were repeated three times with similar results. (c) Membrane lipid-binding activity of GSDMC fragments, phosphatidylethanolamine (PE) as a negative control for liposomes. S, lipid-free supernatant; P, lipid-containing pellet; PI(4,5)P2, phosphatidylinositol-4,5-bisphosphate; GSDMC-N, N-terminal domain of GSDMC; GSDMC-C, C-terminal domain of GSDMC. The experiment was repeated three times with similar results. (d) Immunoblotting of wild-type (WT) and D365A-mutant (D365A) GSDMC proteins cleaved by caspase-8 with anti-His tag antibody. The experiment was repeated three times with similar results. (e) Fluorescent imaging of HeLa cells transfected with WT or D365A GSDMC genes and treated with TNFα plus CHX. Dying cells were stained with nucleic acid dye SYTOX green. Red arrows indicate cell swelling with large bubbles. Scale bar, 20 μm. The experiment was repeated four times with similar results. (f) LDH-released cell death is shown as mean ± SD of n = 3 biologically independent experiments. P values were determined by two-sided Student’s t-test. (g) Immunoblotting of GSDMC in HeLa cells expressing WT or D365A GSDMC and treated with TNFα plus CHX. The experiment was repeated three times with similar results. Statistical source data and unprocessed blots are provided in Source Data Fig. 6.
To identify the caspase-8 recognition site in GSDMC, we searched for consensus caspase-8 recognition motifs using CaspDB database (http://caspdb.sanfordburnham.org/). According to the molecular weight of cleaved GSDMC fragments and the potential cleavage sites in the flexible and solvent-exposed loop regions which are more readily accessible to caspase-827, we narrowed down the predicted caspase-8 cleavage sites (Extended Data Fig. 7a). By site-directed mutagenesis screening, we found that D365A-mutant GSDMC protein was completely resistant to caspase-8 cleavage (Fig. 6d), indicating that 362LELD365, which is conserved across species (Extended Data Fig. 7f), is the caspase-8 cleavage site, and this fits well with the substrate recognition motif of caspases previously reported28, 29. Indeed, D365A mutation of GSDMC protein abolished TNFα-induced pyroptosis (Fig. 6e,f) and GSDMC cleavage (Fig. 6g). These results suggested that 362LELD365 is the caspase-8 cleavage site of GSDMC that leads to pyroptosis.
nPD-L1-mediated pyroptosis pathway is required for tumor necrosis in vivo
Solid tumors contain hypoxic regions that are often surrounded by areas of necrosis30. Interestingly, blockade of the hypoxia-induced pyroptosis pathway by either PD-L1-NLS mutant (Fig. 7a) or caspase-8 knockout (Fig. 7b) abolished tumor necrosis in hypoxic regions of MDA-MB-231 xenografts in nude mice. Given that macrophages often accumulate in the hypoxic regions of solid tumors and are a major source of TNFα in the tumor microenvironment31, we depleted macrophages by treating mice with colony-stimulating factor 1 receptor (CSF1R) antibody32. Depleting macrophages (Fig. 7c) or blocking TNFα (Fig. 7d) each substantially suppressed tumor necrosis, suggesting that macrophage-derived TNFα is essential for tumor necrosis. In addition, overexpression of GSDMC, which stimulates pyroptosis (Fig. 5 and 6), enhanced tumor necrosis (Fig. 7e). Consistently, in an immunocompetent orthotopic 4T1 mammary tumor mouse model, tumor necrosis was greatly restrained by PD-L1-NLS mutation (Fig. 7f). To further examine the clinical relevance of nPD-L1, p-Y705-Stat3, and GSDMC, we analyzed their expression patterns in MDA-MB-231 xenografts in nude mice and in human breast tumor specimens. In hypoxic regions surrounding areas of necrosis, both PD-L1 and p-Y705-Stat3 were detected in the nucleus (Fig. 7g and Extended Data Fig. 8a). Moreover, the observed GSDMC overexpression correlated with poor survival (Fig. 7h). Indeed, nude mice inoculated with PD-L1-NLS-expressing 4T1 stable cells had better survival than those with PD-L1-WT (Extended Data Fig. 8b). We observed greater survival rate differences between PD-L1-WT and PD-L1-NLS groups in immunocompetent mice (p=0.0085 vs. p=0.0336; Extended Data Fig. 8c), supporting the notion that nPD-L1-induced tumor necrosis not only promotes tumor progression but also suppresses antitumor immunity. Altogether, these results supported the idea that hypoxia-induced formation of nPD-L1/p-Stat3 complex increases the expression of GSDMC which is cleaved by TNFα-activated caspase-8 to induce pyroptosis followed by tumor necrosis in hypoxic regions that promotes tumor progression and inhibits antitumor immune response.
Fig. 7: nPD-L1, caspase-8, and GSDMC are required for TNFα-induced tumor necrosis in hypoxic regions.
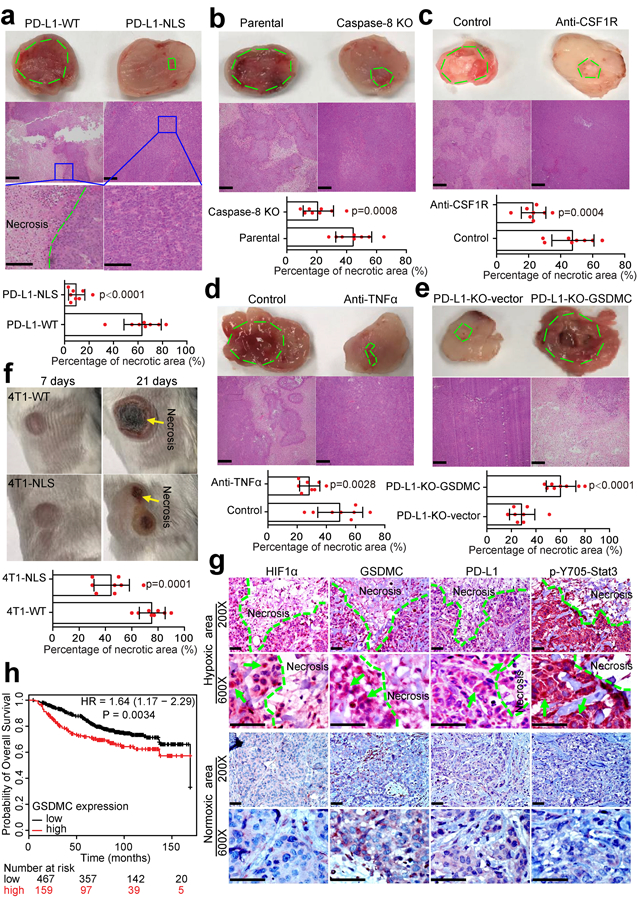
(a–e) The indicated MDA-MB-231 parental cells or stable transfectants were injected subcutaneously into nude mice (n = 8 mice/group). Mice in (c) were treated with CSF1R antibody to achieve macrophage depletion in vivo. Mice in (d) were treated with TNFα antibody to block TNFα in vivo. Representative images of tumor sections and H&E staining are shown. Green dashed line indicates areas of tumor necrosis. The percentage of necrotic area in tumor tissue is shown. Data are mean ± SD of n = 8 mice. P values were determined by two-sided Student’s t-test. Scale bar, 200 μm. (f) Representative images of tumor necrosis shown at 7 days and 21 days after inoculation of the indicated 4T1 stable transfectants in immunocompetent BALB/c mice (n = 8 mice/group). Data are mean ± SD of n = 8 mice. P values were determined by two-sided Student’s t-test. 4T1-WT, 4T1 cells stably expressing wild-type mouse PD-L1; 4T1-NLS, 4T1 cells stably expressing NLS-mutated mouse PD-L1. Yellow arrows indicate tumor necrosis. (g) IHC staining of HIF1α, GSDMC, PD-L1, and p-Y705-Stat3 in human breast cancer tissues. The expression levels and patterns of HIF1α, GSDMC, PD-L1, and p-Y705-Stat3 in normoxic and hypoxic area in human breast tumors were analyzed and indicated by green arrows. Scale bar, 100 μm. (h) Kaplan-Meier Plotter analysis of overall survival for human breast tumor tissue microarray in the indicated groups with different GSDMC expression levels. The patient number (n) for each group as indicated. Statistical significance for survival analysis was determined using a log-rank (Mantel–Cox) test. Statistical source data are provided in Source Data Fig. 7.
Chemotherapeutic drugs are known to cause tumor necrosis33. Although almost all of the chemotherapy drugs tested induced nPD-L1 translocation and GSDMC expression, only the antibiotic type, e.g., daunorubicin, doxorubicin, epirubicin, and actinomycin-D, that activated caspase-8 and caused GSDMC cleavage were able to induce pyroptotic cell death (Fig. 7a-c). The four antibiotic drugs could not activate GSDME expression (Extended Data Fig. 4d). However, the antibiotic-induced pyroptosis was abolished by PD-L1-NLS mutation, Stat3-Y705F mutation, or caspase-8 deletion (Extended Data Fig. 9). In addition, pharmacological inhibition of caspase-8 but not caspase-6 suppressed the antibiotic-induced pyroptosis (Fig. 7d,e). Compared with apoptosis, pyroptosis elicits inflammatory immune response34; therefore, our observations implied that a treatment consisting of one of the four antibiotics may cause strong inflammation that could affect the antitumor immunity and prognosis of PD-L1+ or GSDMC+ cancer patients.
Discussion
To date, most PD-L1 research has focused on its immune checkpoint function. Here, we identified a non-immune checkpoint function in which PD-L1 harbors nuclear transcriptional activity and is involved in the pyroptosis pathway (Extended Data Fig. 10). Interestingly, a recent study showed that PD-L1 is required for hypoxia-induced pyroptosis in human pulmonary arterial smooth muscle cells which fuels pulmonary vascular fibrosis35, indicating that PD-L1-mediated pyroptosis under hypoxia may be a general phenomenon that could occur in other types of cell except cancer cell and associate with more human diseases. TNFα is well known to induce tumor necrosis22, but most of TNFα studies have focused on TNFα-mediated apoptosis and necroptosis, and much less on the molecular mechanism of TNFα-induced tumor necrosis. The current report resolves this long-term puzzle by showing that TNFα-activated caspase-8, in the presence of GSDMC and nPD-L1 activated by hypoxia, switches apoptosis to pyroptosis, resulting in tumor necrosis in the hypoxic area.
Little is known about the biological functions and disease associations of GSDMC11. Here, we show that GSDMC mediates tumor necrosis upon caspase-8 activation in tumor cells. The GSDMC/caspase-8-mediated pyroptotic cell death offers valuable insights into the pyroptosis pathway in cancer cells and suggests that pyroptosis is triggered by specific expression and distinct caspase-induced cleavage of a gasdermin family member in certain tissues or cells. It is of interest to note that GSDMC is also cleaved by caspase-6 (Fig. 5f), which raises the interesting question of whether pyroptosis may also occur under caspase-6-activated microenvironment, such as ROS and DNA damage36. In addition, given that GSDMC is involved in pyroptosis in breast cancer in the current study and highly expressed in this disease, which correlates with poorer survival (Fig. 7h), one wonders whether the pathway identified here could serve as a potential therapeutic target for breast cancer therapy by inducing GSDMC cleavage to cause tumor cell pyroptosis. It would be also interesting to determine whether GSDMC-mediated pyroptosis may also have a role in other cancer types.
PD-L1 expression on myeloid cells is mechanistically critical and clinically relevant in PD-L1/PD-1 blockade37-39. Interestingly, different from cancer cells, the activity of p-Stat3 is largely suppressed in myeloid cells in hypoxic tumor sites40. In addition, myeloid cells are well known to utilize the canonical pyroptotic pathway through GSDMD which is highly expressed in myeloid cells1, 8. Thus, it is not yet clear whether hypoxia-induced nPD-L1 translocation in myeloid cells plays a major role in inducing GSDMC-mediated pyroptosis, which we view as less likely because nPD-L1 translocation is p-Stat3 dependent. All these are interesting questions would be worth pursuing further in the future.
Results from intensive efforts to probe the contribution of pyroptotic cell death in cancer cells to antitumor immunity have been encouraging. Granzymes derived from cytotoxic lymphocytes are able to cleave GSDMB and GSDME to induce tumor cell pyroptosis, which in turn enhances anticancer immunity9, 10. The utilization of a biorthogonal system to deliver gasdermin proteins selectively into cancer cells rendered significant tumor regression and sensitized tumor cells to immune checkpoint blockade therapy8. Generally, the tumor microenvironment is shaped by a chronic inflammatory process in which stromal components and polarized macrophages promote tumor development. In addition, at the site of chronic tumor necrosis, a small number of cells continue to die as a consequence of hypoxic stress, which promotes tumor growth and correlates with poor prognosis41-43. In the current study, we demonstrated that chronic tumor necrosis induced by pyroptosis of small population of cancer cells in the central hypoxic region of tumor fueled tumor progression. The observations that pyroptosis plays a role in pro- and anti-tumor development are in line with those previously reported demonstrating that chronic tumor necrosis suppresses antitumor immunity and accelerates tumor growth whereas acute inflammation in the tumor microenvironment enhances immune response to tumor and represses tumor development19, 41. Thus, the effectiveness of pro-pyroptotic agents in inducing acute inflammatory immune response in tumor microenvironment warrants further investigation in a clinical setting.
Chemotherapeutic drugs mediate the release of damage-associated molecular patterns (DAMPs) from tumor cells which leads to immunogenic cell death to induce strong antitumor immunity44-46. A recent study showed that pyroptotic cell death of cancer cells promotes activation of dendritic cells and T-cell infiltration, and enhances antitumor immune response through the release of high mobility group protein B147. In the current study, we demonstrated that four antibiotics, including daunorubicin, doxorubicin, epirubicin, and actinomycin-D, induced nPD-L1 and GSDMC expression as well as caspase-8 activation, leading to pyroptosis in cancer cells (Fig. 7a-c). These observations imply that for PD-L1+ or GSDMC+ breast tumors, those drugs may promote antitumor immunity during treatment.
Online Methods
Cell culture and transfection.
MDA-MB-231, MDA-MB-157, 4T1, HEK293T, Hep3B, Tong, HA59T, SK-Hep-1, WRL68, HepG2, Huh7, Mahlavu, PLC, HA22T, H441, H820, HCC827, H358, H460, H226, H1993, PC-9, H322, H1650, H1299, H1395, H1435, H1355, T47D, ZR751, HOC-7, SB-2, Hs578T, BT549, MCF-7, and HeLa cells were obtained from ATCC. PD-L1-knockout MDA-MB-231 cells were previously described25. H441, HOC-7, and 4T1 cells were cultured in Roswell Park Memorial Institute 1640 medium with 10% fetal bovine serum and all other cells were cultured in Dulbecco modified Eagle medium/F-12 with 10% fetal bovine serum. All cells were cultured at 37°C in a 5% CO2 incubator. For treatment with hypoxia, cells were seeded at the same density and allowed 6 hours for adherence in a regular incubator before being transferred into a hypoxia chamber (InvivO2 400, 1% O2 and 5% CO2, Ruskinn). All cell lines were tested independently with short tandem repeat DNA fingerprinting at The University of Texas MD Anderson Cancer Center and validated as mycoplasma negative. Lipofectamine 2000 (Life Technologies) was used for transient transfection of plasmid DNA.
Plasmids, antibodies, and reagents.
Human GSDMC cDNA (#BC063595) was purchased from transOMIC technologies; human Stat3-WT (#71450), p-Stat3-Y705F (#71445), and GSDMD (#111559) from Addgene; and GSDMC promoter (#HPRM51041) from GeneCopoeia. Site-specific mutants of PD-L1, GSDMC promoter, and Stat3-K451R were generated using Q5 Site-Directed Mutagenesis Kit (#E0554S, New England BioLabs). Truncation of GSDMC and GSDMD was done by a standard PCR cloning strategy.
The following antibodies were used for immunoblotting at 1:1000: Rabbit anti-PD-L1 (Cat. #13684, clone #E1L3N), rabbit anti-cleaved caspase-8 (Cat. #9496, clone #18C8), rabbit anti-cleaved caspase-6 (Cat. #9761), rabbit anti-Phospho-Stat3 (Tyr705) (Cat. #9145S, clone #D3A7), and rabbit anti-lamin A/C (Cat. #2032T) from Cell Signaling Technology; Rabbit anti-GSDMC (Cat. #AP10771c, Abgent); Rabbit anti-GSDMC (Cat. #27630-1-AP, Proteintech); Mouse anti-Caspase-8 (Cat. #MAB704, clone #84131, R&D System); Mouse anti-Stat3 (Cat. #SC-8019, clone #F-2, Santa Cruz Biotechnology); Mouse anti-Flag (Cat. #F1804, clone #M2) and mouse anti-tubulin (Cat. #T5168, clone #B-5-1-2) from Sigma-Aldrich; Rabbit anti-HIF1α (Cat. #GTX127309, GeneTex). The following antibodies were used for immunoprecipitation at 1:100: Rabbit anti-PD-L1 (Cat. #13684, clone #E1L3N) and rabbit anti-Phospho-Stat3 (Tyr705) (Cat. #9145S, clone #D3A7) from Cell Signaling Technology. The following antibodies were used for immunofluorescence and Duolink assay at 1:200: Mouse anti-PD-L1 (Cat. #LS-C338364, clone #OTI2C7, LifeSpan BioSciences); Mouse anti-Flag (Cat. #F1804, clone #M2, Sigma-Aldrich); Rabbit anti-Phospho-Stat3 (Tyr705) (Cat. #9145S, clone #D3A7, Cell Signaling Technology). The following antibodies were used for immunohistochemistry at 1:100: Rabbit anti-PD-L1 (Cat. #AB205921, clone #28-8, Abcam); Rabbit anti-HIF1α (Cat. #A300-286A, Bethyl Laboratories); Rabbit anti-Phospho-Stat3 (Tyr705) (Cat. #9145S, clone #D3A7, Cell Signaling Technology); Rabbit anti-GSDMC (Cat. #GTX33979, GeneTex). The following antibodies were used for animal studies: Rat anti-TNFα (Cat. #BE0058, clone #XT3.11, at the dose of 300 μg/mouse) and rat anti-CSF1R (Cat. #BE0213, clone #AFS98, at the dose of 400 μg/mouse) from Bio X Cell.
GSDMC recombinant protein (#MBS1338096) was obtained from MyBioSource, and human TNFα recombinant protein (#300-01A) was from Peprotech. CHX (#C4859); 2,6-pyridinedicarboxylic acid (DPA; #P63808), terbium(III) chloride (TbCl3; #439657), chlorambucil (#C0253), cyclophosphamide (#C3250000), 1,3-bis(2-chloroethyl)-1-nitrosourea (BCNU; #C0400), busulfan (#B2635), dacarbazine (#BP100), thiotepa (#T6069), cisplatin (#C2210000), 5-fluorouracil (#F8423), 6-mercaptopurine (#1392002), gemcitabine (#G6423), methotrexate (#M9929), doxorubicin (#D1515), epirubicin (#E9406), actinomycinD (#A9415), mitomycinC (#M7949), topotecan (#1672257), irinotecan (#1347609), etoposide (#1268808), mitoxantrone (#1445200), paclitaxel (#1491332), docetaxel (#1224551), and vincristine (#V8388) were from Sigma-Aldrich. SYTOX green nucleic acid stain (#S7020) was from Thermo Fisher Scientific. Active recombinant caspases (caspase-1, −2, −3, −6, −7, −8, −9, and −10) (#ALX-850-243-KI01), caspase-4 (#ALX-201-093), and caspase-6 inhibitor (Z-VEID-FMK; #ALX-260-143) were from Enzo Life Sciences. All the lipids used for liposome preparation were obtained from Avanti Polar Lipids. Stat3 inhibitor (HO-3867; #B4970) was purchased from ApexBio. Ivermectin (#sc-203609) and teniposide (#sc-204910) were obtained from Santa Cruz Biotechnology. Carboplatin (#41575-94-4), pentostatin (#53910-25-1), daunorubicin (#23541-50-6), and caspase-8 inhibitor (Z-IETD-FMK; #218759) were from Calbiochem. Caspase-3 inhibitor (Z-DEVD-FMK; #FMK004) was from R&D Systems.
Generation of stable transfectants.
Lentiviral-based plasmids for HIF1α knockdown in MDA-MB-231 cells were from Sigma-Aldrich, and those for caspase-8 and Stat3 knockout in MDA-MB-231 cells and GSDMC knockout in MDA-MB-157 cells were from GenScript. WT, NLS, and NES mutants of PD-L1 and GSDMC genes were cloned using a lentiviral vector, pCDH-CMV, for overexpression in PD-L1–knockout MDA-MB-231 cells. To establish PD-L1-NLS mutant-expressing cells, we first analyzed the PD-L1 sequence on the basis of the literature48,49 ,50,51 and a prediction program (http://www.jassa.fr/index.php?m=jassa), and we obtained four putative NLS sequences. By screening under hypoxia, we then identified a non-canonical NLS sequence (Extended Data Fig. 1f) and established stable PD-L1-NLS–mutated MDA-MB-231 cells. Stat3-WT and p-Stat3-Y705F from Addgene were retroviral plasmids for overexpression in Stat3-knockout MDA-MB-231 cells. For viral infection, packaging plasmids, VSV-G and dvpr, were co-transfected with the desired genes into HEK293T cells (for lentiviral infection) or Phoenix cells (for retroviral infection), and viral particles were harvested at 72 h after transfection. Cells were infected with viruses overnight in the presence of polybrene (10 μg/ml) and subsequently selected by puromycin (2 μg/ml) or G418 (2,000 μg/ml). All stable cell lines were validated by immunoblotting.
Cellular fractionation.
Cellular fractionation was performed as described previously52. Briefly, cells were washed three times with ice-cold 1 phosphate-buffered saline (PBS) and harvested by lysis in Nori buffer (10 mM KCl; 2 mM MgCl2; 20 mM HEPES, pH 7.0; 0.5% NP-40; 1 mM PSMF; 2 μg/ml aprotinin; 1 mM Na3VO4; and 10 mM NaF). After incubation on ice for 15 min, cell lysates were homogenized for 60 strokes in a Dounce homogenizer (Wheaton). The homogenates were centrifuged at 1,500g for 5 min at 4 °C to sediment the nuclei. The supernatant was centrifuged at 16,100g for 25 min at 4 °C, and the resulting supernatant formed the non-nuclear fraction. The nuclear pellets were washed three times with lysis buffer (without PMSF) to remove potential contamination with cytoplasmic membranes. The nuclear pellets were then re-suspended in NETN buffer (1 mM EDTA; 150 mM NaCl; 20 mM Tris-HCl, pH 8.0; 1 mM Na3VO4; 10 mM NaF; 1 mM PMSF; 0.5% NP-40; and 2 μg/ml aprotinin) and subsequently sonicated for 15 cycles at 20 s/cycle. The supernatant was collected for nuclear lysates with centrifugation at 16,100g for 25 min at 4 °C.
Luciferase assay.
Cells were transfected with GSDMC promoter luciferase reporter plasmids. After transfection for 48 h, cells were collected and detected using BioLux Gaussia Luciferase Assay Kit (#E3300, New England BioLabs) and SEAP Reporter Assay Kit (#rep-sap, InvivoGen) following the manufacturers’ protocols.
Chromatin immunoprecipitation assay and RT-qPCR.
ChIP was performed as described previously53. Putative Stat3-binding site sequences in GSDMC promoter from the immunoprecipitates were detected by standard PCR with primers (5′-GAATACGAGCCAAAGAAGTTG-3′ and 5′-CACATACAGAACTAGC TGA G-3′).
For RT-qPCR, total RNA was extracted with RNeasy Mini Kit (#74104, QIAGEN) as instructed and then subjected to reverse transcription for first-strand cDNA synthesis using the iScript cDNA Synthesis Kit (#1708891, Bio-Rad Laboratories). Quantitative PCR was performed using CFX96 Touch Real-Time PCR Detection System (iQ5, BioRad Laboratories) with the primers listed below using iQ SYBR Green Supermix (#1708882, Bio-Rad Laboratories).
Primers for quantitative PCR (5′ to 3′):
GSDMA-Forward: TACGTCCGCACCGACTACA
GSDMA-Reverse: CAGAGTGCTGTTCTGCGAGA
GSDMB-Forward: ATGTAGACTCAACGGGAGAGTT
GSDMB-Reverse: GTAGCCAGATACTGCTGGGATA
GSDMC-Forward: TCCATGTTGGAACGCATTAGC
GSDMC-Reverse: CAAACTGACGTAATTTGGTGGC
GSDMD-Forward: GTGTGTCAACCTGTCTATCAAGG
GSDMD-Reverse: CATGGCATCGTAGAAGTGGAAG
GSDME-Forward: ACATGCAGGTCGAGGAGAAGT
GSDME-Reverse: TCAATGACACCGTAGGCAATG
DFNB59-Forward: GAGGGAGATTAGTTCCTGTTCCA
DFNB59-Reverse: CGCCTTCCATAGAGTGAAACATC
Actin Forward: GCACAGAGCCTCGCCTT
Actin Reverse: GTTGTCGACGACGAGCG
Duolink assay (in situ proximity ligation assay) and immunofluorescence.
Duolink assay was performed using Duolink In Situ Red Starter Kit (#DUO92101, Sigma-Aldrich) according to the manufacturer’s instructions as described previously54. Briefly, MDA-MB-231 cells were seeded on four-well chamber slides and cultured under normoxia or hypoxia for 72 h. Cells were then washed twice with ice-cold 1× PBS, fixed with 4% paraformaldehyde, permeabilized with 0.5% Triton X-100, and blocked with 5% bovine serum albumin/PBS before incubation with primary antibodies (against p-Y705-Stat3 and PD-L1) at 4 °C overnight. After cells were washed three times with cold 1× PBS, incubation with secondary antibodies, which were conjugated with oligonucleotides, was performed for 1 h at 37 °C. Ligation solution was added to each reaction after washing followed by incubation at 37 °C for 30 min. Texas Red-labeled oligonucleotides and polymerase were then added to each reaction to amplify the previously ligated nucleotide circles. A distinct red spot was visualized as a positive signal, and each spot representing one cluster of protein-protein interaction. For immunofluorescence, post-treatment cells were washed, fixed, permeabilized, and blocked. Cells were then incubated with PD-L1 antibody overnight at 4 °C. After three PBS washes, cells were further incubated with the anti-mouse immunoglobulin G antibody conjugated with fluorescein isothiocyanate for 1 h at room temperature. Nuclei were stained with DAPI. After mounting, cells were visualized using a Zeiss LSM710 laser microscope (ZEN2010B SP1, Zeiss).
Time-lapse imaging.
To monitor cell death and morphology, cells after various treatments were seeded in a six-well plate and visualized in the IncuCyte S3 Live-Cell Analysis System (Essen BioScience). SYTOX (green color, 1:10000) was added to each well to label dying cells (apoptosis or pyroptosis). Cell morphology and fluorescence signals were detected at the desired time intervals. Data were exported to either images (with or without fluorescence) for cell morphology or kinetics for cell death speed according to the manufacturer’s instructions.
TNFα and nPD-L1 stimuli treatment.
The final concentrations for TNFα, CHX, and various stimuli are as shown in Supplementary Table 1.
Lactate dehydrogenase (LDH) release assay.
LDH release assay was performed using CytoTox 96 Non-Radioactive Cytotoxicity Assay Kit (#G1780, Promega) according to the manufacturer’s instructions.
In vitro cleavage of GSDMC.
Recombinant GSDMC protein (3 μg) was incubated with 1 U of active caspase protein at 37°C for 3 h in a reaction solution containing 50 mM HEPES, pH 7.2; 50 mM sodium chloride; 0.1% CHAPS; 10 mM EDTA; 5% glycerol; and 10 mM DTT. The cleaved GSDMC protein was examined by sodium dodecyl sulfate–polyacrylamide gel electrophoresis followed by Coomassie blue staining.
Liposome-binding, pore-forming, and leakage assays.
Methods described previously5 were used with slight modifications. Briefly, for liposome preparation, lipids comprising 45% phosphatidylcholine + 35% phosphatidylethanolamine + 5% phosphatidylserine + 5% phosphatidylinositol + 10% phosphatidylinositol-4,5-bisphosphate were mixed in a glass vial. After evaporation under a stream of nitrogen, the dry lipid film was then hydrated with solution A (20 mM HEPES, pH 7.5; and 150 mM NaCl). Extrusion of the hydrated lipids through a 100-nm polycarbonate filter (Whatman) 60 times was performed using the Mini-Extruder device (Avanti Polar Lipids). For Tb3+-encapsulated liposomes, the dry lipid film was hydrated with buffer B (20 mM HEPES, pH 7.5; 50 mM sodium citrate; 100 mM NaCl; and 15 mM TbCl3). After extrusion, liposomes were washed five times with solution B on a centrifugal filter device (Amicon Ultra-4, 100K molecular weight cutoff, Millipore) to remove Tb3+ ions outside the liposome and then subjected to buffer change into buffer A. For the liposome-binding assay, 5 μM GSDMC protein was incubated with 500 μM lipids at room temperature for 1 h and then centrifuged in a Beckman Optima XPN-100 Ultracentrifuge at 4°C for 20 min at 100,000g. The supernatant and pellet were collected and subjected to sodium dodecyl sulfate–polyacrylamide gel electrophoresis and Coomassie blue staining. For GSDMC pore-forming activity assessment, 5 μM GSDMC protein was incubated with 500 μM lipids at room temperature for 1h. The mixture was then transferred to carbon support films on electron microscopy grids and negatively stained with 2% uranyl acetate. Samples were imaged and analyzed by the High Resolution Electron Microscopy Facility at MD Anderson Cancer Center. For the leakage assay, Tb3+-encapsulated liposomes were mixed with buffer A and 15 μM DPA. The Tb3+/DPA chelates were examined at excitation and emission wave lengths of 270 nm and 490 nm, respectively. Before GSDMC protein was added, the emission fluorescence was defined as Ft0. After 0.6 μM GSDMC protein was co-incubated with the liposomes, the emission fluorescence was detected and treated as Ft every 1 min. After 20 min, Triton X-100 (1%) was added to the liposomes to achieve 100% release of Tb3+, and the fluorescence value was recorded as Ft100. The liposome leakage percentage at each time point was calculated with the following formula: leakage (t) (%) = (Ft − Ft0) × 100/(Ft100 − Ft0).
Hematoxylin and eosin (H&E) and immunohistochemical (IHC) staining.
H&E staining and IHC staining were performed as described previously55, 56. For H&E staining, mouse tissue samples were fixed in 4% paraformaldehyde overnight and washed with PBS, then transferred to 70% ethanol. Samples were embedded in paraffin and sectioned, and finally stained with hematoxylin and eosin. For IHC staining, human breast tumor samples were obtained in accordance with guidelines approved by the Institutional Review Board at MD Anderson, and written informed consent was obtained from patients in all cases at the time of enrollment. Briefly, human or mouse tissue samples were incubated with primary antibodies against GSDMC (1:100 dilution), p-Stat3 (1:120 dilution), PD-L1 (1:80 dilution), or HIF1α (1:100 dilution) at 4 °C overnight. After samples were washed three times with PBS, a biotin-conjugated secondary antibody was incubated with an avidin-biotin-peroxidase complex. Samples were visualized using amino-ethylcarbazole chromogen. For statistical analysis, the Fisher exact test and Pearson χ2 test were used, and a p value of < 0.05 was considered statistically significant. Intensity of staining was scored and graded according the scores into four groups: high (+++), medium (++), low (+), and negative (−).
Animal studies.
For the orthotopic xenograft model, the parental MDA-MB-231 human breast cancer cell line or stable cell lines derived from MDA-MB-231, such as PD-L1-WT, PD-L1-NLS, caspase-8 knockout, PD-L1-knockout-vector, or PD-L1-knockout-GSDMC (1×10⁶ cells), were injected into the mammary fat pads of 6 to 8-week-old female nude mice (Jackson Laboratory). For depletion of macrophages, intraperitoneal injection of 400 μg of CSF1R antibody was performed three times weekly beginning 3 weeks before tumor implantation and continuing for the duration of the study. Control mice were treated with intraperitoneal injection of PBS following the same dosing schedule. For TNFα blockade, 300 μg of TNFα antibody was injected by intraperitoneal administration every 3 days starting 2 weeks before tumor implantation and continuing for the duration of the study. Four weeks after tumor cell injection, all mice were killed, and tumors were excised for H&E and IHC staining. For orthotopic immunocompetent and nude mouse models, mouse mammary tumor cells (5 × 10⁴ cells) expressing PD-L1-WT (4T1-WT) and PD-L1-NLS (4T1-NLS) were injected into the mammary fat pad of 6-week-old female Balb/c or nude mice. Tumor images were taken at day 7 and day 21 after tumor cell inoculation and mice survival analyzed. Standard housing conditions (temperatures of 65-75°F with 40-60% humidity and a 14-hour light/10-hour dark cycle) recommended by the Jackson Laboratory were used for mice. All animal procedures were conducted under guidelines approved by the Institutional Animal Care and Use Committee at MD Anderson.
Statistics and reproducibility
All statistical tests performed are indicated in the figure legends. Graphpad Prism software (version 8.0.1) and SPSS software (version 16.0) were used for all statistical analyses. Quantitative data are shown as mean ± s.d. Statistical significance was determined using paired two-tailed Student’s t-tests. The precise P values are shown in figures. Data used for all statistical calculations are provided as Source Data. Survival curves for patients in Figure 7h were graphed using the Kaplan–Meier method, but for animal test in Extended Data Figure 8b,c using the Graphpad Prism software (version 8.0.1). Each experiment was repeated independently at least three times with similar results.
Data availability
The consensus caspase-8 recognition motifs were analyzed using CaspDB database (http://caspdb.sanfordburnham.org/). The p-Y705-Stat3-binding site in the GSDMC promoter was analyzed using the GPMiner program (http://gpminer.mbc.nctu.edu.tw/). All source data are reported as Source Data Tables for each figure and extended data figure in the supplementary information. All other data supporting the findings of this study are available from the corresponding author on reasonable request.
Extended Data
Extended Data Fig. 1. Establishment of stable cells in MDA-MB-231 cell line.
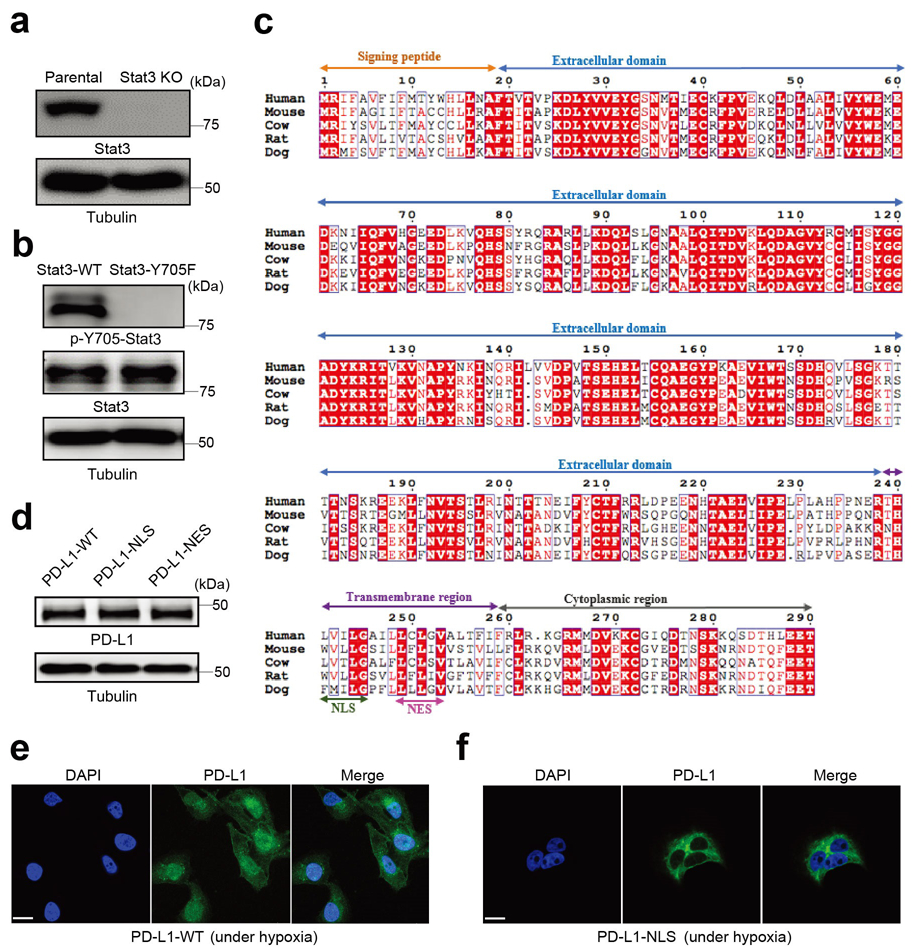
(a) Deletion of endogenous Stat3 by CRISPR/Cas9. KO, knockout. Blots are representative of three independent experiments. (b) Stable re-expression of Stat3-WT or Stat3-Y705F in Stat3-knockout MDA-MB-231 cells. Validation of p-Y705-Stat3 expression level by immunoblotting. Blots are representative of three independent experiments. (c) Analysis of the nuclear localization signal (NLS) and nuclear export signal (NES) in the human PD-L1 amino acid sequence compared with that of other species. Sequence alignment of PD-L1 from human, mouse, cow, rat, and dog. The alignment was generated and presented by the ClustalW2 algorithm and ESPript 3.0 (http://espript.ibcp.fr/ESPript/cgi-bin/ESPript.cgi). Identical residues are indicated by the dark red background and conserved residues are in red. The NLS and NES sequences of PD-L1 are conserved across species. (d-f) Stable re-expression of PD-L1-WT (wild-type PD-L1), PD-L1-NLS (NLS-mutated PD-L1) or PD-L1-NES (NES-mutated PD-L1) in the PD-L1–knockout MDA-MB-231 cell line. Immunoblotting of total PD-L1 expression level in stable transfectants (d). Blots are representative of three independent experiments. Representative images of PD-L1 distribution of three independent experiments was determined by confocal assay under hypoxia (e-f). Scale bar, 20 μm. Unprocessed blots are provided in Source Data Extended Data Fig. 1.
Extended Data Fig. 2. nPD-L1-mediated pyroptotic cell death in cell lines of multiple cancer types.
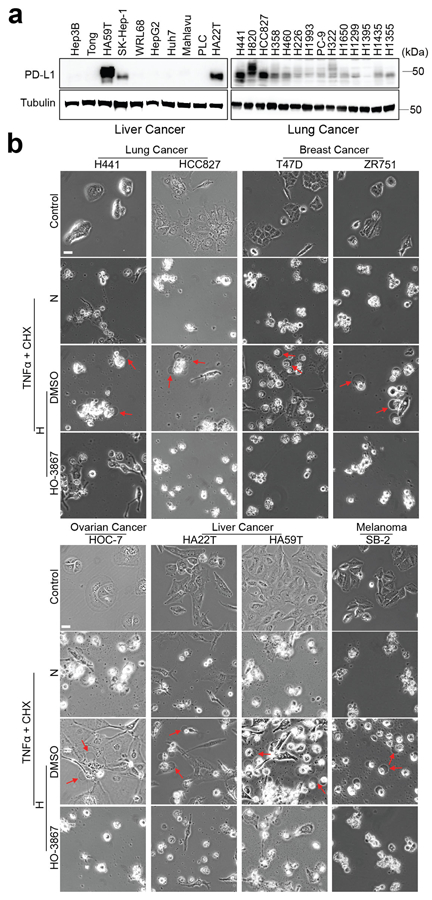
(a) Immunoblotting analysis of PD-L1 expression levels in liver cancer and lung cancer cell lines. Blots are representative of three independent experiments. (b) Hypoxia-induced pyroptotic cell death in PD-L1-positive cells of multiple cancer types treated with p-Stat3 inhibitor, HO-3867. Red arrows indicate the pyroptotic cells with big bubbles. The experiment was repeated three times with similar results. Scale bar, 20 μm. Unprocessed blots are provided in Source Data Extended Data Fig. 2.
Extended Data Fig. 3. nPD-L1 and p-Y705-Stat3 are required for hypoxia-induced GSDMC expression.
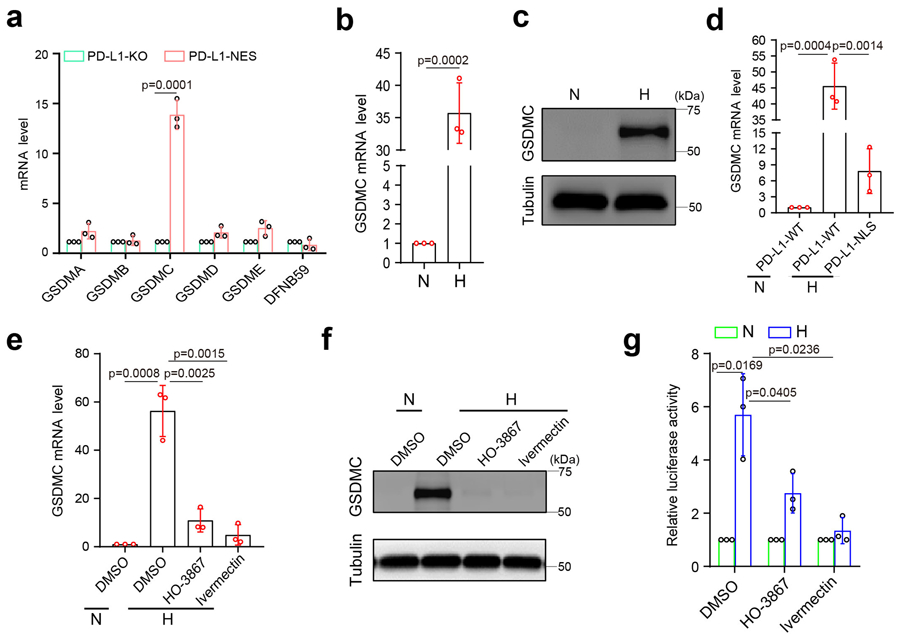
(a) Real-time quantitative polymerase chain reaction (RT-qPCR) analysis of mRNA levels of gasdermin family members in the indicated MDA-MB-231 stable transfectants. Data are shown as mean ± SD of n = 3 independent experiments. (b and c) GSDMC mRNA (b) and protein (c) levels in MDA-MB-231 cells under hypoxia. Data of (b) are shown as mean ± SD of n = 3 independent experiments. Blots are representative of three independent experiments. N, normoxia; H, hypoxia. (d) RT-qPCR analysis of mRNA levels of GSDMC in the indicated MDA-MB-231 stable transfectants. Data are shown as mean ± SD of n = 3 independent experiments. (e-g) MDA-MB-231 cells were cultured under hypoxia and treated with HO-3867 (20 μM) or ivermectin (25 μM). GSDMC mRNA (e) and protein (f) levels were analyzed by RT-qPCR and immunoblotting, respectively. GSDMC promoter luciferase reporter plasmids were transfected to cells, and luciferase activity was measured in (g). Data of (e) and (g) are shown as mean ± SD of n = 3 independent experiments. Blots are representative of three independent experiments. P values of all statistical analysis were determined by two-sided Student’s t-test. Statistical source data and unprocessed blots are provided in Source Data Extended Data Fig. 3.
Extended Data Fig. 4. The p-Y705-Stat3 binding site (in red) in the nucleic acid sequence of GSDMC promoter and the expression level of GSDME in MDA-MB-231 cells.
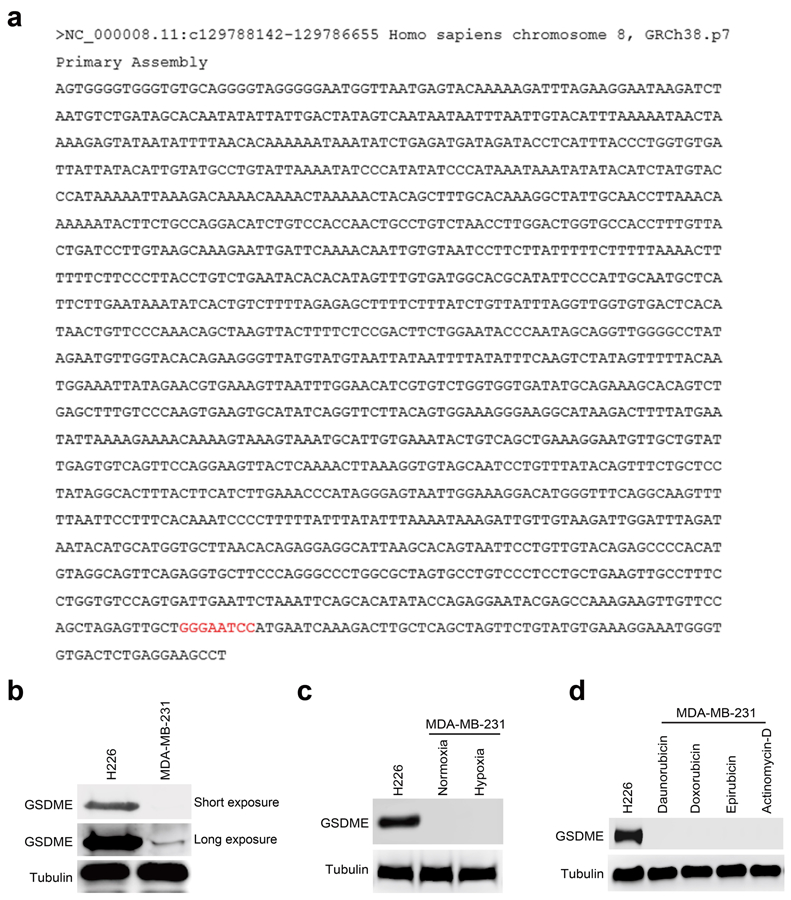
(a) GSDMC promoter sequence was obtained from GeneCopoeia and analyzed using the GPMiner program (http://gpminer.mbc.nctu.edu.tw/). Two putative p-Y705-Stat3–binding sites in the GSDMC promoter were predicted. p-Y705-Stat3-binding site was validated by screening with luciferase reporter assay. (b-d) Immunoblotting of GSDME in MDA-MB-231 cells. H226 cells as a positive control. Immunoblotting of the endogenous GSDME (b). Immunoblotting of GSDME in MDA-MB-231 cells under hypoxia (c). Immunoblotting of GSDME in MDA-MB-231 cells treated with daunorubicin, doxorubicin, epirubicin, and actinomycin-D (d). The experiments of (b-d) were repeated three times with similar results respectively. Unprocessed blots are provided in Source Data Extended Data Fig. 4.
Extended Data Fig. 5. Caspase-8, but not caspase-6, is required for TNFα-induced pyroptosis under hypoxia.
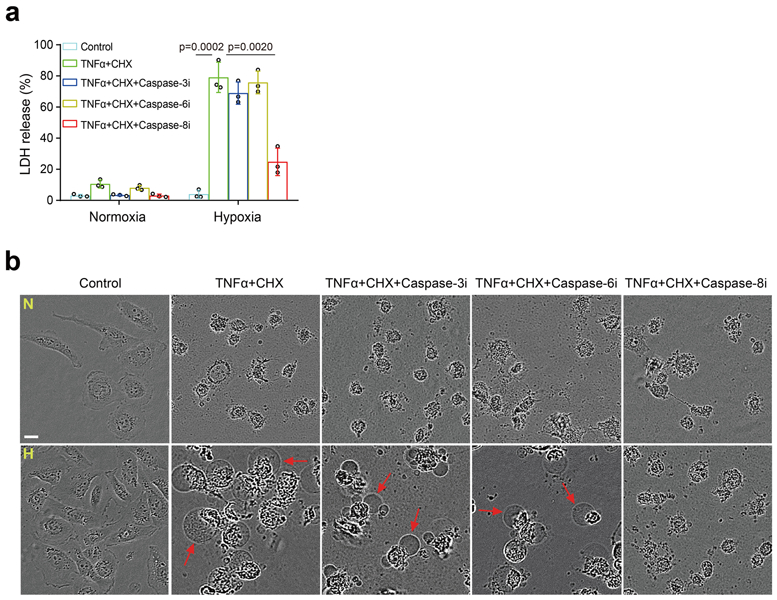
(a and b) MDA-MB-231 cells were cultured under normoxia (N) or hypoxia (H) and treated as indicated. LDH-released cell death was measured as shown in (a). Data are shown as mean ± SD of n = 3 independent experiments. P values were determined by two-sided Student’s t-test. Representative images of dying cell morphology of three independent experiments (b). Red arrows indicate cell swelling with big bubbles. Scale bar, 20 μm. Caspase-3i, caspase-3 inhibitor Z-DEVD-FMK; Caspase-6i, caspase-6 inhibitor Z-VEID-FMK; Caspase-8i, caspase-8 inhibitor Z-IETD-FMK (each at 10 μM). Statistical source data are provided in Source Data Extended Data Fig. 5.
Extended Data Fig. 6. The pyroptotic cell death in cell lines with different GSDMC and PD-L1 expression status.
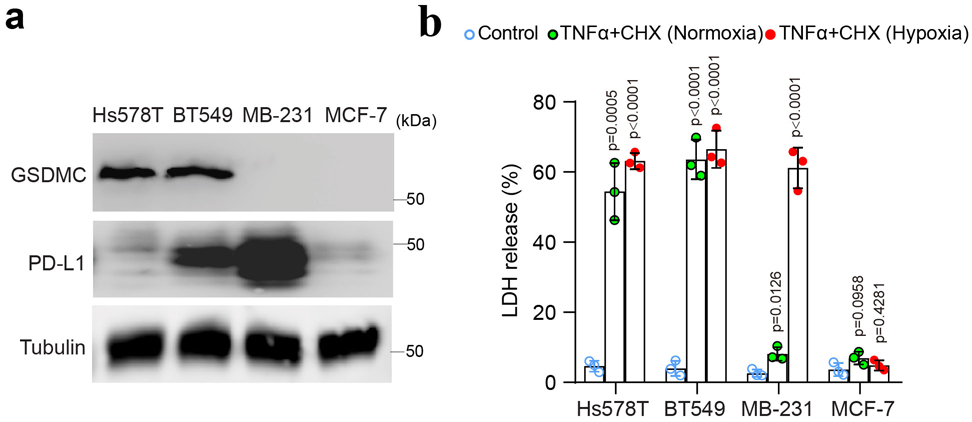
(a) Immunoblotting of PD-L1 and GSDMC in Hs578T, BT549, MDA-MB-231 and MCF-7 cells. Blots are representative of three independent experiments. (b) LDH-released cell death in Hs578T, BT549, MDA-MB-231 and MCF-7 cells treated with TNFα under normoxia or hypoxia. Data are shown as mean ± SD of n = 3 independent experiments. P values were determined by two-sided Student’s t-test. Statistical source data and unprocessed blots are provided in Source Data Extended Data Fig. 6.
Extended Data Fig. 7. The N-terminal domain (1-365) of GSDMC is sufficient to induce pyroptosis.
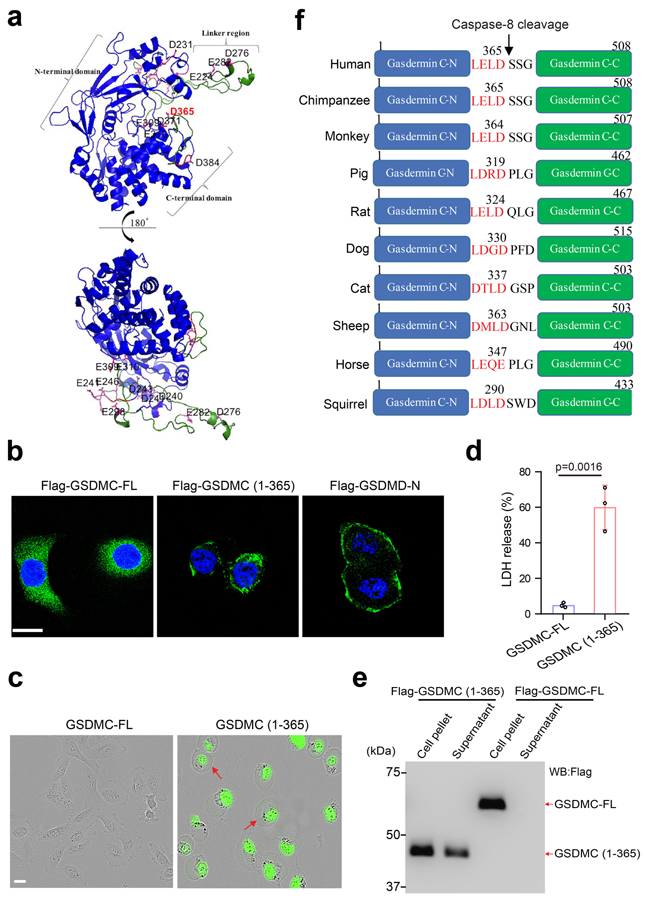
(a) 3-D structural modeling of GSDMC. The modeling was performed using SWISS-MODEL. The structural fold of GSDMC N- and C-terminal domains is in blue cartoon presentation. The linker region and the solvent-exposed loop region of the C-terminal domain of GSDMC are colored in green with numbered Asp/Glu residues colored in magenta. The structural figure was prepared using PyMOL Molecular Graphics System, Version 2.0 Schrödinger, LLC. (b) Confocal microscopy analysis of the distribution of GSDMC-FL, GSDMC (1¬–365), and GSDMD-N expressions in HeLa cells. GSDMD-N, N-terminal domain of GSDMD. Images are representative of three independent experiments. Scale bar, 20 μm. (c–d) HeLa cells were transfected with GSDMC-FL or GSDMC (1–365). Representative images of dying cell morphology of three independent experiments (c). Scale bar, 20 μm. Dying cells were stained with nucleic acid dye SYTOX green. Red arrows indicate cell swelling with large bubbles. LDH-released cell death is shown as mean ± SD of n = 3 independent experiments (d). P values were determined by two-sided Student’s t-test. (e) HEK293T cells were transfected with Flag-GSDMC-FL or Flag-GSDMC (1–365) for 16 h. Supernatants and cell pellets were collected and subjected to immunoblotting. The blot is representative of three independent experiments. (f) Cartoon diagram of GSDMC structure and the cleavage by caspase-8 across species. Statistical source data and unprocessed blots are provided in Source Data Extended Data Fig. 7.
Extended Data Fig. 8. The nuclear PD-L1 translocation in vivo causes poor survival in both immunocompetent and nude mice.
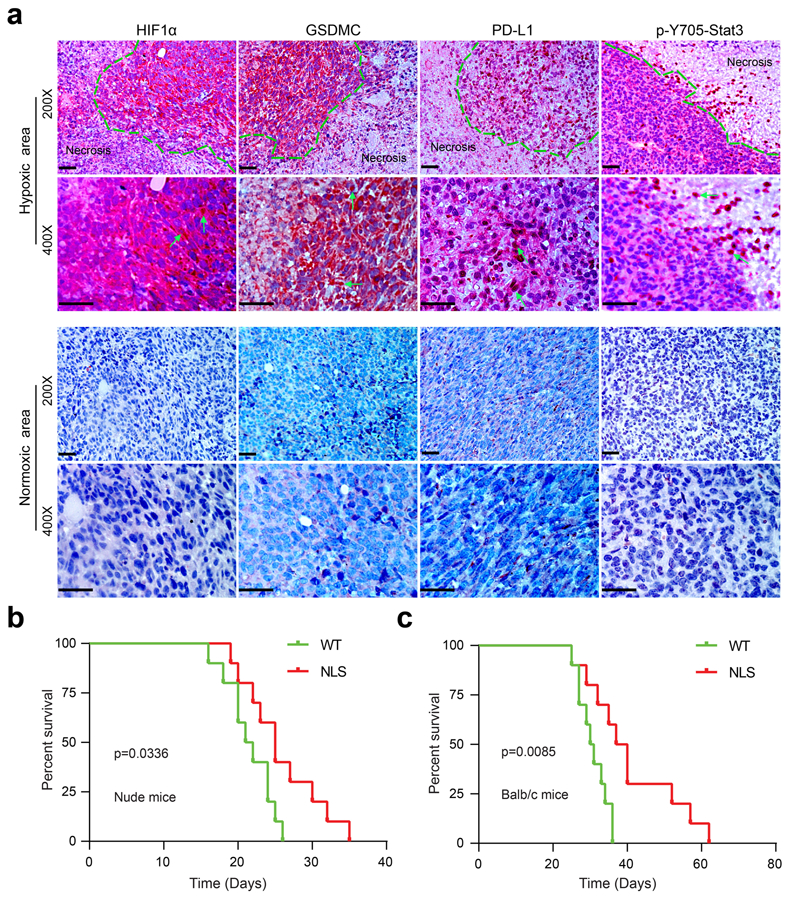
(a) IHC staining of HIF1α, GSDMC, PD-L1, and p-Y705-Stat3 in MDA-MB-231 xenografts in nude mice (n = 8). MDA-MB-231 cells were injected subcutaneously into nude mice. Four weeks after tumor cell injection, all mice were sacrificed and tumors excised for IHC staining. The expression levels and patterns of HIF1α, GSDMC, PD-L1, and p-Y705-Stat3 in normoxic and hypoxic area in tumors were analyzed and indicated by green arrows. Scale bar, 100 μm. The experiment was repeated three times with similar results. (b) Survival analysis of 4T1 cells expressing PD-L1-WT or PD-L1-NLS in BALB/c nude mice. Data are shown of n = 10 mice. The experiment was repeated three times with similar results. Statistical significance for survival analysis was determined using a log-rank (Mantel–Cox) test. (c) Survival analysis of 4T1 cells expressing PD-L1-WT or PD-L1-NLS in immunocompetent BALB/c mice. Data are shown of n = 10 mice. The experiment was repeated three times with similar results. Statistical significance for survival analysis was determined using a log-rank (Mantel–Cox) test. Statistical source data are provided in Source Data Extended Data Fig. 8.
Extended Data Fig. 9. Chemotherapeutic drugs induce pyroptotic cell death by nPD-L1/GSDMC-mediated non-canonical pathway in breast tumor.
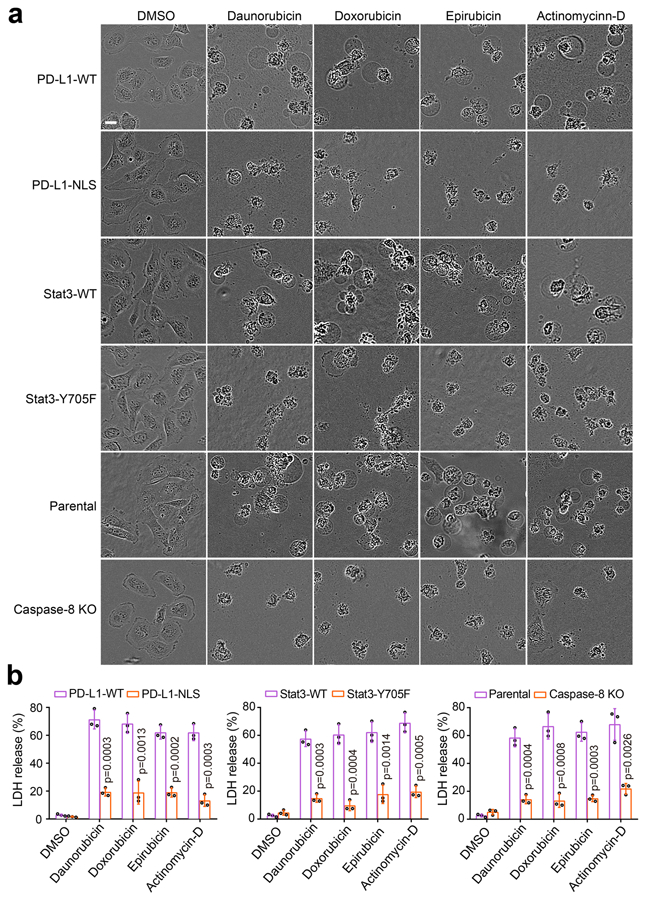
(a) Representative images of dying cell morphology by phase-contrast microscopy in MDA-MB-231 stable transfectants as indicated treated with daunorubicin, doxorubicin, epirubicin, and actinomycin-D. The experiment was repeated three times with similar results. Scale bar, 20 μm. (b) LDH-released cell death in MDA-MB-231 stable transfectants as indicated treated with daunorubicin, doxorubicin, epirubicin, and actinomycin-D. Data are shown as mean ± SD of n = 3 independent experiments. P values were determined by two-sided Student’s t-test. Statistical source data are provided in Source Data Extended Data Fig. 9.
Extended Data Fig. 10. A proposed model of nuclear PD-L1-mediated apoptosis-to-pyroptosis switch under hypoxia.
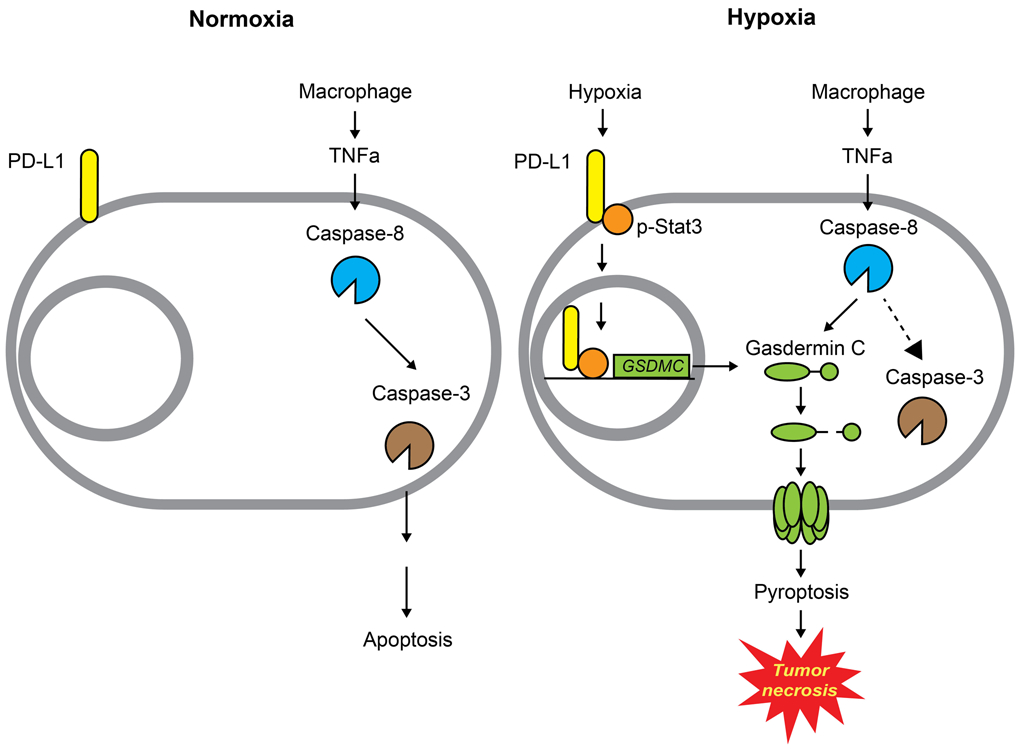
Under normoxia, caspase-3 can be activated by TNFα-induced caspase-8 to cause apoptotic cell death. However, hypoxia-activated p-Stat3 facilitates nPD-L1 translocation. nPD-L1 cooperates with p-Stat3 to transcriptionally activate GSDMC expression. GSDMC is specifically cleaved by macrophage-derived TNFα-activated caspase-8, which generates an N-terminal pore-forming fragment that causes pyroptotic cell death to induce tumor necrosis in breast cancer.
Supplementary Material
Fig. 8: Chemotherapeutic drugs induce pyroptotic cell death via the nPD-L1/GSDMC-mediated non-canonical pathway in breast tumors.
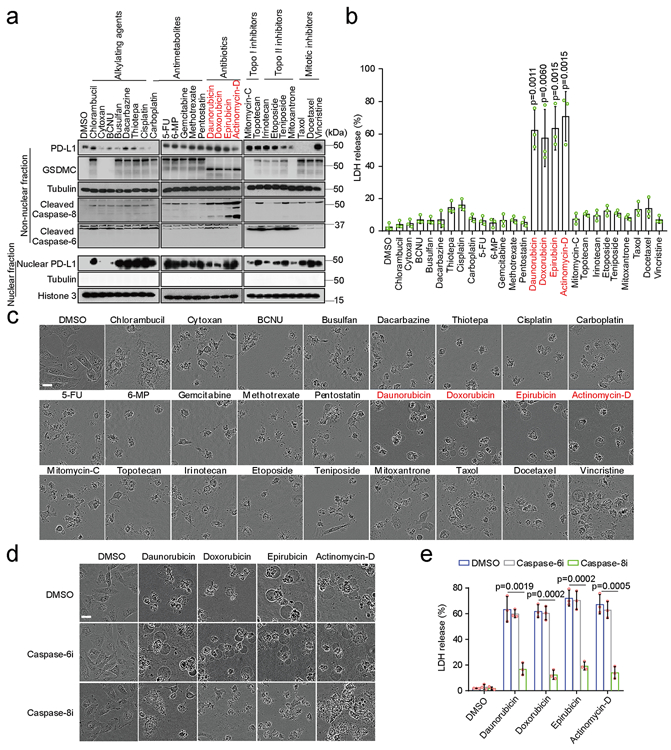
(a) Immunoblotting of PD-L1, GSDMC, and cleaved caspase-6 and caspase-8 in MDA-MB-231 cells treated with various chemotherapy drugs as indicated. Blots are representative of three independent experiments. (b and c) Cell death induced by the indicated drugs was determined by LDH release and phase-contrast cell images in MDA-MB-231 cells. Data of LDH-released cell death are shown as mean ± SD of n = 3 biologically independent experiments. Phase-contrast cell images are representative of three independent experiments with similar results. Scale bar, 20 μm. (d and e) Phase-contrast cell images (d) and LDH release (e) in MDA-MB-231 cells treated with the indicated drugs in combination with caspase-6 or caspase-8 inhibition. Data of LDH-released cell death are shown as mean ± SD of n = 3 biologically independent experiments. Phase-contrast cell images are representative of three independent experiments with similar results. Scale bar, 20 μm. P values of all statistical analysis were determined by two-sided Student’s t-test. Statistical source data and unprocessed blots are provided in Source Data Fig. 8.
Acknowledgments
We thank Kenneth Dunner, Jr., and acknowledge the National Institutes of Health Cancer Center Support Grant P30CA016672 supporting the High Resolution Electron Microscopy Facility at The University of Texas MD Anderson Cancer Center for electron microscopy analysis. This work was funded in part by National Institutes of Health grants P30CA016672 and R01 (AI116722 to M.-C.H.); a National Breast Cancer Foundation Breast Cancer Research Foundation grant to M.-C.H.; the Patel Memorial Breast Cancer Endowment Fund; the Sister Institution Network Fund for collaboration between The University of Texas MD Anderson Cancer Center and China Medical University (to M.-C.H.); the YingTsai Young Scholar Award (CMU108-YTY02 to J.-M.H.); China Medical Univesity Start Up Fund (CMU108-N-02 to W.-J.W.); NIH R35 CA220430, NIH PO1 CA092584, Cancer Prevention and Research Institute of Texas RP180813 and Robert A. Welch Chemistry Chair (to J.A.T.); 108-2311-B-241-001, Drug Development Center, Ministry of Education, Taiwan (to M.-C.H. and Y.C.).
Footnotes
Declaration of Interests
The authors have no conflicts of interest to declare.
References
- 1.Shi J et al. Cleavage of GSDMD by inflammatory caspases determines pyroptotic cell death. Nature 526, 660–665 (2015). [DOI] [PubMed] [Google Scholar]
- 2.Kayagaki N et al. Caspase-11 cleaves gasdermin D for non-canonical inflammasome signalling. Nature 526, 666–671 (2015). [DOI] [PubMed] [Google Scholar]
- 3.Liu X et al. Inflammasome-activated gasdermin D causes pyroptosis by forming membrane pores. Nature 535, 153–158 (2016). [DOI] [PMC free article] [PubMed] [Google Scholar]
- 4.Shi J et al. Inflammatory caspases are innate immune receptors for intracellular LPS. Nature 514, 187–192 (2014). [DOI] [PubMed] [Google Scholar]
- 5.Ding J et al. Pore-forming activity and structural autoinhibition of the gasdermin family. Nature 535, 111–116 (2016). [DOI] [PubMed] [Google Scholar]
- 6.Wang Y et al. Chemotherapy drugs induce pyroptosis through caspase-3 cleavage of a gasdermin. Nature 547, 99–103 (2017). [DOI] [PubMed] [Google Scholar]
- 7.Rogers C et al. Cleavage of DFNA5 by caspase-3 during apoptosis mediates progression to secondary necrotic/pyroptotic cell death. Nat Commun 8, 14128 (2017). [DOI] [PMC free article] [PubMed] [Google Scholar]
- 8.Wang Q et al. A bioorthogonal system reveals antitumour immune function of pyroptosis. Nature 579, 421–426 (2020). [DOI] [PubMed] [Google Scholar]
- 9.Zhang Z et al. Gasdermin E suppresses tumour growth by activating anti-tumour immunity. Nature 579, 415–420 (2020). [DOI] [PMC free article] [PubMed] [Google Scholar]
- 10.Zhou Z et al. Granzyme A from cytotoxic lymphocytes cleaves GSDMB to trigger pyroptosis in target cells. Science (2020). [DOI] [PubMed] [Google Scholar]
- 11.Kovacs SB & Miao EA Gasdermins: Effectors of Pyroptosis. Trends Cell Biol 27, 673–684 (2017). [DOI] [PMC free article] [PubMed] [Google Scholar]
- 12.Ribas A & Wolchok JD Cancer immunotherapy using checkpoint blockade. Science 359, 1350–1355 (2018). [DOI] [PMC free article] [PubMed] [Google Scholar]
- 13.Powles T et al. MPDL3280A (anti-PD-L1) treatment leads to clinical activity in metastatic bladder cancer. Nature 515, 558–562 (2014). [DOI] [PubMed] [Google Scholar]
- 14.Schmid P et al. Atezolizumab and Nab-Paclitaxel in Advanced Triple-Negative Breast Cancer. N Engl J Med 379, 2108–2121 (2018). [DOI] [PubMed] [Google Scholar]
- 15.Socinski MA et al. Atezolizumab for First-Line Treatment of Metastatic Nonsquamous NSCLC. N Engl J Med 378, 2288–2301 (2018). [DOI] [PubMed] [Google Scholar]
- 16.Satelli A et al. Potential role of nuclear PD-L1 expression in cell-surface vimentin positive circulating tumor cells as a prognostic marker in cancer patients. Sci Rep 6, 28910 (2016). [DOI] [PMC free article] [PubMed] [Google Scholar]
- 17.Ghebeh H et al. Doxorubicin downregulates cell surface B7-H1 expression and upregulates its nuclear expression in breast cancer cells: role of B7-H1 as an anti-apoptotic molecule. Breast Cancer Research 12, R48 (2010). [DOI] [PMC free article] [PubMed] [Google Scholar]
- 18.Shimizu S et al. Induction of apoptosis as well as necrosis by hypoxia and predominant prevention of apoptosis by Bcl-2 and Bcl-XL. Cancer research 56, 2161–2166 (1996). [PubMed] [Google Scholar]
- 19.Grivennikov SI, Greten FR & Karin M Immunity, inflammation, and cancer. Cell 140, 883–899 (2010). [DOI] [PMC free article] [PubMed] [Google Scholar]
- 20.Scaffidi P, Misteli T & Bianchi ME Release of chromatin protein HMGB1 by necrotic cells triggers inflammation. Nature 418, 191 (2002). [DOI] [PubMed] [Google Scholar]
- 21.Vakkila J & Lotze MT Inflammation and necrosis promote tumour growth. Nature Reviews Immunology 4, 641 (2004). [DOI] [PubMed] [Google Scholar]
- 22.Carswell E et al. An endotoxin-induced serum factor that causes necrosis of tumors. Proceedings of the National Academy of Sciences 72, 3666–3670 (1975). [DOI] [PMC free article] [PubMed] [Google Scholar]
- 23.Noman MZ et al. PD-L1 is a novel direct target of HIF-1alpha, and its blockade under hypoxia enhanced MDSC-mediated T cell activation. J Exp Med 211, 781–790 (2014). [DOI] [PMC free article] [PubMed] [Google Scholar]
- 24.Pawlus MR, Wang L & Hu CJ STAT3 and HIF1alpha cooperatively activate HIF1 target genes in MDA-MB-231 and RCC4 cells. Oncogene 33, 1670–1679 (2014). [DOI] [PMC free article] [PubMed] [Google Scholar]
- 25.Yang Y et al. Exosomal PD-L1 harbors active defense function to suppress T cell killing of breast cancer cells and promote tumor growth. Cell Res 28, 862–864 (2018). [DOI] [PMC free article] [PubMed] [Google Scholar]
- 26.Li C-W et al. Glycosylation and stabilization of programmed death ligand-1 suppresses T-cell activity. Nature communications 7, 12632 (2016). [DOI] [PMC free article] [PubMed] [Google Scholar]
- 27.Timmer J & Salvesen G Caspase substrates. Cell Death & Differentiation 14, 66–72 (2007). [DOI] [PubMed] [Google Scholar]
- 28.Poręba M, Stróżyk A, Salvesen GS & Drąg M Caspase substrates and inhibitors. Cold Spring Harbor perspectives in biology 5, a008680 (2013). [DOI] [PMC free article] [PubMed] [Google Scholar]
- 29.Salvesen GS & Ashkenazi A Snapshot: caspases. Cell 147, 476–476. e471 (2011). [DOI] [PubMed] [Google Scholar]
- 30.Brown JM & Wilson WR Exploiting tumour hypoxia in cancer treatment. Nat Rev Cancer 4, 437–447 (2004). [DOI] [PubMed] [Google Scholar]
- 31.Murdoch C, Muthana M, Coffelt SB & Lewis CE The role of myeloid cells in the promotion of tumour angiogenesis. Nat Rev Cancer 8, 618–631 (2008). [DOI] [PubMed] [Google Scholar]
- 32.Barkal AA et al. Engagement of MHC class I by the inhibitory receptor LILRB1 suppresses macrophages and is a target of cancer immunotherapy. Nat Immunol 19, 76–84 (2018). [DOI] [PMC free article] [PubMed] [Google Scholar]
- 33.Karagiannis GS et al. Neoadjuvant chemotherapy induces breast cancer metastasis through a TMEM-mediated mechanism. Science translational medicine 9, eaan0026 (2017). [DOI] [PMC free article] [PubMed] [Google Scholar]
- 34.Aglietti RA & Dueber EC Recent Insights into the Molecular Mechanisms Underlying Pyroptosis and Gasdermin Family Functions. Trends Immunol 38, 261–271 (2017). [DOI] [PubMed] [Google Scholar]
- 35.Zhang M et al. Programmed death-ligand 1 triggers PASMCs pyroptosis and pulmonary vascular fibrosis in pulmonary hypertension. Journal of molecular and cellular cardiology 138, 23–33 (2020). [DOI] [PubMed] [Google Scholar]
- 36.Ehrnhoefer DE et al. p53 increases caspase-6 expression and activation in muscle tissue expressing mutant huntingtin. Human molecular genetics 23, 717–729 (2013). [DOI] [PubMed] [Google Scholar]
- 37.Curiel TJ et al. Specific recruitment of regulatory T cells in ovarian carcinoma fosters immune privilege and predicts reduced survival. Nature medicine 10, 942–949 (2004). [DOI] [PubMed] [Google Scholar]
- 38.Lin H et al. Host expression of PD-L1 determines efficacy of PD-L1 pathway blockade–mediated tumor regression. The Journal of clinical investigation 128, 805–815 (2018). [DOI] [PMC free article] [PubMed] [Google Scholar]
- 39.Tang H et al. PD-L1 on host cells is essential for PD-L1 blockade–mediated tumor regression. The Journal of clinical investigation 128, 580–588 (2018). [DOI] [PMC free article] [PubMed] [Google Scholar]
- 40.Kumar V et al. CD45 phosphatase inhibits STAT3 transcription factor activity in myeloid cells and promotes tumor-associated macrophage differentiation. Immunity 44, 303–315 (2016). [DOI] [PMC free article] [PubMed] [Google Scholar]
- 41.Vakkila J & Lotze MT Inflammation and necrosis promote tumour growth. Nature Reviews Immunology 4, 641–648 (2004). [DOI] [PubMed] [Google Scholar]
- 42.Edwards JG et al. Tumor necrosis correlates with angiogenesis and is a predictor of poor prognosis in malignant mesothelioma. Chest 124, 1916–1923 (2003). [DOI] [PubMed] [Google Scholar]
- 43.Koukourakis MI et al. Lactate dehydrogenase-5 (LDH-5) overexpression in non-small-cell lung cancer tissues is linked to tumour hypoxia, angiogenic factor production and poor prognosis. British journal of cancer 89, 877–885 (2003). [DOI] [PMC free article] [PubMed] [Google Scholar]
- 44.Obeid M et al. Calreticulin exposure dictates the immunogenicity of cancer cell death. Nat Med 13, 54–61 (2007). [DOI] [PubMed] [Google Scholar]
- 45.Krysko DV et al. Immunogenic cell death and DAMPs in cancer therapy. Nat Rev Cancer 12, 860–875 (2012). [DOI] [PubMed] [Google Scholar]
- 46.Galluzzi L, Buque A, Kepp O, Zitvogel L & Kroemer G Immunological Effects of Conventional Chemotherapy and Targeted Anticancer Agents. Cancer Cell 28, 690–714 (2015). [DOI] [PubMed] [Google Scholar]
- 47.Erkes DA et al. Mutant BRAF and MEK inhibitors regulate the tumor immune microenvironment via pyroptosis. Cancer Discovery 10, 254–269 (2020). [DOI] [PMC free article] [PubMed] [Google Scholar]
- 48.Kosugi S et al. Six classes of nuclear localization signals specific to different binding grooves of importin α. Journal of Biological Chemistry 284, 478–485 (2009). [DOI] [PubMed] [Google Scholar]
- 49.Bassi C et al. Nuclear PTEN controls DNA repair and sensitivity to genotoxic stress. Science 341, 395–399 (2013). [DOI] [PMC free article] [PubMed] [Google Scholar]
- 50.Kosugi S, Hasebe M, Tomita M & Yanagawa H Systematic identification of cell cycle-dependent yeast nucleocytoplasmic shuttling proteins by prediction of composite motifs. Proceedings of the National Academy of Sciences 106, 10171–10176 (2009). [DOI] [PMC free article] [PubMed] [Google Scholar]
- 51.Pichler A, Gast A, Seeler JS, Dejean A & Melchior F The nucleoporin RanBP2 has SUMO1 E3 ligase activity. Cell 108, 109–120 (2002). [DOI] [PubMed] [Google Scholar]
- 52.Lo HW et al. Nuclear interaction of EGFR and STAT3 in the activation of the iNOS/NO pathway. Cancer Cell 7, 575–589 (2005). [DOI] [PubMed] [Google Scholar]
- 53.Lin S-Y et al. Nuclear localization of EGF receptor and its potential new role as a transcription factor. Nature cell biology 3, 802 (2001). [DOI] [PubMed] [Google Scholar]
- 54.Shen J et al. EGFR modulates microRNA maturation in response to hypoxia through phosphorylation of AGO2. Nature 497, 383–387 (2013). [DOI] [PMC free article] [PubMed] [Google Scholar]
- 55.Chang CJ et al. EZH2 promotes expansion of breast tumor initiating cells through activation of RAF1-beta-catenin signaling. Cancer Cell 19, 86–100 (2011). [DOI] [PMC free article] [PubMed] [Google Scholar]
- 56.Cha T-L et al. Akt-mediated phosphorylation of EZH2 suppresses methylation of lysine 27 in histone H3. science 310, 306–310 (2005). [DOI] [PubMed] [Google Scholar]
Associated Data
This section collects any data citations, data availability statements, or supplementary materials included in this article.
Supplementary Materials
Data Availability Statement
The consensus caspase-8 recognition motifs were analyzed using CaspDB database (http://caspdb.sanfordburnham.org/). The p-Y705-Stat3-binding site in the GSDMC promoter was analyzed using the GPMiner program (http://gpminer.mbc.nctu.edu.tw/). All source data are reported as Source Data Tables for each figure and extended data figure in the supplementary information. All other data supporting the findings of this study are available from the corresponding author on reasonable request.


