

Abstract
Neuroglial activation has been recognized as a pathological hallmark of a variety of neurological diseases, yet the role of neuroglia in tinnitus hasn’t been well established so far. To explore the potential roles of two types of glia cells (astrocyte and microglia) in the development of tinnitus, we examined markers associated with them in the primary auditory (A1) cortex and medial geniculate body (MGB) of rats with salicylate-induced tinnitus. The results demonstrated that acute and chronic administrations of salicylate could cause reversible tinnitus-like behavior in rats. The expression level of GFAP markedly increased in the A1 cortex of rats following acute and chronic treatments of salicylate, accompanied by increased endpoint and process length of astrocyte. The expression level of GFAP and the morphology of astrocyte in the rat MGB remained almost constant following salicylate treatment. On the other hand, the expression level of Iba1 markedly increased in the rat A1 cortex and MGB following acute and chronic treatments of salicylate, together with increased endpoint and process length of microglia in the MGB. Additionally, interleukin 1β (IL-1β), a pro-inflammatory cytokine released by activated glia was significantly up-regulated in the A1 cortex and MGB of rats after salicylate treatments. These findings highlight astrocyte activation and microglia proliferation in the central auditory system of rats experiencing tinnitus, which potently implicate an indispensable glial regulation in tinnitus development.
Keywords: Tinnitus, salicylate, astrocyte, microglia, neuroglial activation, neuroinflammation
Introduction
Tinnitus, the perception of sound in the absence of external auditory stimulus, is a phantom sensation with debilitating problems such as depression, anxiety, frustration and insomnia that severely affect the sufferer’s quality of life [1-4]. Changes in structure and function of multiple auditory and non-auditory brain regions have been revealed in tinnitus individuals [5-7]. Hyperactivity in the central auditory system has been proved to be key neural correlates of tinnitus generation and maintenance, which is regarded as a consequence of excitatory-inhibitory synaptic imbalance [8-10]. Auditory cortex is part of the circuit involved in noise-induced tinnitus, and homeostatic reduction of cortical GAD65 expression plays a pivotal role in tinnitus generation [11]. Abnormal activation and cortical map reorganization in the auditory cortex are correlated with the occurrence and severity of noise-induced tinnitus [12,13]. Salicylate (an active ingredient in aspirin) is capable of inducing tinnitus in humans [14,15] as well as in laboratory animals [16-18]. Salicylate-induced hearing disturbances are often associated with tonotopic-map reorganization and neural activity modulation in the auditory cortex [19]. Salicylate perfusion in vitro can increase neuronal excitability in primary auditory (A1) cortex by inhibiting the GABAergic transmission [20]. In addition to the well-known contribution of A1 cortex in tinnitus pathogenesis, medial geniculate body (MGB, projects to A1 cortex and limbic structures), known as an obligate auditory center to gate the percept of sound, has been concerned in recent years. Tonic GABAAR currents and spike frequency increase in the MGB of animals with noise-induced tinnitus [21]. Salicylate perfusion can alter neuronal intrinsic properties in MGB [22], and subsequently lead to aberrant thalamic outputs to the auditory cortex.
With the exception of neurons, glia cells play a crucial role in maintaining homeostasis in the central nervous system. Astrocytes, the most abundant cell type in the mammalian brain, are responsible for diverse functions in blood-brain barrier maintenance, neural circuitry function and metabolic regulation [23]. In rats with salicylate-induced tinnitus, the number of GFAP-immunoreactive astrocytes increases in the ventral cochlear nucleus [24]. Microglias, as the immune competent cells, maintain normal brain function against diverse pathogenic factors [25]. A recent study has reported that noise-induced hearing loss is associated with elevated microglial activation in the A1 cortex, blockade of proinflammatory cytokines can prevent neuroinflammation and ameliorate noised-induced tinnitus [26]. These studies provide an evidence for activation of glia cells and glia-neuron interaction in the auditory system are emerging as potential mechanisms underlying tinnitus. The present study aims to investigate whether and how astrocyte and microglia in the A1 cortex and MGB are involved in salicylate-induced tinnitus.
Materials and methods
Animals
All the experimental procedures for present study were in accordance with the National Institutes of Health (NIH) guidelines for the Care and Use of Laboratory Animals, and were approved by the Ethics Committee of Ninth People’s Hospital, Shanghai Jiao Tong University School of Medicine (SH9H-2019-A377-1). Male Sprague-Dawley rats (weighing 230-250 g) from Jiesijie Laboratory Animal Co. Ltd. (Shanghai, China) were housed on a 12 h light/dark schedule, with standard food and water provided ad libitum.
Salicylate administration
Sodium salicylate (Sigma-Aldrich, St. Louis, MO, USA) was dissolved in saline just before use (200 mg/mL). The procedure of salicylate treatment is similar as described previously [18]. Briefly, in the experiment of acute treatment (AT), rats were randomly divided to control group (AT-control), 2 h group (AT-2 h), 4 h group (AT-4 h), 8 h group (AT-8 h) and 24 h group (AT-24 h). The rats from four groups (AT-2 h, 4 h, 8 h, and 24 h) were intraperitoneally injected with 350 mg/kg salicylate, and the rats from control group were treated with the same volume of saline. In the experiment of long-term chronic treatment (CT), rats were randomly divided to CT-control, CT-7 d group and CT-7 d+7 d group. The rats from CT-7 d group and CT-control group were respectively treated with salicylate (200 mg/kg) and saline, twice daily (8:00 and 20:00) for 7 consecutive days. The rats from CT-7 d+7 d group were given injection of salicylate with the same manipulation to those from CT-7 d group, and subsequently accompanied with 7-days recovery period.
Behavioral assessment of tinnitus
Tinnitus-like behavior was assessed using the gap pre-pulse inhibition of acoustic startle (GPIAS) and pre-pulse inhibition (PPI) as described in detail in previous studies [18,27,28], via the Acoustic Startle Reflex Starter Package for Rat or Mouse (Med Associates, St. Albans, VT, USA). Rats were put into a plastic holder placed in a sound-attenuating chamber. A piezoelectric platform was used to translate the downward force generated by animals to voltage proportionally. The amplitude of the startle response calculated as the peak-to-peak values. GPIAS paradigm was performed using narrow bandpass sound with a 1-kHz bandwidth centered at 6, 12, 16 kHz presented at 65 dB SPL and was composed of 30 gap trials and 30 non-gap trials randomly. Startle responses were elicited by acoustic startle stimuli (white noise, 110 dB SPL, 20 ms, in an interval of 30-35 s). A 50-ms sound gap was introduced into the narrowband noise 100 ms before the startle stimulus in gap trials (Figure 1B). GPIAS value was calculated using the formula: [(AvgTno-gap-AvgTgap)/AvgTno-gap] × 100% (AvgTgap and AvgTno-gap mean the average amplitude of gap and no-gap trials, respectively). PPI was performed in parallel to GPIAS to confirm that gap detection deficits were not attributed to temporal processing impairment or inability to hear the background sounds. PPI was tested in a quiet background and composed of 30 startle trials without pre-pulse and 30 startle trials with pulse-pulse randomly. A 50-ms noise-burst pre-pulse (65 dB SPL) was presented 100 ms before the startle stimulus in pre-pulse trials (Figure 1A). PPI value was calculated using the formula: [(AvgTstartle-AvgTpre-pulse)/AvgTstartle] × 100% (AvgTpre-pulse and AvgTstartle mean the average amplitude during the pre-pulse trials and startle trials, respectively).
Figure 1.
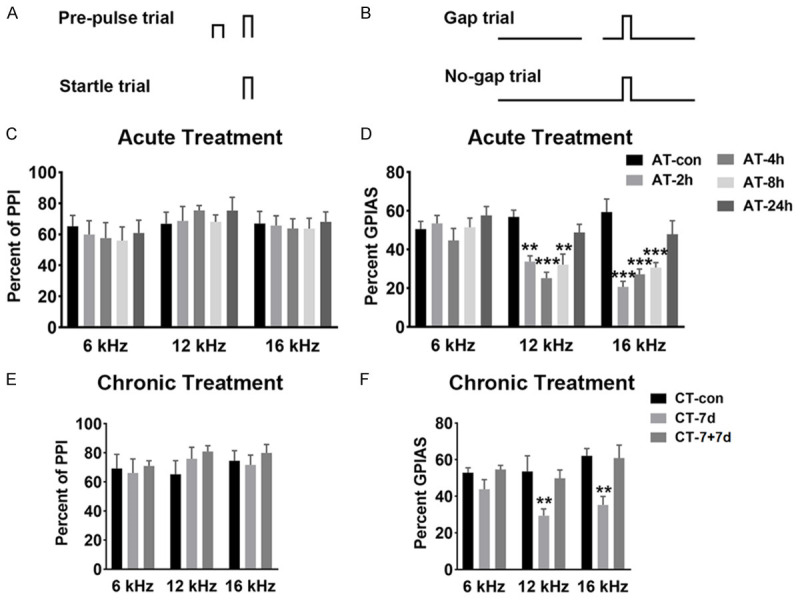
Pre-pulse inhibition (PPI) and gap pre-pulse inhibition of acoustic startle (GPIAS) paradigm. A. Diagram illustrate for PPI assay. B. Diagram illustrate for GPIAS assay. C. Percent of PPI at 6, 12 and 16 kHz after acute treatment of salicylate. No significant differences were detected among these five groups. D. Percent of GPIAS at 6, 12 and 16 kHz after acute treatment of salicylate. Three groups (AT-2 h, AT-4 h and AT-8 h) showed a significant decrease in percent of GPIAS compared with the AT-control group at 12 kHz (P < 0.01, P < 0.001, P < 0.01) and 16 kHz (P < 0.001, P < 0.001, P < 0.001) (n=4 rats in each group). E. Percent of PPI at 6, 12 and 16 kHz for rats after chronic treatment of salicylate. No significant differences were demonstrated among the three groups. F. Percent of GPIAS at 6, 12 and 16 kHz after chronic treatment of salicylate. The CT-7 d group showed a significant decrease in percent of GPIAS compared with the CT-control group at 12 kHz (P < 0.01) and 16 kHz (P < 0.01), but not at 6 kHz (n=6 rats in each group). Two-way analysis of variance (ANOVA) followed by post hoc Scheffé test was used for multiple comparisons of the five or three groups, *P < 0.05, **P < 0.01, ***P < 0.001, compared with control group. Data are presented as the mean ± SEM.
Western blotting
Rat bilateral A1 cortex and MGB were collected according to The rat brain in stereotaxic coordinates (5th edn). For whole-cell protein extraction, tissues were lysed in RIPA buffer containing protease inhibitor cocktail (Beyotime Biotechnology, Shanghai, China), the supernatant was collected after centrifugation. The concentration of proteins was estimated using BCA assay kit (Beyotime). The extracted protein samples were separated via sodium dodecyl sulfate-polyacrylamide gel (SDS-PAGE) and then transferred to PVDF membranes (Immobilon-P, Millipore, Billerica, MA, USA). After blocking, the following primary antibodies were used: monoclonal mouse anti-β-actin (abs137975, 1:1000, Absin, Shanghai, China), monoclonal mouse anti-GFAP (3670S, 1:1000, Cell Signaling Technology, Danvers, USA), polyclonal goat anti-Iba1 (ab5076, 1:2000, Abcam, Cambridge, USA). The membranes were incubated with HRP-conjugated secondary antibodies for 2 h at room temperature. Protein blots were detected by using enhanced chemiluminescent (ECL) kit (Beyotime) and imaged by the ECL system (Tanon 4600, Tanon Science & Technology Co. Ltd., Shanghai, China). The blots were quantified by densitometry with Image J software (National Institutes of Health, Bethesda, MD, USA). The ‘n’ described in this experiment represents the number of blots for data analysis.
Quantitative PCR (qPCR)
Total RNA was extracted using Trizol (Invitrogen, Carlsbad, CA,USA) according to manufacturer’s protocol. Synthesis of first-strand cDNA was performed using PrimeScript™ RT reagent Kit with gDNA Eraser (Takara, Dalian, Hebei, China) and qPCR was performed using TB Green Premix Ex Taq™ (Takara). The PCR primers were synthesized by Genscript (Nanjing, Jiangsu, China): IL-1β-S: 5’CTCACAGCAGCATCTCGACAAGAG3’; IL-1β-A: 5’TCCACGGGCAAGACATAGGTAGC3’; β-actin-S: 5’ACTATCGGCAATGAGCGGTTCC3’; β-actin-A: 5’AGCACTGTGTTGGCATAGAGGTC3’. Relative expression levels were calculated by the 2-ΔΔCT method. The expression level of IL-1β was normalized using β-actin as endogenous controls. The “n” value represents the number of normalized values.
Immunohistochemical staining
Rats were perfused with 0.9% normal saline and 4% paraformaldehyde after anesthesia. The brain was collected and post-fixed in the same fixative for 24 h, and subsequently dehydrated in 20% and 30% sucrose in 0.1 M phosphate buffer. After being frozen, cryostat coronal sections (16 μm) were obtained using a freezing microtome (Leica CM3050S, Leica Biosystems Inc., Wetzlar, Germany). After quenching with 0.05% hydrogen peroxide for 30 min and blocking with 5% goat serum (GS) for 1 h at room temperature, the slices were rinsed using 0.01 M phosphate buffered solution (PBS) and incubated with appropriate primary antibodies (GFAP, 1:400; Iba1, 1:1000; IL-1β, 1:400, ab9722, Abcam,) overnight at 4°C. After washing, the sections were incubated with secondary antibodies. Subsequently, the sections were rinsed and incubated with streptavidin biotin-peroxidase complex (SABC) (Boster, SA1020, SA1023, Wuhan, China). The immunohistological positive stainings were visualized by 3, 3’-diaminobenzidine (DAB) kit (Absin, abs9210). The sections were washed, dehydrated and mounted with Permount (Boster, AR0038). Images were taken with an optical microscope (Nikon, Japan) under standardized conditions by controlling the lamp brightness and camera white balance. Bilateral A1 cortex (Layer I-VI) and MGB (dorsal (d)MGB, ventral (v)MGB, medial (m)MGB) area of each slice were chosen for analysis. The average optical density (Integrated Optical Density (IOD)/area) of four randomly selected, non-overlapping fields (300 μm × 200 μm) at × 400 magnification were assessed using Image J software. The ‘n’ represents the number of slices used for data collection in whole A1 cortex and whole MGB, while that represents the number of collected fields in subdivision analysis.
Cellular skeleton analysis
Samples preparation were similar with the procedures mentioned above (30 μm coronal slices, thickness is different from the slices used for immunohistochemical staining) and captured by a confocal microscope (Olympus FV1000, Japan) under 40 × objective. Images (20 μm Z-stack with 2 μm intervals) were acquired in the A1 cortex and MGB, four fields without overlapping were captured randomly in each area of one slice. Image J software and appropriate plugins (bandpass filter, unsharp mask, despeckle) were used following previous studies [29-32]. The Analyze Skeleton Plugin (http://imagej.net/AnalyzeSkeleton) was applied to skeletonized images converted by Image J to collect data of process length and number of endpoints per frame. To quantify the endpoints and process length of glia cells, the total number of process length and endpoints were normalized by the number of cell somas in each field. These data were used for assess the morphology changes of glial cells. The ‘n’ described in this experiment represents the number of fields collected for data analysis.
Statistical analysis
Data are presented as mean ± SEM and analyzed using GraphPad Prism v.8.0 software (GraphPad Software Inc., San Diego, USA). One-way and two-way analysis of variance (ANOVA) followed by post hoc Scheffé test were used for data analysis. P < 0.05 was considered to be statistically significant.
Results
Tinnitus-like behaviors in rats following salicylate treatment
To explore the role of glia cells in tinnitus pathogenesis, two tinnitus models via salicylate administration were employed. Here, behavioral evidence of tinnitus was assessed using gap detection deficit, with significantly decreased GPIAS value. Compared with rats from control group, rats from three groups showed significant gap detection deficit at 12 kHz (AT-2 h, P < 0.01; AT-4 h, P < 0.001; AT-8 h, P < 0.01) and 16 kHz (AT-2 h, P < 0.001; AT-4 h, P < 0.001; AT-8 h, P < 0.001), but not at 6 kHz background sounds following acute salicylate treatment (Figure 1D), the gap detection ability of rats from AT-24 h group was recovered to normal level. Importantly, there was no significant difference in PPI value of rats among the five groups (Figure 1C), which indicated that gap detection deficits of tinnitus rats are not due to inability to hear the background sounds. On the other hand, following chronic salicylate treatment, the rats showed significant gap detection deficit at 12 kHz (P < 0.01) and 16 kHz (P < 0.01), but not at 6 kHz, the gap detection ability was tended to normal level after 7-days recovery (Figure 1F). Meanwhile, PPI values of rats from CT-control, CT-7 d, and CT-7+7 d groups had no significant difference (Figure 1E). The behavioral tests demonstrate that acute and chronic salicylate treatments can both induce reversible high-frequency tinnitus, which is consistent with previous study [18].
GFAP expression and astrocyte morphology in the A1 cortex after salicylate treatment
Astrocyte activation is widely defined as up-regulation of the specific marker (GFAP), which is often, but not always, associated with morphological changes (such as hypertrophy, proliferation and process extension) [33]. Using western blotting (WB) and immunohistochemical staining (IHC), it was found that at 4 h after acute salicylate treatment, the expression level of GFAP in the A1 cortex significantly increased (P < 0.05 in WB, P < 0.05 in IHC), the elevated GFAP expression recovered to control level at 8 h (Figure 2A-E, 2I and 2J). By laminar-analysis, GFAP was found to be up-regulated in layers II/III, IV, V, and VI of the A1 cortex at 4 h after acute salicylate treatment (P < 0.05, P < 0.05, P < 0.01, P < 0.01, respectively) (Figure 2M). After chronic salicylate treatment, the expression level of GFAP in the A1 cortex significantly increased (P < 0.05 in WB, P < 0.001 in IHC), the rising tendency was tend to normal level after 7-days recovery (Figure 2F-H, 2K and 2L). The up-regulation of GFAP was presented across from layer I to layer VI of the A1 cortex after chronic salicylate treatment (P < 0.001, P < 0.001, P < 0.001, P < 0.001, P < 0.001, respectively) (Figure 2N). On the other hand, the morphological changes of astrocyte in the A1 cortex were identified. Astrocytic hypertrophy and glia scar in the A1 cortex were undetectable following salicylate treatment (Figure 4A and 4B). However, the number of endpoints/cell (EP/C) and the process length/cell (LE/C) of astrocyte significantly increased at 2 h (P < 0.01, P < 0.01) and 4 h (P < 0.05, P < 0.05), but at 8 h after acute salicylate treatment, only the number of EP/C of astrocyte (P < 0.05) increased. The changed morphology of astrocyte in the A1 cortex was recovered to normal pattern at 24 h after salicylate treatment (Figure 4C and 4E). In the case of chronic salicylate treatment, the number of EP/C of astrocyte in the A1 cortex significantly increased (P < 0.01), and returned to normal level after 7-days recovery, without changes of LE/C (Figure 4D and 4F). These results clearly indicate that astrocytes in the rat A1 cortex are into an activated-state phase following salicylate treatment.
Figure 2.
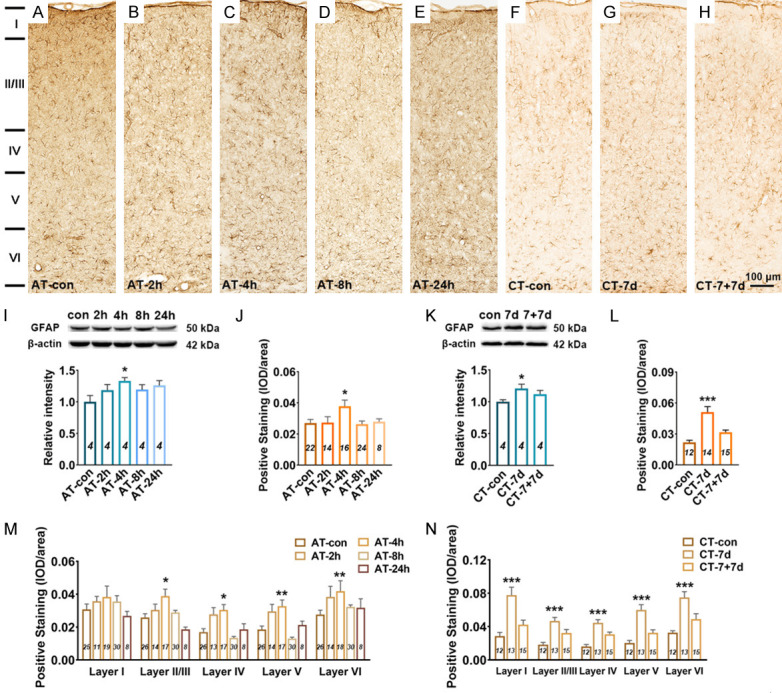
Changes in GFAP expression in the A1 cortex following salicylate treatment. A-H. Example coronal sections of A1 cortex stained with GFAP. I. Quantitative analysis of GFAP in the A1 cortex from AT group using western blot. Bar graph shows the protein level of GFAP against β-actin in the A1 cortex, data are normalized to control. J. Quantitative analysis of GFAP in the A1 cortex from AT group using immunohistochemical staining. Bar graph shows the total IOD/area quantification of GFAP in the A1 cortex. M. The expression levels of GFAP in five layers (I, II/III, IV, V, and VI) of the A1 cortex. K. Quantitative analysis of GFAP in the A1 cortex from CT group using western blot. Bar graph shows the protein level of GFAP in the A1 cortex by normalizing against the mean of β-actin, data are normalized to control. L. Quantitative analysis of GFAP in the A1 cortex from CT group using immunohistochemical staining. Bar graph shows the total IOD/area quantification of GFAP in the A1 cortex. N. The expression levels of GFAP in five layers (I, II/III, IV, V, and VI) of the A1 cortex. One-way analysis of variance (ANOVA) followed by post hoc Scheffé test was used for multiple comparisons of total expression level in the five or three groups. Two-way analysis of variance (ANOVA) followed by post hoc Scheffé test was used for multiple comparisons of different A1 cortical layers across the five or three groups. Data are presented as mean ± SEM, n value are shown in each bar. *P < 0.05, **P < 0.01, ***P < 0.001, compared with control group.
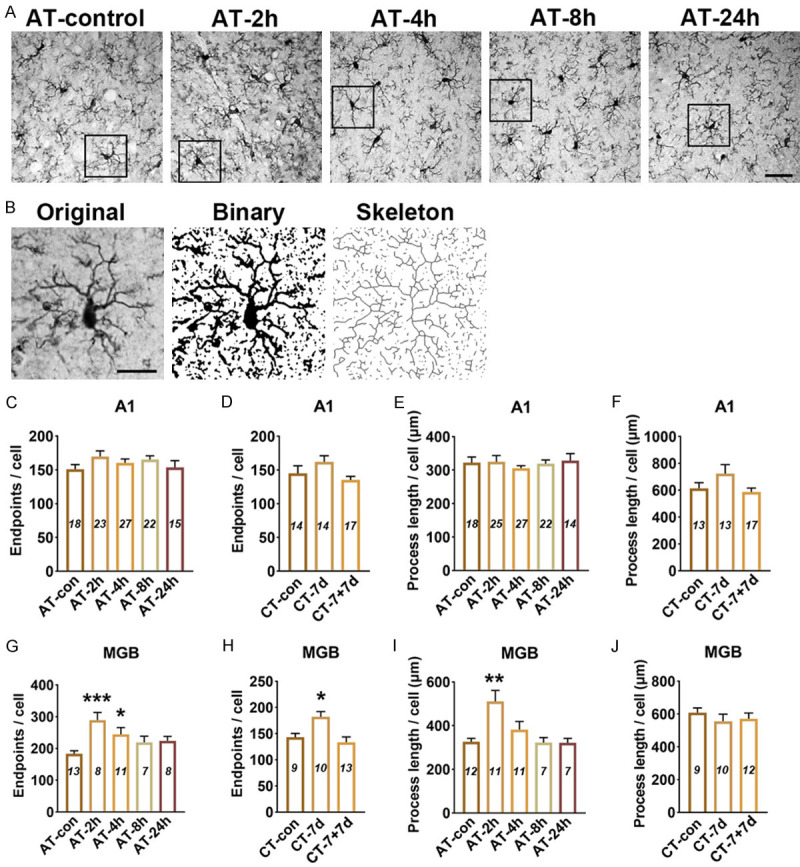
Figure 4.
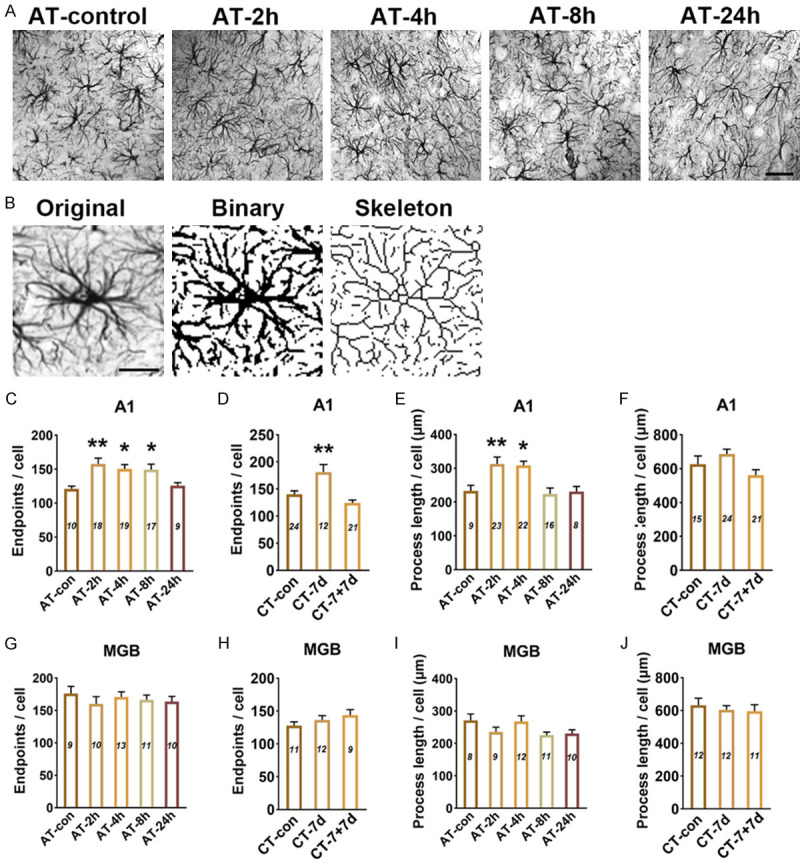
Skeleton analysis of astrocyte morphology in the A1 cortex and MGB following salicylate treatment. A. Example images of GFAP stained in A1 cortex from AT group. Scale bars: 30 μm. B. GFAP stained images were converted to binary images and skeletonized by image J for analysis. Scale bars: 15 μm. C-F. Quantitative analysis of endpoints and length of processes of astrocyte in the A1 cortex after salicylate treatment. G-J. Quantitative analysis of endpoints and length of processes of astrocyte in the MGB after salicylate treatment. The number of astrocyte in each field was quantified in order to normalize skeleton data, the number of (EP/C) and the process length/cell (LE/C) were analyzed. One-way analysis of variance (ANOVA) followed by post hoc Scheffé test was used for multiple comparisons of total expression level in the five or three groups. Data were presented as mean ± SEM, n value are shown in each bar. *P < 0.05, **P < 0.01, compared with control group.
GFAP expression and astrocyte morphology in the MGB after salicylate treatment
WB experiments showed that the expression level of GFAP in the MGB was slightly increased at 4 h after acute salicylate treatment, but with no statistically difference compared with control group (P=0.0587) (Figure 3I). IHC experiments showed that the expression level of GFAP in the MGB was significantly increased at 4 h (P < 0.05), the up-regulation of GFAP recovered to control level at 8 h after acute salicylate treatment (Figure 3A-E, 3J). Subdivision analysis found that the up-regulation of GFAP in the MGB at 4 h after salicylate treatment was only presented in the mMGB (P < 0.01) (Figure 3M). There was no statistically difference of GFAP expression in the MGB of rats from CT-control, CT-7 d and CT-7+7 d (Figure 3F-H, 3K, 3L and 3N). Morphological analysis showed that acute and chronic administrations of salicylate have no effect on the morphology of astrocyte in MGB (Figure 4A, 4B and 4G-J). The results suggest that astrocyte in the mMGB maybe transiently into activated-state phase at 4 h, and recover to resting state at 8 h after salicylate treatment.
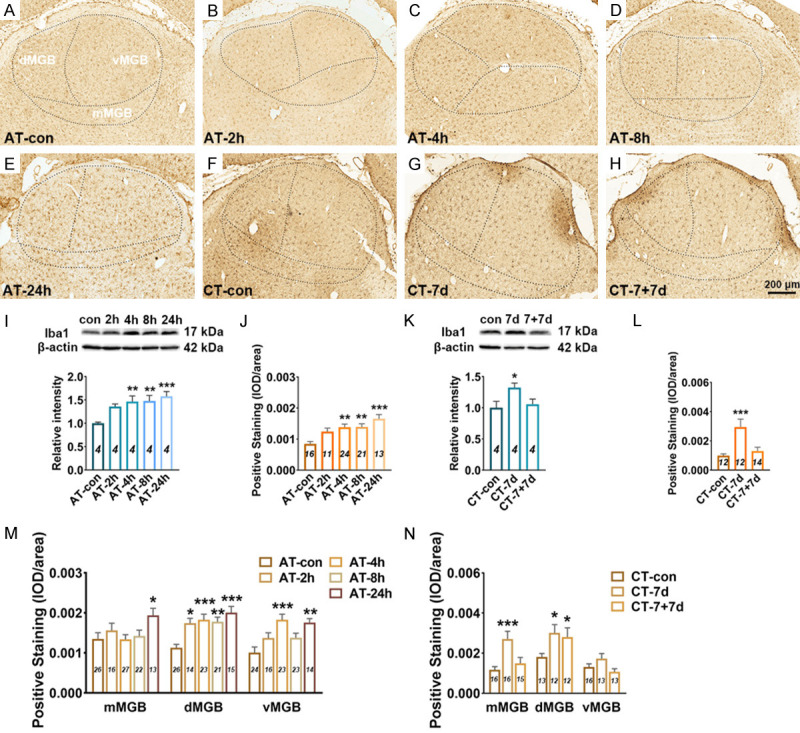
Figure 3.
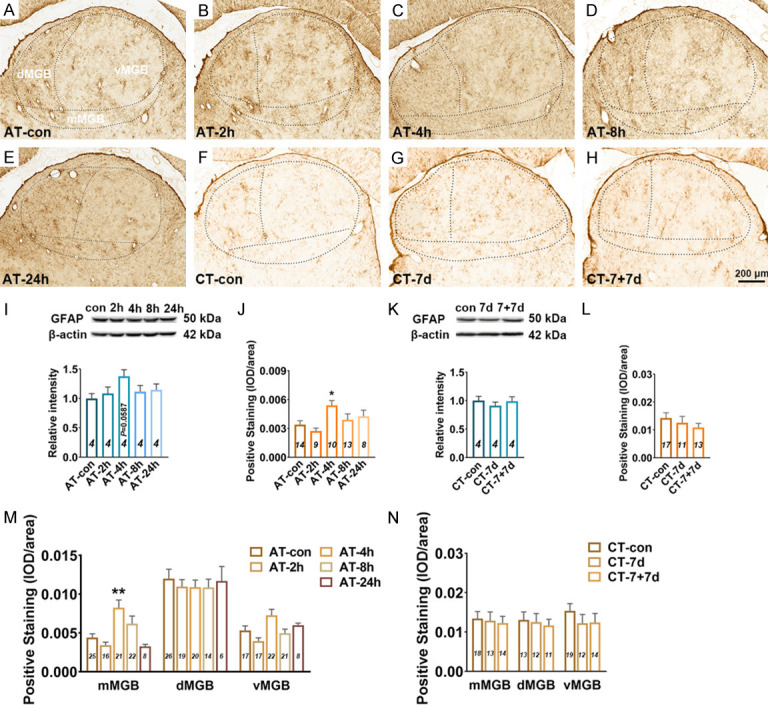
Changes in GFAP expression in the MGB following salicylate treatment. A-H. Example coronal sections including MGB stained with GFAP. I. Quantitative analysis of GFAP in the MGB from AT group using western blot. Bar graph shows the protein level of GFAP against β-actin in the MGB, data are normalized to control. J. Quantitative analysis of GFAP in the MGB from AT group using immunohistochemical staining. Bar graph shows the total IOD/area quantification of GFAP in the MGB. M. The expression levels of GFAP in the subdivisions (mMGB, vMGB and dMGB) of the MGB. K. Quantitative analysis of GFAP in the MGB from CT group using western blot. Bar graph shows the protein level of GFAP in the MGB by normalizing against the mean of β-actin, data are normalized to control. L. Quantitative analysis of GFAP in the MGB from CT group using immunohistochemical staining. Bar graph shows the total IOD/area quantification of GFAP in the MGB. N. The expression levels of GFAP in three subdivisions of the MGB. One-way analysis of variance (ANOVA) followed by post hoc Scheffé test was used for multiple comparisons of total expression level in the five or three groups. Two-way analysis of variance (ANOVA) followed by post hoc Scheffé test was used for multiple comparisons of different MGB subdivisions across the five or three groups. Data are presented as mean ± SEM, n value are shown in each bar. *P < 0.05, **P < 0.01, ***P < 0.001, compared with control group.
Iba1 expression and microglia morphology in the A1 cortex after salicylate treatment
Microglia activation is widely defined as up-regulation of the specific marker (such as Iba1) and morphological changes from the ramified shape to a nonramified, amoeboid shape [26]. After acute salicylate treatment, the expression level of Iba1 showed a significant increasement in the A1 cortex of rats from AT-4 h (P < 0.01 in WB, P < 0.05 in IHC), AT-8 h (P < 0.001 in WB, P < 0.01 in IHC) and AT-24 h (P < 0.001 in WB, P < 0.05 in IHC) groups, compared with that from AT-control group (Figure 5A-E, 5I and 5J). Through laminar-analysis, it was found that the up-regulation of Iba1 were presented across five layers of the rat A1 cortex after acute salicylate treatment (Figure 5M). After chronic salicylate treatment, the expression level of Iba1 in the A1 cortex was significant increased verified by WB (P < 0.01) and IHC (P < 0.01). The increased expression of Iba1 in the A1 cortex was recovered to control level after 7-days recovery (Figure 5F-H, 5K and 5L). In addition, the up-regulation of Iba 1 was mainly presented in the layer II/III (P < 0.001), IV (P < 0.01), V (P < 0.05) and VI (P < 0.01) of the A1 cortex after chronic salicylate treatment (Figure 5N). The obvious hypertrophy and nonramified, amoeboid shape of microglia in the A1 cortex was undetectable following salicylate treatment (Figure 7A and 7B). Besides, the number of EP/C and the LE/C of microglia remained unchanged in the A1 cortex following salicylate treatment (Figure 7C-F). These results point out that microglia are not activated, but possibly shown with a novel pathological state in the A1 cortex following salicylate treatment.
Figure 5.

Changes in Iba1 expression in the A1 cortex following salicylate treatment. A-H. Example coronal sections of A1 cortex stained with Iba1. I. Quantitative analysis of Iba1 in the A1 cortex from AT group using western blot. Bar graph shows the protein level of Iba1 against β-actin in the A1 cortex, data are normalized to control. J. Quantitative analysis of Iba1 in the A1 cortex from AT group using immunohistochemical staining. Bar graph shows the total IOD/area quantification of Iba1 in the A1 cortex. M. The expression levels of Iba1 in five layers (I, II/III, IV, V, and VI) of the A1 cortex. K. Quantitative analysis of Iba1 in the A1 cortex from CT group using western blot. Bar graph shows the protein level of Iba1 in the A1 cortex by normalizing against the mean of β-actin, data are normalized to control. L. Quantitative analysis of Iba1 in the A1 cortex from CT group using immunohistochemical staining. Bar graph shows the total IOD/area quantification of Iba1 in the A1 cortex. N. The expression levels of Iba1 in five layers of the A1 cortex. The n value (italics) of each group is presented in the bar graph. One-way analysis of variance (ANOVA) followed by post hoc Scheffé test was used for multiple comparisons of total expression level in the five or three groups. Two-way analysis of variance (ANOVA) followed by post hoc Scheffé test was used for multiple comparisons of different A1 cortical layers across the five or three groups. Data are presented as mean ± SEM, n value are shown in each bar. *P < 0.05, **P < 0.01, ***P < 0.001, compared with control group.
Figure 7.
Skeleton analysis of microglia morphology in the A1 cortex and MGB following salicylate treatment. A. Example images of Iba1 stained in A1 cortex from AT group. Scale bars: 30 μm. B. Iba1 stained images were converted to binary images and skeletonized by image J for analysis. Scale bars: 15 μm. C-F. Quantitative analysis of endpoints and length of processes of microglia in the A1 cortex after salicylate treatment. G-J. Quantitative analysis of endpoints and length of processes of microglia in the MGB after salicylate treatment. The number of astrocyte in each field was quantified in order to normalize skeleton data, the number of (EP/C) and the process length/cell (LE/C) were analyzed. One-way analysis of variance (ANOVA) followed by post hoc Scheffé test was used for multiple comparisons. Data were presented as mean ± SEM, n value are shown in each bar. *P < 0.05, **P < 0.01, ***P < 0.001, compared with control group.
Iba1 expression and microglia morphology in the MGB after salicylate treatment
The expression level of Iba1 in the MGB significantly increased at 4 h (P < 0.01 in WB, P < 0.01 in IHC), 8 h (P < 0.01 in WB, P < 0.01 in IHC) and 24 h (P < 0.001 in WB, P < 0.001 in IHC) after acute salicylate treatment (Figure 6A-E, 6I and 6J). Subdivision analysis showed that the up-regulation of Iba1 mainly presented in the dMGB and vMGB after acute salicylate treatment (Figure 6M). After chronic salicylate treatment, the expression level of Iba1 in the MGB was significantly increased detected by WB (P < 0.05) and IHC (P < 0.001), and the up-regulation was returned to normal level after 7-days recovery (Figure 6F-H, 6K, 6L). In addition, it was found that the expression level of Iba1 was mainly up-regulated in the mMGB and dMGB after chronic salicylate treatment (Figure 6N). The obvious hypertrophy and nonramified, amoeboid shape of microglia in the MGB was undetectable following salicylate treatment. The number of EP/C of microglia increased at 2 h (P < 0.001) and 4 h (P < 0.05), and the LE/C of microglia increased at 4 h (P < 0.01) after acute salicylate treatment (Figure 7G and 7I). In addition, the number of EP/C of microglia in the MGB increased following chronic salicylate treatment (P < 0.05), and recover to normal level after 7-days recovery, but the LE/C of microglia remained unchanged (Figure 7H and 7J). These results point out that microglia are not activated, but are proliferated accompanied with increased number of branch in the MGB following salicylate treatment.
Figure 6.
Changes in Iba1 expression in the MGB following salicylate treatment. A-H. Example coronal sections including MGB stained with Iba1. I. Quantitative analysis of Iba1 in the MGB from AT group using western blot. Bar graph shows the protein level of Iba1 against β-actin in the MGB, data are normalized to control. J. Quantitative analysis of Iba1 in the MGB from AT group using immunohistochemical staining. Bar graph shows the total IOD/area quantification of Iba1 in the MGB. M. The expression levels of Iba1 in the subdivisions (mMGB, vMGB and dMGB) of the MGB. K. Quantitative analysis of Iba1 in the MGB cortex from CT group using western blot. Bar graph shows the protein level of Iba1 in the MGB by normalizing against the mean of β-actin, data are normalized to control. L. Quantitative analysis of Iba1 in the MGB from CT group using immunohistochemical staining. Bar graph shows the total IOD/area quantification of Iba1 in the A1 cortex. N. The expression levels of Iba1 in three subdivisions of the MGB. One-way analysis of variance (ANOVA) followed by post hoc Scheffé test was used for multiple comparisons of total expression level in the five or three groups. Two-way analysis of variance (ANOVA) followed by post hoc Scheffé test was used for multiple comparisons of different MGB subdivisions across the five or three groups. Data are presented as mean ± SEM, n value are shown in each bar. *P < 0.05, **P < 0.01, ***P < 0.001, compared with control group.
IL-1β expression in the A1 cortex and MGB after salicylate treatment
Pathological astrocyte and microglia can produce and release multiple proinflammatory mediators [34]. Here, the expression level of IL-1β was examined in the A1 cortex and MGB. The mRNA level of IL-1β in the A1 cortex decreased at 2 h (P < 0.001) and 4 h (P < 0.001), recovered at 8 h after acute salicylate treatment (Figure 8C), but that of IL-1β remained unchanged after chronic salicylate treatment (Figure 8E). The protein level of IL-1β in the A1 cortex significantly increased at 4 h (P < 0.01), 8 h (P < 0.05) and 24 h (P < 0.05) after acute treatment of salicylate (Figure 8A and 8D), as well significantly increased after chronic salicylate treatment (P < 0.01) and the elevated IL-1β protein recovered to normal level following 7-days recovery (Figure 8F). In the MGB, the mRNA level of IL-1β increased at 8 h and 24 h, while the protein level of IL-1β increased at 4 h after acute salicylate treatment (Figure 8B, 8G and 8H). The mRNA and protein levels of IL-1β were both almost constant after chronic salicylate treatment (Figure 8I and 8J).
Figure 8.
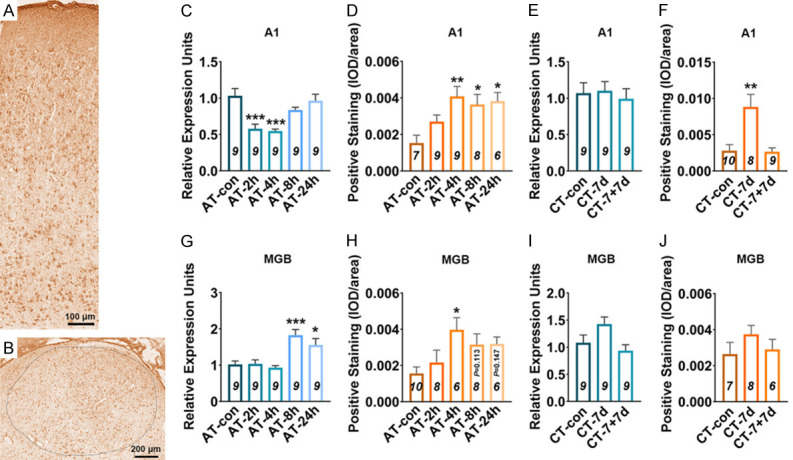
Changes in IL-1β expression in the A1 cortex and MGB following salicylate treatment. A, B. Example coronal sections of A1 cortex and MGB stained with IL-1β. C, D. Quantitative analysis of mRNA and protein of IL-1β in the A1 cortex from AT group. E, F. Quantitative analysis of mRNA and protein of IL-1β in the A1 cortex from CT group. G, H. Quantitative analysis of mRNA and protein of IL-1β in the MGB from AT group. I, J. Quantitative analysis of mRNA and protein of IL-1β in the MGB from CT group. One-way analysis of variance (ANOVA) followed by post hoc Scheffé test was used for multiple comparisons. Data are presented as mean ± SEM, n value of each group is presented in each bar graph. *P < 0.05, **P < 0.01 and ***P < 0.001, compared with control group.
Discussion
In the present study, gap-prepulse inhibition of the acoustic startle reflex (GPIAS) [35], a widely used behavioral test was employed to assess behavioral evidence of tinnitus in rats following acute or chronic treatment of salicylate. As is well-known, GPIAS is based on the acoustic startle reflex evoked by a short and intense sound following a constant background sound, the reflex can be inhibited in the presence of a silent gap embedded before startle stimulus. Moreover, the pre-pulse inhibition (PPI) of the startle reflex has been highlighted as one of the most reliable paradigms for evaluating sensorimotor gating [35]. For PPI evaluation, a short duration sound-burst with the same amplitude of background sound used in GPIAS test is presented prior to the startle stimulus, which can inhibit the startle reflex reliably. Therefore, it is assumed that behavior evidence of tinnitus characterized by significant gap detection deficit is not due to temporal processing impairment or inability to hear the background sounds. High doses of salicylate can elevate ABR thresholds to approximately 20 dB SPL (< 15 dB threshold shift) [36,37]. Since gap detection performance is near its optimal level 40 dB above thresholds [38], the 65 dB background noise used in GPIAS in the current study would be ~40 dB above thresholds, the slightly elevated hearing threshold caused by salicylate has limited influence on the gap detection performance. In the present study, we confirmed that acute treatment of high dose of salicylate (350 mg/kg) is capable of inducing transient, reversible tinnitus at the frequency of 12 kHz and 16 kHz, the tinnitus-like behavior in rats was observed starting at 2 h, lasting to 8 h, and disappearing at 24 h post-salicylate administration, which is consistent with previous studies [22,36]. In addition, chronic treatment of salicylate (200 mg/kg, twice per day, 7 consecutive days) also could cause tinnitus-like behavior in rats, and the tinnitus completely eliminated 7 days after the last drug injection. The two paradigms of tinnitus established in the present study may allow us to learn the neural mechanisms underlying the salicylate-induced tinnitus.
Tinnitus, as a phantom sensation, has many similarities with neuropathic pain, which are often caused by hyperactivity and re-routing of information in the central nervous system [39]. Chronic pain is caused by long-term plastic changes of peripheral and central systems, and possibly involves both neurons and glial cells [33]. Glial cells, an important part of the nervous system, have been emerging as indispensable contributors to normal physiological function of neuronal circuit, including auditory brainstem circuit assembly [40]. The potential role of glia cells (including astrocyte and microglia) has attracted increasing attention in noise-induced hearing loss and tinnitus recently [24,26,41]. Physiologically, astrocytes participate in maintaining neural homeostasis via facilitating intercellular transmission of Ca2+ signaling and exchanging of cytosolic contents, and displaying oscillations in ion permeability through astrocytic networks. After pathological injuries, astrocytes exhibit variable alterations in functions and morphologies, subsequently cause neural dyshomeostasis [33]. Sensory information mainly propagates through the cortical column along the layer IV→II/III→V/VI pathway [42,43]. To date, tinnitus-associated hyperactivity in the layer II/III of A1 cortex has been well documented [20], but not in other cortical layers so far. The present study demonstrated the elevated GFAP expression as well as increased endpoints and process length of astrocyte in the A1 cortex following salicylate treatment, strongly indicating obvious astrocyte reaction in the auditory cortex when the rats are experiencing tinnitus. Notably, the identified astrocyte activation presented at all the layers of A1 cortex during tinnitus, including layer II/III. The result likely hint a potential role of astrocyte involved in tinnitus-associated neuronal hyper-excitability in auditory cortex. Hyperactivity in the auditory cortex during tinnitus process may due to the reduction of GABA concentration [44-46]. Glutamine derived by astrocyte can serve as the precursor for neurotransmitters including glutamate and GABA [47-49]. The key enzyme for glutamine generating is glutamine synthetase, which is essentially only expressed in astrocytes [49,50]. Therefore, the present study may indicate that astrocyte involves in regulating excitatory and inhibitory neurotransmission and contribute to tinnitus-associated hyper-excitability in the A1 cortex.
MGB, consisted of three subdivisions: lemniscalvMGB, non-lemniscal dMGB, and mMGB [51,52], is an obligate acoustic relay to transmit sensory information to higher-order auditory and limbic centers. Tinnitus-related maladaptive plasticity in MGB may alter the gating function of MGB and lead to enhanced gain in central auditory and non-auditory centers [53]. Tinnitus-related abnormal neural activity in vMGB and dMGB has been documented [21,22], but that in mMGB needs to be verified. The present study demonstrated that GFAP expression was almost constant in vMGB and dMGB, instead only slightly increased in mMGB at 4 h following acute salicylate treatment. mMGB receives from and projects to non-auditory areas, changes in mMGB may contribute to emotion during tinnitus, resulting in tinnitus-related depression [52,54]. However, whether mMGB involves in tinnitus-associated events and the potential role of activated astrocyte in mMGB needs to be further approached.
Microglia, the brain-resident immune cells, plays key roles in physiological neural development and homeostasis, but also in the occurrence and development of diseases [25]. In the absence of pathological insult, microglia interacts with axonal terminals and dendritic spines, and regulates neuronal activity in the sensory cortex [55]. Microglial activation occurs under any case of pathologic insult in the brain, which is driven by pro- or anti-inflammatory molecules, cytokines or other signaling molecules [56]. The present study demonstrated the significantly increased of Iba1 expression in the A1 cortex (from layer I to layer VI) and MGB (including mMGB, dMGB and vMGB) of rats with tinnitus. Noteworthy, during the up-regulation of Iba1, the ramified microglial morphology was not transitioned into nonramified and amoeboid shapes in the A1 cortex as well as MGB. It is well known that microglia activation is widely characterized by elevated expression of specific marker and nonramified/amoeboid shapes [26,57], the microglia in the A1 cortex and MGB following salicylate treatment seem impossible to define as activated state, but they were transformed into pathological state absolutely. The results found in the present study are inconsistent with a previous studies report that microglia are obviously activated in the cochlear nucleus and A1 cortex of rodents with noise-induced hearing loss [26,58,59], which might be attributed to salicylate, an aspirin metabolite used for tinnitus induction. There are emerging evidences indicating that the elongation of microglial process is associated with the transformation of microglia from a pro-inflammatory to an anti-inflammatory state [60]. In the present study, the elongation of microglia process was found in the MGB at 2 h, and that recovered to control level quickly after acute salicylate treatment. This interesting phenomenon possibly hints a protective role of microglia in the MGB at the early stage of tinnitus induced by acute salicylate treatment.
Neuroinflammation is a hallmark of multiple pathologies in peripheral and central systems, it often has two defining features including elevated expression of proinflammatory cytokines and microglial activation [61]. A recent study reporting elevated expression of proinflammatory cytokines (TNF-α, IL-1β and IL-18) in mice A1 cortex following noise exposure highlights a potential role of neuroinflammation in noise-induced hearing disorders. The present study showed markedly elevated IL-1β protein in the A1 cortex after salicylate treatment. Confusingly, the changing tendency of IL-1β mRNA was inconsistent with that of IL-1β protein in the A1 cortex after salicylate treatment, which may possibly be attributed to dynamic variation in DNA transcription efficiency and/or protein degradation rate. In addition, IL-1β was also up-regulated at mRNA and protein level in the MGB after acute salicylate treatment. It has been well-documented that IL-1β is able to act on IL-1β receptors expressed in microglia and astrocytes in an autocrine and paracrine manner, subsequently resulting in further activation of glial cells and enhanced neuronal activation in the spinal dorsal horn [62]. IL-1β can also directly regulate both excitatory and inhibitory neurotransmission in the spinal dorsal horn. Pharmacological blockade of IL-1 signaling can relief chronic pain [63-65]. Therefore, whether elevated IL-1β involves in mediating tinnitus-related aberrant neuronal activity in central auditory system is worth exploring. The results mentioned above potently implicate that anti-inflammation may be an attractive therapeutic strategy for prevention and treatment of tinnitus.
Inflammatory responses common in both Alzheimer’s disease (AD) and cerebral stroke include gliosis and up-regulation of inflammatory cytokines [66-68]. As anti-inflammatory drug, aspirin has been proved to be a potential therapeutic agent of AD and stroke by controlling the spread of inflammation [69,70]. Interestingly, the present study revealed the up-regulation of IL-1β in the central auditory system after salicylate treatment, which was speculated as a subsequent pathological reaction of tinnitus via salicylate treatment. Certainly, the expression patterns of nuclear factor-kappa B and other inflammatory cytokines in central auditory system following salicylate treatment needs to be further investigated, and the mechanical link between inflammatory responses and tinnitus deserves to be profoundly approached.
Conclusion
The present study demonstrated a significant and close relationship between glia activation/proliferation in the central auditory system and salicylate-induced tinnitus-like behavior in rats, which may help to shed light on a novel perspective for understanding tinnitus pathogenesis.
Acknowledgements
This work was supported by the National Natural Science Foundation of China (81900930, 31771191), and the Postdoctoral Science Foundation of China (2018M640407).
Disclosure of conflict of interest
None.
References
- 1.Baizer JS, Lobarinas E, Salvi R, Allman BL. Brain research special issue: advances in the neuroscience of tinnitus. Brain Res. 2012;1485:1–2. doi: 10.1016/j.brainres.2012.10.033. [DOI] [PubMed] [Google Scholar]
- 2.Eggermont JJ, Roberts LE. The neuroscience of tinnitus. Trends Neurosci. 2004;27:676–682. doi: 10.1016/j.tins.2004.08.010. [DOI] [PubMed] [Google Scholar]
- 3.McCormack A, Edmondson-Jones M, Somerset S, Hall D. A systematic review of the reporting of tinnitus prevalence and severity. Hear Res. 2016;337:70–79. doi: 10.1016/j.heares.2016.05.009. [DOI] [PubMed] [Google Scholar]
- 4.Ryan D, Bauer CA. Neuroscience of tinnitus. Neuroimaging Clin N Am. 2016;26:187–196. doi: 10.1016/j.nic.2015.12.001. [DOI] [PubMed] [Google Scholar]
- 5.Adjamian P, Sereda M, Hall DA. The mechanisms of tinnitus: perspectives from human functional neuroimaging. Hear Res. 2009;253:15–31. doi: 10.1016/j.heares.2009.04.001. [DOI] [PubMed] [Google Scholar]
- 6.Cheng S, Xu G, Zhou J, Qu Y, Li Z, He Z, Yin T, Ma P, Sun R, Liang F. A multimodal meta-analysis of structural and functional changes in the brain of tinnitus. Front Hum Neurosci. 2020;14:28. doi: 10.3389/fnhum.2020.00028. [DOI] [PMC free article] [PubMed] [Google Scholar]
- 7.Allan TW, Besle J, Langers DR, Davies J, Hall DA, Palmer AR, Adjamian P. Neuroanatomical alterations in tinnitus assessed with magnetic resonance imaging. Front Aging Neurosci. 2016;8:221. doi: 10.3389/fnagi.2016.00221. [DOI] [PMC free article] [PubMed] [Google Scholar]
- 8.Shore SE, Roberts LE, Langguth B. Maladaptive plasticity in tinnitus-triggers, mechanisms and treatment. Nat Rev Neurol. 2016;12:150–160. doi: 10.1038/nrneurol.2016.12. [DOI] [PMC free article] [PubMed] [Google Scholar]
- 9.Yang S, Weiner BD, Zhang LS, Cho SJ, Bao S. Homeostatic plasticity drives tinnitus perception in an animal model. Proc Natl Acad Sci U S A. 2011;108:14974–14979. doi: 10.1073/pnas.1107998108. [DOI] [PMC free article] [PubMed] [Google Scholar]
- 10.Tang D, Li H, Chen L. Advances in understanding, diagnosis, and treatment of tinnitus. Adv Exp Med Biol. 2019;1130:109–128. doi: 10.1007/978-981-13-6123-4_7. [DOI] [PubMed] [Google Scholar]
- 11.Miyakawa A, Wang W, Cho SJ, Li D, Yang S, Bao S. Tinnitus correlates with downregulation of cortical glutamate decarboxylase 65 expression but not auditory cortical map reorganization. J Neurosci. 2019;39:9989–10001. doi: 10.1523/JNEUROSCI.1117-19.2019. [DOI] [PMC free article] [PubMed] [Google Scholar]
- 12.Muhlnickel W, Elbert T, Taub E, Flor H. Reorganization of auditory cortex in tinnitus. Proc Natl Acad Sci U S A. 1998;95:10340–10343. doi: 10.1073/pnas.95.17.10340. [DOI] [PMC free article] [PubMed] [Google Scholar]
- 13.Weisz N, Moratti S, Meinzer M, Dohrmann K, Elbert T. Tinnitus perception and distress is related to abnormal spontaneous brain activity as measured by magnetoencephalography. PLoS Med. 2005;2:e153. doi: 10.1371/journal.pmed.0020153. [DOI] [PMC free article] [PubMed] [Google Scholar]
- 14.Day RO, Graham GG, Bieri D, Brown M, Cairns D, Harris G, Hounsell J, Platt-Hepworth S, Reeve R, Sambrook PN, et al. Concentration-response relationships for salicylate-induced ototoxicity in normal volunteers. Br J Clin Pharmacol. 1989;28:695–702. doi: 10.1111/j.1365-2125.1989.tb03562.x. [DOI] [PMC free article] [PubMed] [Google Scholar]
- 15.Mongan E, Kelly P, Nies K, Porter WW, Paulus HE. Tinnitus as an indication of therapeutic serum salicylate levels. JAMA. 1973;226:142–145. [PubMed] [Google Scholar]
- 16.Jastreboff PJ, Brennan JF, Coleman JK, Sasaki CT. Phantom auditory sensation in rats: an animal model for tinnitus. Behav Neurosci. 1988;102:811–822. doi: 10.1037//0735-7044.102.6.811. [DOI] [PubMed] [Google Scholar]
- 17.Yang G, Lobarinas E, Zhang L, Turner J, Stolzberg D, Salvi R, Sun W. Salicylate induced tinnitus: behavioral measures and neural activity in auditory cortex of awake rats. Hear Res. 2007;226:244–253. doi: 10.1016/j.heares.2006.06.013. [DOI] [PubMed] [Google Scholar]
- 18.Yin M, Xia C, Wu C, Ji Y, Zhou Y. Aberrant expression of Nav1.6 in the cochlear nucleus correlates with salicylate-induced tinnitus in rats. Biochem Biophys Res Commun. 2020;526:786–792. doi: 10.1016/j.bbrc.2020.03.123. [DOI] [PubMed] [Google Scholar]
- 19.Yanagawa Y, Takasu K, Osanai H, Tateno T. Salicylate-induced frequency-map reorganization in four subfields of the mouse auditory cortex. Hear Res. 2017;351:98–115. doi: 10.1016/j.heares.2017.06.003. [DOI] [PubMed] [Google Scholar]
- 20.Wang HT, Luo B, Zhou KQ, Xu TL, Chen L. Sodium salicylate reduces inhibitory postsynaptic currents in neurons of rat auditory cortex. Hear Res. 2006;215:77–83. doi: 10.1016/j.heares.2006.03.004. [DOI] [PubMed] [Google Scholar]
- 21.Sametsky EA, Turner JG, Larsen D, Ling L, Caspary DM. Enhanced GABAA-mediated tonic inhibition in auditory thalamus of rats with behavioral evidence of tinnitus. J Neurosci. 2015;35:9369–9380. doi: 10.1523/JNEUROSCI.5054-14.2015. [DOI] [PMC free article] [PubMed] [Google Scholar]
- 22.Su YY, Luo B, Jin Y, Wu SH, Lobarinas E, Salvi RJ, Chen L. Altered neuronal intrinsic properties and reduced synaptic transmission of the rat’s medial geniculate body in salicylate-induced tinnitus. PLoS One. 2012;7:e46969. doi: 10.1371/journal.pone.0046969. [DOI] [PMC free article] [PubMed] [Google Scholar]
- 23.Akdemir ES, Huang AY, Deneen B. Astrocytogenesis: where, when, and how. F1000Res. 2020;9:F1000. doi: 10.12688/f1000research.22405.1. [DOI] [PMC free article] [PubMed] [Google Scholar]
- 24.Fang L, Fu Y, Zhang TY. Salicylate-induced hearing loss trigger structural synaptic modifications in the ventral cochlear nucleus of rats via medial olivocochlear (MOC) feedback circuit. Neurochem Res. 2016;41:1343–1353. doi: 10.1007/s11064-016-1836-x. [DOI] [PubMed] [Google Scholar]
- 25.Wolf SA, Boddeke HW, Kettenmann H. Microglia in physiology and disease. Annu Rev Physiol. 2017;79:619–643. doi: 10.1146/annurev-physiol-022516-034406. [DOI] [PubMed] [Google Scholar]
- 26.Wang W, Zhang LS, Zinsmaier AK, Patterson G, Leptich EJ, Shoemaker SL, Yatskievych TA, Gibboni R, Pace E, Luo H, Zhang J, Yang S, Bao S. Neuroinflammation mediates noise-induced synaptic imbalance and tinnitus in rodent models. PLoS Biol. 2019;17:e3000307. doi: 10.1371/journal.pbio.3000307. [DOI] [PMC free article] [PubMed] [Google Scholar]
- 27.Turner JG, Brozoski TJ, Bauer CA, Parrish JL, Myers K, Hughes LF, Caspary DM. Gap detection deficits in rats with tinnitus: a potential novel screening tool. Behav Neurosci. 2006;120:188–195. doi: 10.1037/0735-7044.120.1.188. [DOI] [PubMed] [Google Scholar]
- 28.Li S, Choi V, Tzounopoulos T. Pathogenic plasticity of Kv7.2/3 channel activity is essential for the induction of tinnitus. Proc Natl Acad Sci U S A. 2013;110:9980–9985. doi: 10.1073/pnas.1302770110. [DOI] [PMC free article] [PubMed] [Google Scholar]
- 29.Young K, Morrison H. Quantifying microglia morphology from photomicrographs of immunohistochemistry prepared tissue using imageJ. J Vis Exp. 2018:57648. doi: 10.3791/57648. [DOI] [PMC free article] [PubMed] [Google Scholar]
- 30.Morrison H, Young K, Qureshi M, Rowe RK, Lifshitz J. Quantitative microglia analyses reveal diverse morphologic responses in the rat cortex after diffuse brain injury. Sci Rep. 2017;7:13211. doi: 10.1038/s41598-017-13581-z. [DOI] [PMC free article] [PubMed] [Google Scholar]
- 31.Morrison HW, Filosa JA. A quantitative spatiotemporal analysis of microglia morphology during ischemic stroke and reperfusion. J Neuroinflammation. 2013;10:4. doi: 10.1186/1742-2094-10-4. [DOI] [PMC free article] [PubMed] [Google Scholar]
- 32.Gzielo K, Soltys Z, Rajfur Z, Setkowicz ZK. The impact of the ketogenic diet on glial cells morphology. A quantitative morphological analysis. Neuroscience. 2019;413:239–251. doi: 10.1016/j.neuroscience.2019.06.009. [DOI] [PubMed] [Google Scholar]
- 33.Ji RR, Berta T, Nedergaard M. Glia and pain: is chronic pain a gliopathy? Pain. 2013;154(Suppl 1):S10–28. doi: 10.1016/j.pain.2013.06.022. [DOI] [PMC free article] [PubMed] [Google Scholar]
- 34.Grace PM, Hutchinson MR, Maier SF, Watkins LR. Pathological pain and the neuroimmune interface. Nat Rev Immunol. 2014;14:217–231. doi: 10.1038/nri3621. [DOI] [PMC free article] [PubMed] [Google Scholar]
- 35.Galazyuk A, Hebert S. Gap-prepulse inhibition of the acoustic startle reflex (GPIAS) for tinnitus assessment: current status and future directions. Front Neurol. 2015;6:88. doi: 10.3389/fneur.2015.00088. [DOI] [PMC free article] [PubMed] [Google Scholar]
- 36.Ralli M, Lobarinas E, Fetoni AR, Stolzberg D, Paludetti G, Salvi R. Comparison of salicylate- and quinine-induced tinnitus in rats: development, time course, and evaluation of audiologic correlates. Otol Neurotol. 2010;31:823–831. doi: 10.1097/MAO.0b013e3181de4662. [DOI] [PMC free article] [PubMed] [Google Scholar]
- 37.Brennan JF, Brown CA, Jastreboff PJ. Salicylate-induced changes in auditory thresholds of adolescent and adult rats. Dev Psychobiol. 1996;29:69–86. doi: 10.1002/(SICI)1098-2302(199601)29:1<69::AID-DEV4>3.0.CO;2-K. [DOI] [PubMed] [Google Scholar]
- 38.Syka J, Rybalko N, Mazelova J, Druga R. Gap detection threshold in the rat before and after auditory cortex ablation. Hear Res. 2002;172:151–159. doi: 10.1016/s0378-5955(02)00578-6. [DOI] [PubMed] [Google Scholar]
- 39.Rauschecker JP, May ES, Maudoux A, Ploner M. Frontostriatal gating of tinnitus and chronic pain. Trends Cogn Sci. 2015;19:567–578. doi: 10.1016/j.tics.2015.08.002. [DOI] [PMC free article] [PubMed] [Google Scholar]
- 40.Cramer KS, Rubel EW. Glial cell contributions to auditory brainstem development. Front Neural Circuits. 2016;10:83. doi: 10.3389/fncir.2016.00083. [DOI] [PMC free article] [PubMed] [Google Scholar]
- 41.Feng J, Bendiske J, Morest DK. Degeneration in the ventral cochlear nucleus after severe noise damage in mice. J Neurosci Res. 2012;90:831–841. doi: 10.1002/jnr.22793. [DOI] [PMC free article] [PubMed] [Google Scholar]
- 42.Constantinople CM, Bruno RM. Deep cortical layers are activated directly by thalamus. Science. 2013;340:1591–1594. doi: 10.1126/science.1236425. [DOI] [PMC free article] [PubMed] [Google Scholar]
- 43.Zhou Y, Yin M, Xia C, Wang X, Wu H, Ji Y. Visual deprivation modifies glutamate receptor expression in visual and auditory centers. Am J Transl Res. 2019;11:7523–7537. [PMC free article] [PubMed] [Google Scholar]
- 44.Sedley W, Parikh J, Edden RA, Tait V, Blamire A, Griffiths TD. Human auditory cortex neurochemistry reflects the presence and severity of tinnitus. J Neurosci. 2015;35:14822–14828. doi: 10.1523/JNEUROSCI.2695-15.2015. [DOI] [PMC free article] [PubMed] [Google Scholar]
- 45.Wang HT, Luo B, Zhou KQ, Xu TL, Chen L. Sodium salicylate reduces inhibitory postsynaptic currents in-neurons of rat auditory cortex. Hear Res. 2006;215:77–83. doi: 10.1016/j.heares.2006.03.004. [DOI] [PubMed] [Google Scholar]
- 46.Lu J, Lobarinas E, Deng A, Goodey R, Stolzberg D, Salvi RJ, Sun W. GABAergic neural activity involved in salicylate-induced auditory cortex gain enhancement. Neuroscience. 2011;189:187–198. doi: 10.1016/j.neuroscience.2011.04.073. [DOI] [PMC free article] [PubMed] [Google Scholar]
- 47.Reubi JC, Van Der Berg C, Cuenod M. Glutamine as precursor for the GABA and glutamate trasmitter pools. Neurosci Lett. 1978;10:171–174. doi: 10.1016/0304-3940(78)90030-7. [DOI] [PubMed] [Google Scholar]
- 48.Schousboe A. Metabolic signaling in the brain and the role of astrocytes in control of glutamate and GABA neurotransmission. Neurosci Lett. 2019;689:11–13. doi: 10.1016/j.neulet.2018.01.038. [DOI] [PubMed] [Google Scholar]
- 49.Schousboe A, Bak LK, Waagepetersen HS. Astrocytic control of biosynthesis and turnover of the neurotransmitters glutamate and GABA. J Neurosci. 2019;39:5269–5283. doi: 10.3389/fendo.2013.00102. [DOI] [PMC free article] [PubMed] [Google Scholar]
- 50.Norenberg MD, Martinez-Hernandez A. Fine structural localization of glutamine synthetase in astrocytes of rat brain. Brain Res. 1979;161:303–310. doi: 10.1016/0006-8993(79)90071-4. [DOI] [PubMed] [Google Scholar]
- 51.Lee CC, Winer JA. Connections of cat auditory cortex: I. Thalamocortical system. J Comp Neurol. 2008;507:1879–1900. doi: 10.1002/cne.21611. [DOI] [PMC free article] [PubMed] [Google Scholar]
- 52.Winer JA, Kelly JB, Larue DT. Neural architecture of the rat medial geniculate body. Hear Res. 1999;130:19–41. doi: 10.1016/s0378-5955(98)00216-0. [DOI] [PubMed] [Google Scholar]
- 53.Kalappa BI, Brozoski TJ, Turner JG, Caspary DM. Single unit hyperactivity and bursting in the auditory thalamus of awake rats directly correlates with behavioural evidence of tinnitus. J Physiol. 2014;592:5065–5078. doi: 10.1113/jphysiol.2014.278572. [DOI] [PMC free article] [PubMed] [Google Scholar]
- 54.Tang J, Yang W, Suga N. Modulation of thalamic auditory neurons by the primary auditory cortex. J Neurophysiol. 2012;108:935–942. doi: 10.1152/jn.00251.2012. [DOI] [PMC free article] [PubMed] [Google Scholar]
- 55.Tremblay ME, Lowery RL, Majewska AK. Microglial interactions with synapses are modulated by visual experience. PLoS Biol. 2010;8:e1000527. doi: 10.1371/journal.pbio.1000527. [DOI] [PMC free article] [PubMed] [Google Scholar]
- 56.York EM, Bernier LP, MacVicar BA. Microglial modulation of neuronal activity in the healthy brain. Dev Neurobiol. 2018;78:593–603. doi: 10.1002/dneu.22571. [DOI] [PubMed] [Google Scholar]
- 57.Donat CK, Scott G, Gentleman SM, Sastre M. Microglial activation in traumatic brain injury. Front Aging Neurosci. 2017;9:208. doi: 10.3389/fnagi.2017.00208. [DOI] [PMC free article] [PubMed] [Google Scholar]
- 58.Baizer JS, Wong KM, Manohar S, Hayes SH, Ding D, Dingman R, Salvi RJ. Effects of acoustic trauma on the auditory system of the rat: the role of microglia. Neuroscience. 2015;303:299–311. doi: 10.1016/j.neuroscience.2015.07.004. [DOI] [PMC free article] [PubMed] [Google Scholar]
- 59.Fuentes-Santamaria V, Alvarado JC, Melgar-Rojas P, Gabaldon-Ull MC, Miller JM, Juiz JM. The role of Glia in the peripheral and central auditory system following noise overexposure: contribution of TNF-alpha and IL-1beta to the pathogenesis of hearing loss. Front Neuroanat. 2017;11:9. doi: 10.3389/fnana.2017.00009. [DOI] [PMC free article] [PubMed] [Google Scholar]
- 60.Yang R, Wang H, Wen J, Ma K, Chen D, Chen Z, Huang C. Regulation of microglial process elongation, a featured characteristic of microglial plasticity. Pharmacol Res. 2019;139:286–297. doi: 10.1016/j.phrs.2018.11.028. [DOI] [PubMed] [Google Scholar]
- 61.Graeber MB, Li W, Rodriguez ML. Role of microglia in CNS inflammation. FEBS Lett. 2011;585:3798–3805. doi: 10.1016/j.febslet.2011.08.033. [DOI] [PubMed] [Google Scholar]
- 62.Gruber-Schoffnegger D, Drdla-Schutting R, Honigsperger C, Wunderbaldinger G, Gassner M, Sandkuhler J. Induction of thermal hyperalgesia and synaptic long-term potentiation in the spinal cord lamina I by TNF-alpha and IL-1beta is mediated by glial cells. J Neurosci. 2013;33:6540–6551. doi: 10.1523/JNEUROSCI.5087-12.2013. [DOI] [PMC free article] [PubMed] [Google Scholar]
- 63.Gabay E, Wolf G, Shavit Y, Yirmiya R, Tal M. Chronic blockade of interleukin-1 (IL-1) prevents and attenuates neuropathic pain behavior and spontaneous ectopic neuronal activity following nerve injury. Eur J Pain. 2011;15:242–248. doi: 10.1016/j.ejpain.2010.07.012. [DOI] [PubMed] [Google Scholar]
- 64.Kawasaki Y, Zhang L, Cheng JK, Ji RR. Cytokine mechanisms of central sensitization: distinct and overlapping role of interleukin-1beta, interleukin-6, and tumor necrosis factor-alpha in regulating synaptic and neuronal activity in the superficial spinal cord. J Neurosci. 2008;28:5189–5194. doi: 10.1523/JNEUROSCI.3338-07.2008. [DOI] [PMC free article] [PubMed] [Google Scholar]
- 65.Yan X, Li F, Maixner DW, Yadav R, Gao M, Ali MW, Hooks SB, Weng HR. Interleukin-1beta released by microglia initiates the enhanced glutamatergic activity in the spinal dorsal horn during paclitaxel-associated acute pain syndrome. Glia. 2019;67:482–497. doi: 10.1002/glia.23557. [DOI] [PubMed] [Google Scholar]
- 66.Harari OA, Liao JK. NF-kappaB and innate immunity in ischemic stroke. Ann N Y Acad Sci. 2010;1207:32–40. doi: 10.1111/j.1749-6632.2010.05735.x. [DOI] [PMC free article] [PubMed] [Google Scholar]
- 67.Kostulas N, Pelidou SH, Kivisakk P, Kostulas V, Link H. Increased IL-1beta, IL-8, and IL-17 mRNA expression in blood mononuclear cells observed in a prospective ischemic stroke study. Stroke. 1999;30:2174–2179. doi: 10.1161/01.str.30.10.2174. [DOI] [PubMed] [Google Scholar]
- 68.McGeer PL, McGeer EG. The inflammatory response system of brain: implications for therapy of Alzheimer and other neurodegenerative diseases. Brain Res Brain Res Rev. 1995;21:195–218. doi: 10.1016/0165-0173(95)00011-9. [DOI] [PubMed] [Google Scholar]
- 69.Ansara AJ, Nisly SA, Arif SA, Koehler JM, Nordmeyer ST. Aspirin dosing for the prevention and treatment of ischemic stroke: an indication-specific review of the literature. Ann Pharmacother. 2010;44:851–862. doi: 10.1345/aph.1M346. [DOI] [PubMed] [Google Scholar]
- 70.Jaturapatporn D, Isaac MG, McCleery J, Tabet N. Aspirin, steroidal and non-steroidal anti-inflammatory drugs for the treatment of Alzheimer’s disease. Cochrane Database Syst Rev. 2012 doi: 10.1002/14651858.CD006378.pub2. CD006378. [DOI] [PMC free article] [PubMed] [Google Scholar]