Abstract
The purpose of this study was to construct and validate a model for predicting nonalcoholic fatty liver disease (NAFLD) in the non-obese Chinese population. A total of 13240 NAFLD-free individuals at baseline from a 4-y longitudinal study were allocated to a training cohort (n=8872) and a validation cohort (n=4368). The overall incidence of NAFLD was 13%. Nine significant predictors including age, gender, body mass index, fasting blood glucose, total cholesterol, triglycerides, high-density lipoprotein cholesterol, uric acid and alanine aminotransferase were identified and constructed for the nomogram using cox proportional hazards regression analyses. The concordance index was 0.804 and 0.802 in the training and validation cohorts, respectively. In the training cohort, the area under the ROC curve (AUC) for 1-y, 2-y, 3-y and 4-y risk was 0.835, 0.825, 0.816 and 0.782, respectively. Likewise, in the validation cohort, the AUC for 1-y, 2-y, 3-y and 4-y risk was 0.817, 0.820, 0.814 and 0.813. The calibration curves for NAFLD risk showed excellent accuracy in the predictive modeling of the nomogram, internally and externally. The nomogram categorized individuals into high- and low-risk groups, and the DCA displayed the clinical usefulness of the nomogram for predicting NAFLD incidence. Our nomogram can predict a personalized risk of NAFLD in the non-obese Chinese population. This nomogram can serve as a simple and affordable tool for stratifying individuals at a high risk of NAFLD, and thus serve to expedite treatment of NAFLD.
Keywords: Nonalcoholic fatty liver disease, predictive modeling, risk factor, nomogram
Introduction
Nonalcoholic fatty liver disease (NAFLD) is the most common chronic liver disease, affecting approximately 25.24% of the global population [1]. The prevalence of NAFLD is 31% in South America, 32% in the Middle East, 14% in Africa, and 27% in Asia, varying from 24.77% to 43.91% in the Chinese population [2]. NAFLD is increasingly identified as one of the major causes of liver-related morbidity, mortality, and liver transplantation. In addition, NAFLD is indirectly associated with cardiovascular disease, type 2 diabetes mellitus (T2DM), and chronic kidney disease [3].
The prevalence of NAFLD is higher in cohorts with obesity, T2DM, dyslipidemia and metabolic syndrome. However, NAFLD can be found in non-obese individuals, and it seems to be higher in Asians, even when strict body mass index (BMI) criteria (>25 kg/m2) is used to define obesity. The percentage of non-obese Asians with NAFLD is reported to 12.6% in Korea, 75% in India, and 7.3% in China [4]. In addition, research findings have proven that elevated low-density lipoprotein cholesterol (LDL-c) levels are positively associated with NAFLD incidence. Interestingly, Sun et al. [5] reported that LDL-c levels within the normal range were positively associated with NAFLD incidence in non-obese individuals.
Nomograms have been widely developed for risk prediction models of various diseases [6]. Although several predictive models have been developed to evaluate the risk of NAFLD based on machine learning techniques [7,8], a simple nomogram, to our knowledge, has not been established specifically to estimate the risk of NAFLD in a non-obese population with normal LDL-c levels. This study aimed to construct and validate a nomogram predicting NAFLD in a non-obese population, and provide a personalized prediction tool by cost-effective and accessible variables.
Materials and methods
Study population
We downloaded the raw data from the Dryad Digital Repository (http://www.datadryad.org/), which were shared by Sun et al. [9]. This longitudinal study consisted of 16173 NAFLD-free individuals at baseline, though complete data was only obtained for 13240 individuals at the 4-y follow-up. All eligible individuals were divided into two cohorts in a 2:1 ratio, using computer-generated random numbers. Therefore, 8872 individuals were assigned to the training cohort, whereas 4368 individuals were assigned to the validation cohort. A flow chart is depicted in Figure 1. NAFLD was diagnosed by hepatic ultrasound examination, excluding alcoholic hepatitis, viral hepatitis, or other known causes of liver disease. Individuals were excluded if they had a BMI of ≥25 kg/m2, LDL-c of >3.12 mmol/L, or had a history of hypertension, diabetes, and hyperlipidemia. The clinical data extracted included age, sex, BMI, systolic blood pressure, diastolic blood pressure, fasting plasma glucose (FBG), total cholesterol (TC), triglycerides (TG), high-density lipoprotein cholesterol (HDL-c), LDL-c, blood urea nitrogen (BUN), creatinine (Cr), uric acid (UA), alanine aminotransferase (ALT), aspartate aminotransferase (AST), gamma-glutamyl transferase (GGT), total bilirubin (TBil), direct bilirubin (DBil), follow-up time and the diagnosis of NAFLD. Ethical approval was not necessary because no data was directly collected from the participants.
Figure 1.
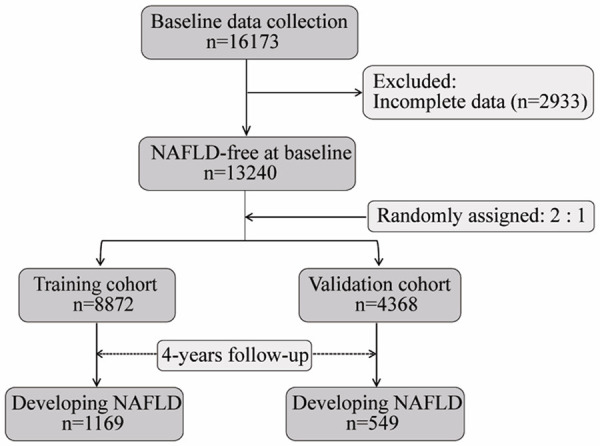
The flow diagram of the study. A total of 16173 NAFLD-free individuals at baseline were initially collected, and 2933 individuals were excluded for their incomplete data. Subsequently, 13240 eligible individuals were randomly categorized into training cohort (n=8872) and validation cohort (n=4368) in a 2:1 ratio. During 4 years of follow-up, 1169 and 549 individuals developed NAFLD in the training cohort and validation cohort, respectively. NAFLD: nonalcoholic fatty liver disease.
Development of the nomogram
A univariate Cox regression analysis was first performed to evaluate the clinical candidate variables at P<0.10. Subsequently, significant variables were then included in a multivariate Cox regression analysis. Finally, a nomogram was constructed to estimate risk of developing NAFLD by incorporating selected predictors from the training cohort using a stepwise forward selection model [10].
Validation of the nomogram
We validated the nomogram internally for the training cohort and externally for the validation cohort. Harrell concordance index (C-index) was applied to evaluate the predictive modeling of the nomogram, and a C-index >0.8 suggested good discrimination. A receiver operating characteristic (ROC) curve was also applied to assess discriminating ability, and the area under the ROC curve (AUC) was >0.7, indicating a good performance of the nomogram. A calibration curve was applied to measure the predictive accuracy of the nomogram. Bootstraps with 100 resamples were used for the calibration assessment.
Construction of risk signature
Risk scores were calculated based on multivariate Cox coefficients and selected values. Individuals were categorized into high- and low-risk groups based on the median risk score. Risk curves were plotted using data from the training and validation cohorts.
Assessing the clinical usefulness of the nomogram
The clinical usefulness of the nomogram was evaluated using a decision curve analysis (DCA) for the whole cohort. DCA is a method for evaluating and comparing predictive models and calculating the net benefits against threshold probabilities [11].
ROC analysis of identified risk factors for predicting NAFLD
We performed ROC analysis to evaluate the performance and optimal cutoff values of identified risk factors for 4-y incidence of NAFLD in the whole cohort. The performance of risk factors for predicting in NAFLD was defined by AUC. The optimal cutoff values were defined by the highest Youden index (sensitivity + specificity-1).
Statistical analyses
Data analyses were performed using SPSS 22.0 software (SPSS Inc, Chicago, IL). Measurement data were first assessed for normal distribution, and then expressed as the means ± standard deviation and medians (interquartile ranges), respectively. This data was compared between the two groups using t tests and Mann-Whitney U tests for normally and non-normally distributed data, respectively. Enumeration data were expressed as ratios and analyzed by the χ2 test. The optimal age cut-offs comprised 14-36, 37-45, and 46-93 y and were identified by X-tile software version 3.6.1 using Monte Carlo simulations [12]. Cox regression analysis, nomogram model, C-index, calibration curve, ROC, DCA curves, and risk curves were conducted in R (http://www.R-project.org) using “survival”, “rms”, “survivalROC”, “rmda”, and “pheatmap” packages. All statistical tests were two-sided, and P<0.05 was considered statistically significant.
Results
Baseline characteristics and risk factors of NAFLD
The overall incidence of NAFLD was 13% (1718/13240) in entire cohort. There were 1169 (13.2%) and 549 (12.6%) individuals developing NAFLD in the training and validation cohorts, respectively. The median follow-up time was 2.99 y (quartile: 1.96-3.95) for the training cohort and 2.97 y (quartile: 1.95-3.92) for the validation cohort. Additionally, no statistically significant differences in clinical characteristics were observed between the two cohorts. The baseline characteristics for the training and validation sets are summarized in Table 1.
Table 1.
Baseline characteristics of training and validation cohorts
| Characteristic | Training cohort (n=8872) | Validation cohort (n=4368) | P value |
|---|---|---|---|
| Age (years) | 38 (30-48) | 37 (30-48) | 0.174 |
| Sex, no. (%) | 0.678 | ||
| Female | 4721 (53.2%) | 2348 (53.8%) | |
| Male | 4151 (46.8%) | 2020 (46.2%) | |
| Hypertention | 0.921 | ||
| Without | 7664 (86.4%) | 3776 (86.4%) | |
| With | 1208 (13.6%) | 592 (13.6%) | |
| BMI (kg/m2) | 21.13 (19.64-22.64) | 21.11 (19.55-22.64) | 0.547 |
| FBG (mmol/L) | 5.04 (4.77-5.36) | 5.04 (4.77-5.35) | 0.244 |
| TC (mmol/L) | 4.30 (3.86-4.74) | 4.29 (3.84-4.76) | 0.992 |
| TG (mmol/L) | 0.93 (0.69-1.32) | 0.93 (0.69-1.32) | 0.365 |
| LDL-c (mmol/L) | 2.31 (1.99-2.63) | 2.32 (1.97-2.65) | 0.753 |
| HDL-c (mmol/L) | 1.41 (1.20-1.64) | 1.40 (1.20-1.63) | 0.478 |
| Cr (mmol/L) | 77.70 (66.20-91.50) | 77.00 (66.00-92.00) | 0.595 |
| BUN (mmol/L) | 4.17 (3.46-4.96) | 4.22 (3.50-5.05) | 0.144 |
| UA (mmol/L) | 266.00 (214.00-329.00) | 265.00 (215.00-330.00) | 0.649 |
| ALT (U/L) | 14.00 (11.00-20.00) | 14.00 (11.00-19.00) | 0.550 |
| AST (U/L) | 20.00 (17.00-23.00) | 19.00 (17.00-23.00) | 0.896 |
| GGT (U/L) | 16.00 (12.00-23.00) | 16.00 (12.00-23.00) | 0.990 |
| TBil (μmol/L) | 12.10 (9.60-15.30) | 12.10 (9.60-15.30) | 0.659 |
| DBil (μmol/L) | 1.60 (1.30-2.00) | 1.60 (1.30-2.00) | 0.386 |
| Follow-up years | 2.99 (1.96-3.95) | 2.97 (1.95-3.92) | 0.272 |
| Incident NAFLD, no. (%) | 1169 (13.2%) | 549 (12.6%) | 0.178 |
Data are shown as numbers (%) or medians (interquartile ranges). BMI, body mass index; SBP, systolic blood pressure; DBP, diastolic blood pressure; FPG, fasting plasma glucose; TC, total cholesterol; TG, triglyceride; HDL-c, high-density lipoprotein cholesterol; LDL-c, low-density lipoprotein cholesterol; BUN, blood urea nitrogen; Cr, creatinine; UA, uric acid; ALT, alanine aminotransferase; AST, aspartate aminotransferase; GGT, gamma-glutamyl transferase; TBil, total bilirubin; DBil, direct bilirubin.
Univariate Cox regression analysis identified 15 candidate clinical variables according to their p-values, including age, sex, blood pressure, BMI, FBG, TC, TG, HDL-c, LDL-c, Cr, BUN, UA, ALT, AST and GGT. Multivariate Cox regression analysis showed that age, sex, BMI, FBG, TC, TG, UA and ALT were positively correlated with the risk of NAFLD, whereas HDL-c was negatively correlated with the risk of NAFLD (Table 2; Figure 2). In addition, the risk of NAFLD was 1.718-fold higher in males than in females.
Table 2.
Risk factors for NAFLD according to the Cox regression analyses
| Variable | Univariate analysis | Multivariate analysis | ||
|---|---|---|---|---|
|
|
|
|||
| OR (95% CI) | P value | OR (95% CI) | P value | |
| Age (years) | 1.596 [1.493, 1.706] | <0.001 | 1.276 [1.182, 1.378] | <0.001 |
| Sex (Male vs. Female) | 3.610 [3.166, 4.115] | <0.001 | 1.718 [1.416, 2.084] | <0.001 |
| Hypertension (Without vs. With) | 2.164 [1.897, 2.470] | <0.001 | 1.090 [0.940, 1.264] | 0.193 |
| BMI (kg/m2) | 1.616 [1.560, 1.674] | <0.001 | 1.417 [1.364, 1.473] | <0.001 |
| FBG (mmol/l) | 1.362 [1.305, 1.421] | <0.001 | 1.115 [1.047, 1.188] | 0.001 |
| TC (mmol/l) | 1.387 [1.270, 1.514] | <0.001 | 1.204 [1.085, 1.337] | 0.001 |
| TG (mmol/l) | 1.435 [1.401, 1.471] | <0.001 | 1.193 [1.143, 1.245] | <0.001 |
| LDL-c (mmol/l) | 1.909 [1.669, 2.184] | <0.001 | 0.909 [0.691, 1.195] | 0.714 |
| HDL-c (mmol/l) | 0.183 [0.149, 0.224] | <0.001 | 0.533 [0.420, 0.677] | <0.001 |
| Cr (mmol/l) | 1.003 [1.003, 1.004] | <0.001 | 0.990 [0.985, 1.001] | 0.051 |
| BUN (mmol/l) | 1.097 [1.060, 1.135] | <0.001 | 0.948 [0.898, 1.000] | 0.053 |
| UA (mmol/l) | 1.007 [1.006, 1.008] | <0.001 | 1.003 [1.002, 1.004] | <0.001 |
| ALT (U/L) | 1.008 [1.007, 1.009] | <0.001 | 1.017 [1.011, 1.023] | <0.001 |
| AST (U/L) | 1.007 [1.005, 1.009] | <0.001 | 0.978 [0.966, 1.001] | 0.058 |
| GGT (U/L) | 1.009 [1.008, 1.010] | <0.001 | 1.002 [1.000, 1.004] | 0.069 |
| TBil (μmol/l) | 0.999 [0.988, 1.011] | 0.910 | - | - |
| DBil (μmol/l) | 0.940 [0.853, 1.037] | 0.216 | - | - |
Data are shown as odds ratio (95% CI), P value. NAFLD, nonalcoholic fatty liver disease; BMI, body mass index; SBP, systolic blood pressure; DBP, diastolic blood pressure; FBG, fasting plasma glucose; TC, total cholesterol; TG, triglyceride; HDL-c, high-density lipoprotein cholesterol; LDL-c, low-density lipoprotein cholesterol; BUN, blood urea nitrogen; Cr, creatinine; UA, uric acid; ALT, alanine aminotransferase; AST, aspartate aminotransferase; GGT, gamma-glutamyl transferase; TBil, total bilirubin; DBil, direct bilirubin.
Figure 2.
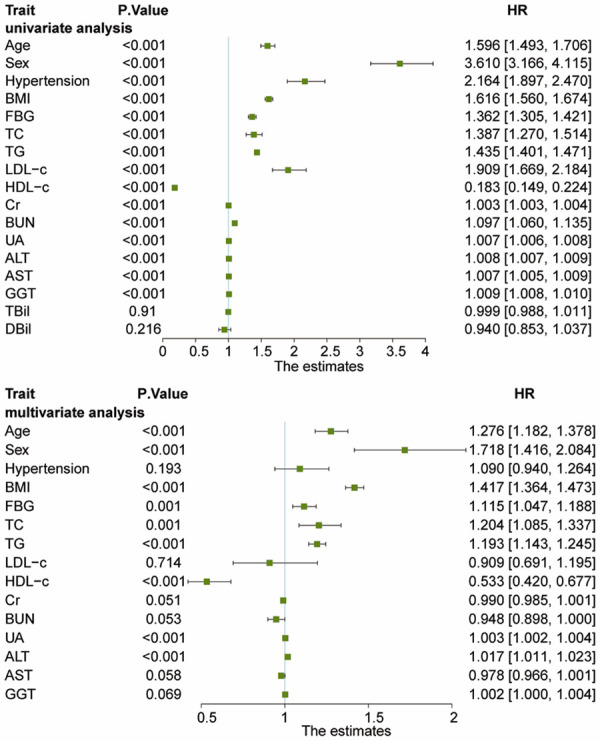
Forest plots of univariate Cox regression analysis and multivariate Cox regression analysis for estimated risk of developing NAFLD. Univariate Cox regression analysis identified 15 candidate clinical variables according to their P<0.10, including age, sex (male vs. female), hypertension (without vs. with), BMI, FBG, TC, TG, HDL-c, LDL-c, Cr, BUN, UA, ALT, AST, and GGT. Multivariate Cox regression analysis showed that age, sex (male vs. female), BMI, FBG, TC, TG, UA, and ALT were positively correlated with the risk of NAFLD, whereas HDL-c was negatively correlated with the risk of NAFLD. NAFLD, nonalcoholic fatty liver disease; BMI, body mass index; FBG, fasting plasma glucose; TC, total cholesterol; TG, triglyceride; HDL-c, high-density lipoprotein cholesterol; LDL-c, low-density lipoprotein cholesterol; BUN, blood urea nitrogen; Cr, creatinine; UA, uric acid; ALT, alanine aminotransferase; AST, aspartate aminotransferase; GGT, gamma-glutamyl transferase.
Development and validation of a NAFLD-predicting nomogram
The nomogram was constructed to predict the risk of NAFLD based on the significant predictors (age, sex, BMI, FBG, TC, TG, HDL-c, UA and ALT) in the training cohort (Figure 3). Each value for the individuals was determined according to the top Points scale, and then the points for each variable were added. Finally, a personalized risk of NAFLD was obtained according to Total Points scale.
Figure 3.
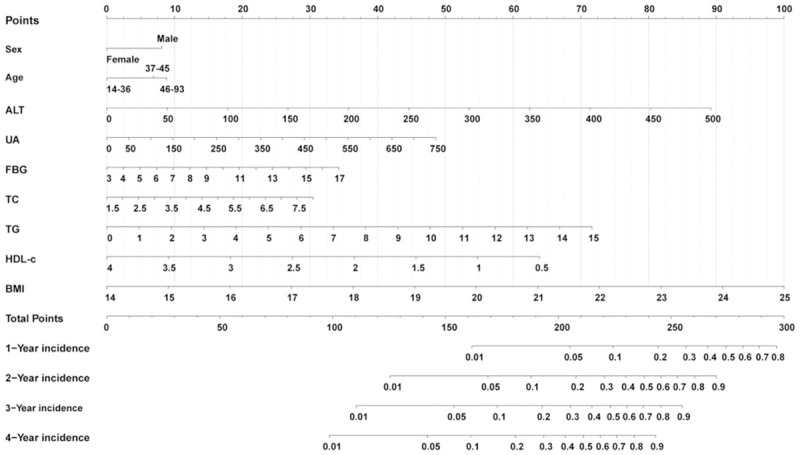
Nomogram for predicting NAFLD incidence in the non-obese Chinese population. Each variable value for the individuals was determined according to the top Points scale, and then the points for each variable were added. Finally, a personalized 1-y, 2-y, 3-y, and 4-y risk of NAFLD was obtained according to the bottom Total Points scale. NAFLD: nonalcoholic fatty liver disease.
The C-index was 0.804 [95% CI, 0.792-0.852] and 0.802 [95% CI, 0.784-0.820] for the training and validation cohorts, respectively, which demonstrated good predictive modeling by the nomogram. In the training cohort, the AUC for 1-y, 2-y, 3-y and 4-y risk was 0.835, 0.825, 0.816 and 0.782, respectively (Figure 4A). Likewise, in the validation cohort, the AUC for 1-y, 2-y, 3-y and 4-y risk was 0.817, 0.820, 0.814 and 0.813 (Figure 4B), indicating an excellent performance of the nomogram. The calibration curves for the probability of NAFLD risk showed excellent accuracy in the predictive modeling of the nomogram for both the training and validation cohorts (Figure 5A and 5B). Collectively, these results revealed that the nomogram could accurately predict NAFLD incidence in the non-obese Chinese population.
Figure 4.
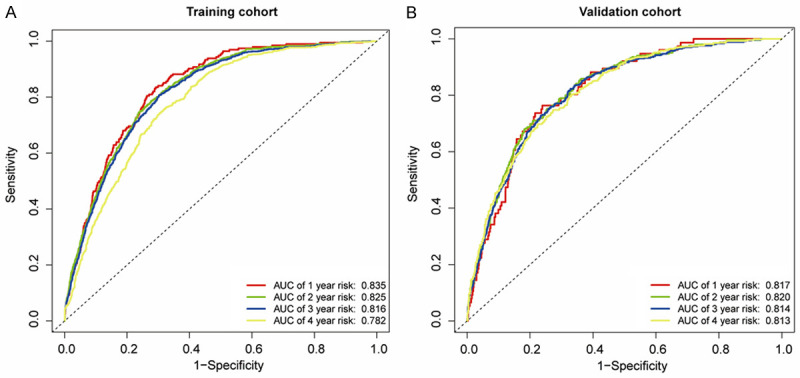
ROC curves of the nomogram in the training cohort (A) and the validation cohort (B). (A) The AUC for 1-y, 2-y, 3-y and 4-y risk of NAFLD in the training cohort. (B) The AUC for 1-y, 2-y, 3-y and 4-y risk of NAFLD in the validation cohort. All AUCs for 1-y, 2-y, 3-y and 4-y risk of NAFLD were above 0.8 in the training and validation cohorts, indicating an excellent performance of the nomogram. NAFLD: nonalcoholic fatty liver disease, ROC: receiver operating characteristics curves, AUC: area under the ROC curve.
Figure 5.
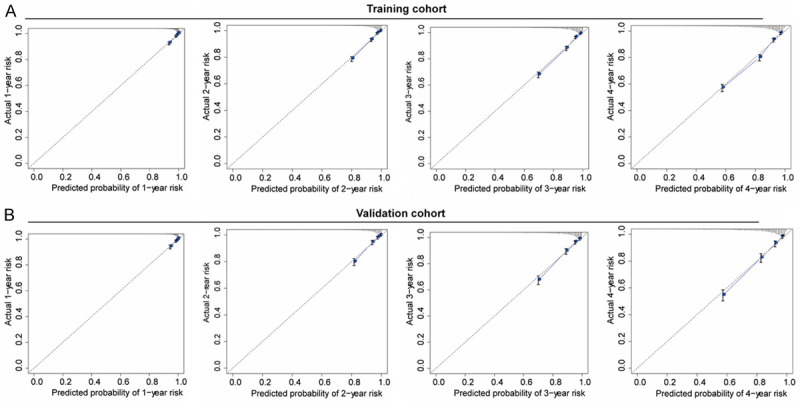
Calibration curves of the nomogram in the training cohort (A) and the validation cohort (B). The gray dashed lines indicate an ideal model, and the blue solid lines indicate the predictive performance of the nomogram. The closer the distance between two lines, the better the performance of the nomogram. The calibration curves for the probability of NAFLD risk showed excellent accuracy in the predictive modeling of the nomogram for both the training and validation cohorts. NAFLD: nonalcoholic fatty liver disease.
Construction of risk signature
Risk scores were calculated and are shown in Supplementary File 1. Individuals were categorized into high- and low-risk groups based on their median risk score. Significant differences were observed between high- and low-risk groups in the training cohort (Figure 6A and 6B) and the validation cohort (Figure 6C and 6D). Thus, this model could differentiate high- and low-risk individuals.
Figure 6.
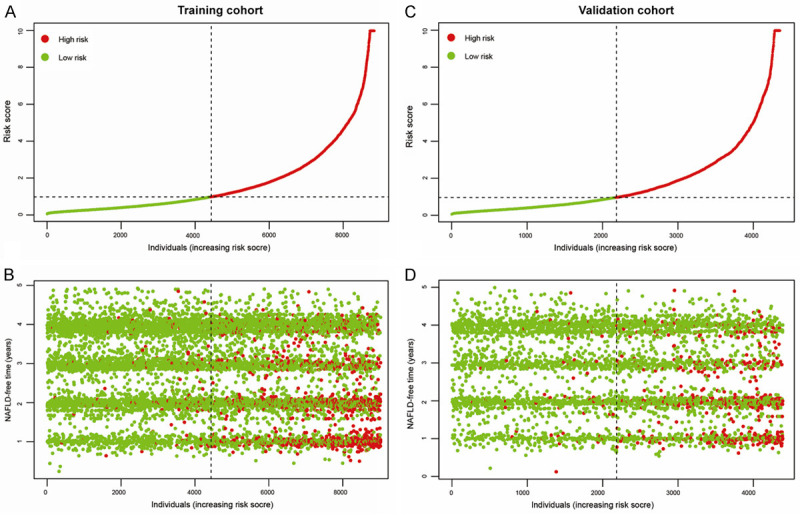
Individuals were stratified into high- or low-risk groups based on the risk score. Risk score distribution and NAFLD status in the training cohort (A and B). Risk score distribution and NAFLD status in the validation cohort (C and D). Green dot represents individuals without NAFLD, and red dot represents individuals with NAFLD, indicating this model could discriminate high-risk individuals with NAFLD from the non-obese Chinese population. NAFLD: nonalcoholic fatty liver disease.
Clinical usefulness of a NAFLD-predicting nomogram
The DCA displayed a clinical usefulness for 1-y, 2-y, 3-y, and 4-y incidence of NAFLD using data from both the training and validation cohorts. When the threshold probability ranged from 0.15 to 0.82 at 1-y, 2-y, 3-y and 4-y, the NAFLD-predicting nomogram provided more of a net benefit than the “all individuals with NAFLD” or “no individuals with NAFLD” (Figure 7A-D), which suggested that the nomogram was clinically useful. For example, in Figure 7D with regard to the 40% risk probability, the net benefit was about 8%, which could be interpreted that the model could be an alternative method for evaluating NAFLD by about 8 per 100 individuals without developing NAFLD over the next 4 years.
Figure 7.
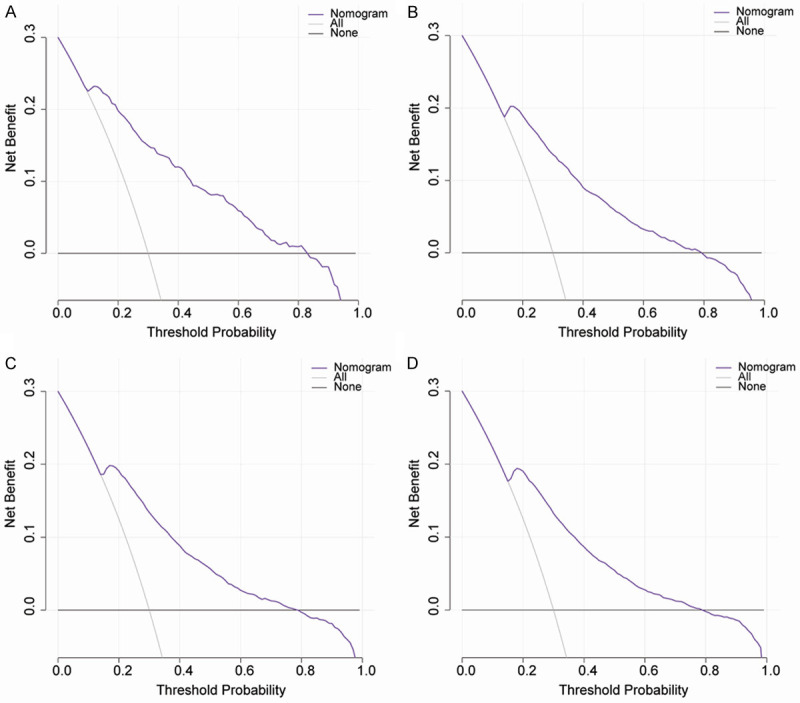
The decision curve analysis of the nomogram for 1-y (A), 2-y (B), 3-y (C), and 4-y (D) NAFLD risk throughout the whole cohort. The black line indicates the net benefit when no individuals develop NAFLD, while the gray line indicates the net benefit when all individuals suffer from NAFLD. The area among the black line, gray line, and purple line indicates the clinical usefulness of the nomogram. The area among the purple line (model curve), black line, and gray line, indicates the clinical usefulness of the model. The larger the area among the three lines, the better is the clinical value of the nomogram. NAFLD: nonalcoholic fatty liver disease.
ROC analysis of identified risk factors for predicting NAFLD
The AUC for age, ALT, UA, FBG, TC, TG, HDL-c, and BMI was 0.624, 0.680, 0.698, 0.614, 0.572, 0.748, 0.657, and 0.757, respectively, indicating that TG and BMI contribute the most to NAFLD incidence (Figure 8). The cutoff values of age, ALT, UA, FBG, TC, TG, HDL-c, and BMI were 38.500 years, 14.500 U/L, 279.500 mmol/l, 5.285 mmol/L, 4.125 mmol/L, 1.085 mmol/L, 1.395 mmol/L, and 21.517 kg/m2, respectively, to optimally predict the 4-y risk of NAFLD (Table 3).
Figure 8.
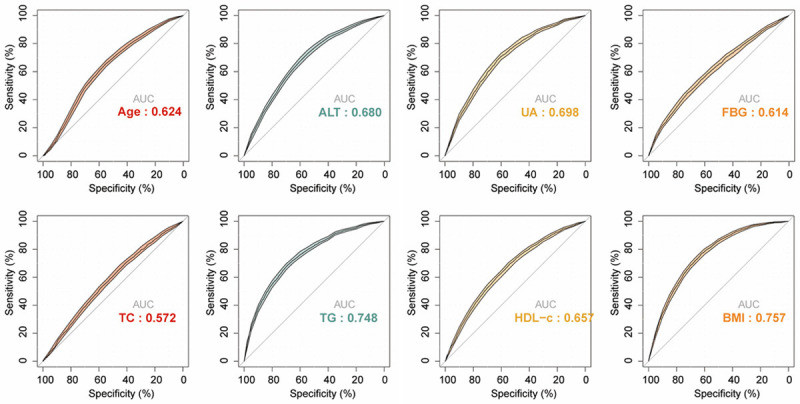
The ROC curves of identified risk factors for predicting NAFLD. The AUC for age, ALT, UA, FBG, TC, TG, HDL-c, and BMI was 0.624, 0.680, 0.698, 0.614, 0.572, 0.748, 0.657, and 0.757, respectively. NAFLD, nonalcoholic fatty liver disease; BMI, body mass index; FBG, fasting plasma glucose; TC, total cholesterol; TG, triglyceride; HDL-c, high-density lipoprotein cholesterol; UA, uric acid; ALT, alanine aminotransferase.
Table 3.
Optimal cutoff values of identified risk factors for NAFLD (n=13240)
| Variable | Cutoff value | Sensitivity (%) | Specificity (%) | Youden Index (%) |
|---|---|---|---|---|
| Age (years) | 38.500 | 65.716 | 55.173 | 20.889 |
| ALT (U/L) | 14.500 | 73.225 | 54.313 | 27.538 |
| UA (mmol/l) | 279.500 | 70.896 | 60.163 | 31.060 |
| FBG (mmol/l) | 5.285 | 44.412 | 72.618 | 17.030 |
| TC (mmol/l) | 4.125 | 69.558 | 41.729 | 11.286 |
| TG (mmol/l) | 1.085 | 70.140 | 67.436 | 37.576 |
| HDL-c (mmol/l) | 1.395 | 69.499 | 53.992 | 23.492 |
| BMI (kg/m2) | 21.517 | 77.183 | 61.847 | 39.030 |
NAFLD, nonalcoholic fatty liver disease; BMI, body mass index; FBG, fasting plasma glucose; TC, total cholesterol; TG, triglyceride; HDL-c, high-density lipoprotein cholesterol; UA, uric acid; ALT, alanine aminotransferase.
Discussion
In this longitudinal study, we constructed an easy-to-use nomogram for predicting incidence NAFLD in the non-obese Chinese population. This nomogram exhibited excellent predictive modeling for the internal training and external validation cohorts. Moreover, the nomogram categorized individuals into high- and low-risk groups, with the high-risk group displayed a significant probability of suffering from NAFLD. The DCA displayed clinical usefulness of this nomogram for predicting NAFLD incidence. To the best of our knowledge, this study is the first to develop a NAFLD-predictive nomogram for a non-obese population using easily obtained clinical parameters.
NAFLD comprises nonalcoholic simple fatty liver, nonalcoholic steatohepatitis (NASH) and cirrhosis [13]. To improve early prevention and expedite intervention, several noninvasive panels have been developed to stratify high risk groups. Previous studies have assessed the diagnostic and predictive capabilities of some models including the fatty liver index (based on BMI, TG, GGT and waist circumference), the FIB-4 index (based on age, AST, ALT and platelet count), the NAFLD fibrosis score (based on age, BMI, AST/ALT ratio, diabetes status, albumin and platelet counts), the BARD score (based on BMI, AST/ALT ratio and diabetes status), the AST/platelet ratio index, the hepatic steatosis index (based on BMI, AST/ALT ratio and diabetes status), and the noninvasive Koeln-Essen-index (based on age, AST, AST/ALT ratio and total bilirubin) [14-20].
Consistent with these models, nine significant predictors (age, sex, BMI, FBG, TC, TG, HDL-c, UA, and ALT) in our study were identified. Unexpectedly, our study found that sex was associated with NAFLD and that males, in particular, were at a higher risk for NAFLD. Research has found NAFLD to be more prevalent in males over premenopausal females, and this is possibly due to growth and sex hormones, as well as genetic factors [21]. Among these metabolic parameters, UA was first included in our NAFLD-predictive model in the non-obese population. Zheng et al. [22] noted that elevated serum UA levels were positively correlated to NAFLD risk in lean Chinese adults, independent of any other metabolic parameters. Thus, these identified parameters in our NAFLD-predictive model were reliable and accurate.
The aforementioned models were primarily established in NAFLD patients with advanced fibrosis from Western countries, and thus exhibited higher positive predictivity in populations with progressive diseases. In addition, study populations were predominately overweight or obese, which limited the use of these models in non-obese populations. Furthermore, these studies were primarily cross-sectional designs and so cannot fully address causality or temporality between predictors and NAFLD incidence. Consequently, we proposed a nomogram to predict the NAFLD incidence at 1-y, 2-y, 3-y and 4-y in a non-obese Chinese population based on data gathered from a longitudinal study. Our nomogram exhibited satisfactory discrimination and calibration capabilities using C-index, ROC and calibration plots both for the training and validation cohorts. Besides, this nomogram successfully classified individuals into high- and low-risk groups, and the high-risk group displayed a significant probability for developing NAFLD. Further, we assessed the optimal cutoff values for identified risk factors to predict NAFLD incidence, which may provide the best thresholds of age, ALT, UA, FBG, TC, TG, HDL-c, and BMI for the Chinese population. More importantly, the DCA revealed that when threshold probability ranged from 0.15 to 0.82 at 1-y, 2-y, 3-y and 4-y, the NAFLD-predicting nomogram provided more of a net benefit than the “all individuals with NAFLD” or “no individuals with NAFLD”.
A major strength in our study was that we developed a nomogram from a large sample in a longitudinal study, which provided excellent applicability to the general population, especially Asians. However, potential limitations of our study should also be considered. First, NAFLD was diagnosed by hepatic ultrasound examination, which is not the gold standard for diagnosing NAFLD because it is unable to evaluate the severity of NAFLD. Further biopsy results are needed to validate the predictive power of this nomogram. Second, some information about risk factors for NAFLD such as lifestyle variables and waist circumference were not collected, and cases with missing data were excluded from analysis, resulting in a possible selection bias. Third, this nomogram was constructed using data from a single center; multicenter studies should be performed to further validate the predictive capability of this nomogram.
Conclusions
We constructed a nomogram based on nine risk predictors, including age, sex, BMI, FBG, HDL-c, TC, TG, UA and ALT to predict NAFLD incidence in 5 years. This nomogram can be deployed as a simple and affordable tool for stratifying individuals at high risk of NAFLD, and thus serve to expedite treatment of NAFLD.
Acknowledgements
This study was supported by the National Natural Science Funds of China [grant no. 81760168]. We thank the Sun et al. for-data collection and sharing.
Disclosure of conflict of interest
None.
Supporting Information
References
- 1.Younossi ZM, Marchesini G, Pinto-Cortez H, Petta S. Epidemiology of nonalcoholic fatty liver disease and nonalcoholic steatohepatitis: implications for liver transplantation. Transplantation. 2019;103:22–27. doi: 10.1097/TP.0000000000002484. [DOI] [PubMed] [Google Scholar]
- 2.Younossi ZM, Koenig AB, Abdelatif D, Fazel Y, Henry L, Wymer M. Global epidemiology of nonalcoholic fatty liver disease-Meta-analytic assessment of prevalence, incidence, and outcomes. Hepatology. 2016;64:73–84. doi: 10.1002/hep.28431. [DOI] [PubMed] [Google Scholar]
- 3.Adams LA, Anstee QM, Tilg H, Targher G. Non-alcoholic fatty liver disease and its relationship with cardiovascular disease and other extrahepatic diseases. Gut. 2017;66:1138–1153. doi: 10.1136/gutjnl-2017-313884. [DOI] [PubMed] [Google Scholar]
- 4.Kim D, Kim WR. Nonobese fatty liver disease. Clin Gastroenterol Hepatol. 2017;15:474–485. doi: 10.1016/j.cgh.2016.08.028. [DOI] [PubMed] [Google Scholar]
- 5.Sun DQ, Liu WY, Wu SJ, Zhu GQ, Braddock M, Zhang DC, Shi KQ, Song D, Zheng MH. Increased levels of low-density lipoprotein cholesterol within the normal range as a risk factor for nonalcoholic fatty liver disease. Oncotarget. 2016;7:5728–5737. doi: 10.18632/oncotarget.6799. [DOI] [PMC free article] [PubMed] [Google Scholar]
- 6.Park SY. Nomogram: an analogue tool to deliver digital knowledge. J Thorac Cardiovasc Surg. 2018;155:1793. doi: 10.1016/j.jtcvs.2017.12.107. [DOI] [PubMed] [Google Scholar]
- 7.Ma H, Xu CF, Shen Z, Yu CH, Li YM. Application of machine learning techniques for clinical predictive modeling: a cross-sectional study on nonalcoholic fatty liver disease in China. Biomed Res Int. 2018;2018:4304376. doi: 10.1155/2018/4304376. [DOI] [PMC free article] [PubMed] [Google Scholar]
- 8.Yip TC, Ma AJ, Wong VW, Tse YK, Chan HL, Yuen PC, Wong GL. Laboratory parameter-based machine learning model for excluding non-alcoholic fatty liver disease (NAFLD) in the general population. Aliment Pharmacol Ther. 2017;46:447–456. doi: 10.1111/apt.14172. [DOI] [PubMed] [Google Scholar]
- 9.Sun DQ, Wu SJ, Liu WY, Wang LR, Chen YR, Zhang DC, Braddock M, Shi KQ, Song D, Zheng MH. Association of low-density lipoprotein cholesterol within the normal range and NAFLD in the non-obese Chinese population: a cross-sectional and longitudinal study. BMJ Open. 2016;6:e013781. doi: 10.1136/bmjopen-2016-013781. [DOI] [PMC free article] [PubMed] [Google Scholar]
- 10.Harrell FE Jr, Lee KL, Mark DB. Multivariable prognostic models: issues in developing models, evaluating assumptions and adequacy, and measuring and reducing errors. Stat Med. 1996;15:361–387. doi: 10.1002/(SICI)1097-0258(19960229)15:4<361::AID-SIM168>3.0.CO;2-4. [DOI] [PubMed] [Google Scholar]
- 11.Vickers AJ, Elkin EB. Decision curve analysis: a novel method for evaluating prediction models. Med Decis Making. 2006;26:565–574. doi: 10.1177/0272989X06295361. [DOI] [PMC free article] [PubMed] [Google Scholar]
- 12.Camp RL, Dolled-Filhart M, Rimm DL. X-tile: a new bio-informatics tool for biomarker assessment and outcome-based cut-point optimization. Clin Cancer Res. 2004;10:7252–7259. doi: 10.1158/1078-0432.CCR-04-0713. [DOI] [PubMed] [Google Scholar]
- 13.Vilar-Gomez E, Chalasani N. Non-invasive assessment of non-alcoholic fatty liver disease: clinical prediction rules and blood-based biomarkers. J Hepatol. 2018;68:305–315. doi: 10.1016/j.jhep.2017.11.013. [DOI] [PubMed] [Google Scholar]
- 14.Demir M, Lang S, Schlattjan M, Drebber U, Wedemeyer I, Nierhoff D, Kaul I, Sowa J, Canbay A, Töx U, Steffen HM. NIKEI: a new inexpensive and non-invasive scoring system to exclude advanced fibrosis in patients with NAFLD. PLoS One. 2013;8:e58360. doi: 10.1371/journal.pone.0058360. [DOI] [PMC free article] [PubMed] [Google Scholar]
- 15.Lin ZH, Xin YN, Dong QJ, Wang Q, Jiang XJ, Zhan SH, Sun Y, Xuan SY. Performance of the aspartate aminotransferase-to-platelet ratio index for the staging of hepatitis C-related fibrosis: an updated meta-analysis. Hepatology. 2011;53:726–736. doi: 10.1002/hep.24105. [DOI] [PubMed] [Google Scholar]
- 16.Lee JH, Kim D, Kim HJ, Lee CH, Yang JI, Kim W, Kim YJ, Yoon JH, Cho SH, Sung MW, Lee HS. Hepatic steatosis index: a simple screening tool reflecting nonalcoholic fatty liver disease. Dig Liver Dis. 2010;42:503–508. doi: 10.1016/j.dld.2009.08.002. [DOI] [PubMed] [Google Scholar]
- 17.Harrison SA, Oliver D, Arnold HL, Gogia S, Neuschwander-Tetri BA. Development and validation of a simple NAFLD clinical scoring system for identifying patients without advanced disease. Gut. 2008;57:1441–1447. doi: 10.1136/gut.2007.146019. [DOI] [PubMed] [Google Scholar]
- 18.Angulo P, Hui JM, Marchesini G, Bugianesi E, George J, Farrell GC, Enders F, Saksena S, Burt AD, Bida JP, Lindor K, Sanderson SO, Lenzi M, Adams LA, Kench J, Therneau TM, Day CP. The NAFLD fibrosis score: a noninvasive system that identifies liver fibrosis in patients with NAFLD. Hepatology. 2007;45:846–854. doi: 10.1002/hep.21496. [DOI] [PubMed] [Google Scholar]
- 19.Sterling RK, Lissen E, Clumeck N, Sola R, Correa MC, Montaner J, M SS, Torriani FJ, Dieterich DT, Thomas DL, Messinger D, Nelson M. Development of a simple noninvasive index to predict significant fibrosis in patients with HIV/HCV coinfection. Hepatology. 2006;43:1317–1325. doi: 10.1002/hep.21178. [DOI] [PubMed] [Google Scholar]
- 20.Bedogni G, Bellentani S, Miglioli L, Masutti F, Passalacqua M, Castiglione A, Tiribelli C. The fatty liver index: a simple and accurate predictor of hepatic steatosis in the general population. BMC Gastroenterol. 2006;6:33. doi: 10.1186/1471-230X-6-33. [DOI] [PMC free article] [PubMed] [Google Scholar]
- 21.Skubic C, Drakulić Ž, Rozman D. Personalized therapy when tackling nonalcoholic fatty liver disease: a focus on sex, genes, and drugs. Expert Opin Drug Metab Toxicol. 2018;14:831–841. doi: 10.1080/17425255.2018.1492552. [DOI] [PubMed] [Google Scholar]
- 22.Zheng X, Gong L, Luo R, Chen H, Peng B, Ren W, Wang Y. Serum uric acid and non-alcoholic fatty liver disease in non-obesity Chinese adults. Lipids Health Dis. 2017;16:202. doi: 10.1186/s12944-017-0531-5. [DOI] [PMC free article] [PubMed] [Google Scholar]
Associated Data
This section collects any data citations, data availability statements, or supplementary materials included in this article.


