Abstract
It was reported that the expression of RNA binding proteins (RBPs) in malignant tumors is dysregulated and is closely related to tumorigenesis. However, some studies have confirmed the role of RBPs in gastric cancer (GC). We obtained data on gastric cancer in The Cancer Genome Atlas (TCGA) and Genotype-Tissue Expression (GTEx), and identified RBPs that are dysregulated between gastric normal and cancer tissues. Then, we systematically investigated the expression characteristics and clinical prognostic potential of these RBPs through bioinformatics methods. We found 278 dysregulated RBPs in the GC, 91 of which were up-regulated and 181 were down-regulated. We detected 4 hub RBPs (HNRNPL, PABPN1, PCF, SNRPN) are related to overall survival (OS), and 3 hub RBPs (EEF1A2, MRPS5, PCF1) are related to disease-specific survival (DSS), and furthermore, we constructed prognostic signatures. Analysis of the OS and DSS signature showed that the GC patients with high-risk groups have worse OS and DSS than the low-risk groups. The receiver operator characteristic (ROC) curves of the 5-year survival rate of OS and DSS prognosis signature were drawn, and the areas under the two curves were 0.62 and 0.64, respectively. We constructed nomograms to predict OS and DSS, and evaluated by the calibration curve, which showed the GC prediction ability of these two models. Furthermore, the expression of the above six genes was verified by PCR, which is consistent with our results.
Keywords: Gastric cancer, RNA binding proteins, prognostic signature, bioinformatics
Introduction
Gastric cancer (GC) is a heterogeneous gastrointestinal disease. According to global cancer statistics, new cases of GC and death pathology account for approximately 5.7% and 8.2% of all tumors [1]. Among them, the incidence and mortality of gastric cancer in East Asia are prominent higher than other regions. In China, GC is a high-risk tumor disease which incidence is second only to lung cancer, and the mortality rate is lower than that of lung cancer and liver cancer [2]. The majority of GC patients are lack of screening and have no obvious symptom at the early stage [1,3]. In addition, high postoperative recurrence rate, chemotherapy toxicity, drug resistance, and poor prognosis significantly reduced survival ratio, especially in patients with advanced GC, whose five-year survival rate does not exceed 30% [4]. Therefore, the development of cancer molecular biomarkers for diagnosis, prediction and treatment of GC is essential to improve quality of life and five-year survival rate of patients.
RNA binding proteins (RBPs) accurately recognize RNA binding domains, interact with multiple RNAs and participate in RNA cleavage, transport, sequence editing, intracellular localization and translation control regulate the process [5,6]. Therefore, RBPs regulate cell functions changes or disturbances, which may lead to disease. Until now, there are over 1,500 RBPs genes have been screened and identified through RNA-seq screening technologies in cancer cells [6]. Due to different affinity or concentration, distinctions in RBPs expression can lead to erroneous interactions with target RNA, thereby forming erroneous RBPs complexes. Such RBPs can affect every post-transcriptional event in the affected cells and regulate the cell phenotype to a pathological state. Multiple researches indicated that dysregulation of RBP expression has been observed in various human diseases including cancer [7-9]. RBPs made great contribution in the origin and progression of cancer [10,11]. They significantly impacted the growth and proliferation of tumor cells, avoided immune surveillance, induced angiogenesis and activated metastasis [12]. Although the function of RBPs in other tumors has been thoroughly studied, the mechanism of RBPs affect the progress in gastric cancer has not been eliminated.
In the last few decades, several studies have reported that the RBPs in GC are dysregulated and affect the expression of related proteins, which related to tumor progression [13,14]. For instance, NF90 protein enhances its stability by directly binding to TMEM98 mRNA and promotes GC progression [15]. PTBP3 mediates the variable shear of CAV1 to affect the invasion and migration of GC [16]. In addition, the DDX6 protein acts as an RNA binding protein of FGFR2 and FGFR2 mRNA, and actively regulates the expression of HER2 and FGFR2 in GC cells in the post-transcription stage [17]. These evidence shows that RBPs play a crucial role in GC, which helps us to initially understand its function in GC. Therefore, we integrated gastric cancer and normal gastric tissue sequencing and clinical pathology data from The Cancer Genome Atlas (TCGA) database and the Genotype-Tissue Expression (GTEx) database, and analyze the abnormal expression of RBPs between tumor and normal samples through RNA-seq bioinformatics. After a systematic analysis, we identified a group of RBPs that are dysregulated in stomach adenocarcinoma (STAD) to investigate their molecular biological functions and potential mechanisms that affect STAD. Some of these RBPs may serve as potential biomarkers for STAD for accurate diagnosis and prognosis.
Materials and methods
Datasets and data processing
In this study, we downloaded the STAD transcriptome fragments per Kilobase million (FPKM) data from TCGA (https://tcga-data.nci.nih.gov/tcga/), which contained 375 STAD tissues and 32 normal gastric tissues [18]. In order to increase the normal sample size and strengthen comparative analysis [19], we also downloaded human normal tissue transcripts per kilobase million (TPM) data from GTEx (https://www.gtexportal.org/) and extracted 359 normal stomach tissues [20]. We searched the University California Santa Cruz Xena (UCSC Xena, https://xena.ucsc.edu/) to identify the clinical data, including OS and DSS. Extract 2005 RNA-binding proteins associated with tumors from RBPTD (http://www.rbptd.com/) [21]. For TCGA-STAD data, in order to eliminate the error caused by the quantitative mRNA abundance of FPKM in multiple samples, we convert FPKM to TPM for standardization [22]. After converting the TPM values of TCGA and GTEx to log (TPM + 1), use the combat function of “sva” R package to combine to normalization and remove batch effect [23]. The P-values of DEGs between the STAD sample of TCGA combined with GTEx data and the normal sample was analyzed using wilcox test by the “limma” R package [24]. The cut-off threshold in TCGA combined with GTEx was |log2 fold change (FC)| ≥ 1.0 and false discovery rate (FDR) < 0.05 to Identify RBPs that are differentially expressed in GC.
Gene ontology (GO) and kyoto encyclopedia of genes and genomes (KEGG) enrichment analysis
GO define and describe the functions of genes and proteins, and update the semantic vocabulary standards as research continues. It covers three aspects of biology: cell components (CC), molecular functions (MF), and biological processes (BP). KEGG helps to study genes and expression information as a whole network, and systematically analyzes the metabolic pathways of gene products in cells and databases of the functions of these gene products. The online website DAVID 6.8 (https://david.ncifcrf.gov/) was used for enrichment analysis [25]. The enrichment results with P-value and FDR value below 0.05 are considered meaningful. The visual GO and KEGG enrichment results were performed by “GOplot” R packages [26].
Construction and analysis of protein-protein interaction (PPI) network
STRING is a protein interaction database, which used for the interaction between known proteins and predicted proteins [27]. We introduced DEGs into STRING to construct the gene interaction network for discover the core genes. Then, we use Cytoscape software (version:3.6.1, http://www.cytoscape.org/), the biograph visualization software to build a comprehensive model of biomolecular interactions [28]. Cytoscape’s pluggable unit molecular complex detection (MCODE) is a module for screening PPI networks [29]. Take the cut-off degree = 2, cut-off point = 0.2, k-core = 2, max depth = 100 as the network score and cluster search parameter settings, then analyze the key modules.
Prognostic model construction
We used the Survival R software package to analyze Univariate and multivariate Cox regression, and combined them to trace the OS and DSS correlation of all hub RBPs in key modules. Then, according to the results of multivariate Cox regression analysis, we constructed risk proportional models related to OS and DSS respectively. Subsequently, we calculated the risk score of each GC sample by the formula: Risk score = β1 × Exp1 + β2 × Exp2 + βi × Expi (β: coefficient value, EXP: gene expression level). Taking the median risk score as the boundary, the STAD patients were divided into low-risk group and high-risk group. Finally, we use the log-rank test to compare the OS differences between the two groups and draw the time-dependence receiver operating characteristic (ROC) curve by “SurvivalROC” R package to evaluate the prognostic performance of these two models on OS and DSS [30].
Nomogram construction and verification
We used the “rms” and “survival” packages in R software to respectively construct a nomogram composed of the hub RBPs to provide clinicians with a basis for judging the prognosis of gastric cancer patients. Subsequently, we drew a calibration curve to evaluate the accuracy of the nomogram to predict survival.
Validation of expression level and prognostic
We analyzed the relationship between the expression levels of OS-related and DSS-related RBPs in TCGA-STAD and used Kaplan-Meier to analyze the potential of two groups of prognostic model hub RBPs to predict OS and DSS. then, we verified the expression level of the protein of hub RBPs in the OS and DSS models through the Human Protein Atlas (HPA) database (http://www.proteinatlas.org/) [31]. To further validate our research, we implemented quantitative real-time PCR to detect the expression of RBPs that constitute the prognostic signature of OS and DSS. We collected 10 patients (n = 20) who suffered curative resection of gastric cancer in the Gastrointestinal Surgery Department General Surgery Department of the Second Affiliated Hospital of Nanchang University, and were diagnosed as gastric cancer by pathology. The study complied with the Declaration of Helsinki and was approved by the Ethics Committee of the Second Affiliated Hospital of Nanchang University. Each patient signed an informed consent form. Follow the instructions, we used TRIzol reagent (Invitrogen, Carlsbad CA, USA) to extract total RNA from frozen samples to determine the concentration and purity of RNA, and utilized RR047A kit (Takara, Japan) for reverse transcription, RR820A kit (Takara, Japan) for qRT-PCR, with β-actin as an internal control, the primer sequences are in Table S1. We calculated 2^(-ΔCt) represents the expression of each gene and used paired t test to analyze the expression difference between normal and gastric cancer tissues.
Results
Selection of dysregulated RBPs
The role and prognostic value of relational RBPs in STAD was analyzed through various statistical calculation methods. The design diagram was shown in Figure 1. Combined with the TCGA and GTEx databases, 375 gastric cancer samples and 391 non-tumor control samples were covered in this study. According to the information of RBPTD, 1936 RBPs were extracted for in-depth analysis. A total of 278 RBPs (Table S2) including 97 up-regulated and 181 down-regulated gene that met the exclusion criteria of differential expression (FDR < 0.05, |log2 FC| ≥ 1.0). A heat map and volcano plot for visualization were shown in Figure 2.
Figure 1.
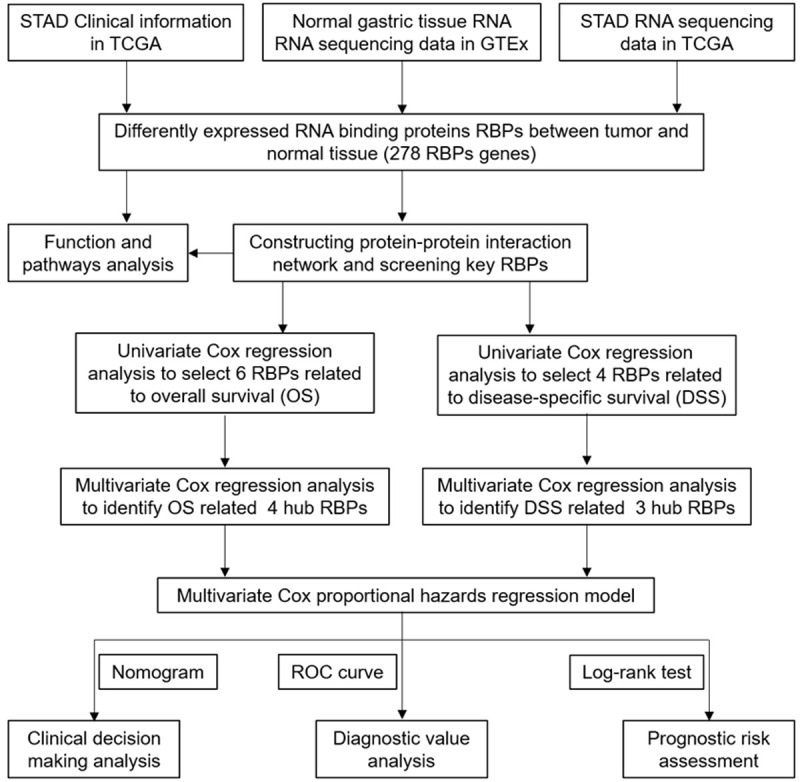
Whole procedures for analyzing RBPs in stomach adenocarcinoma.
Figure 2.
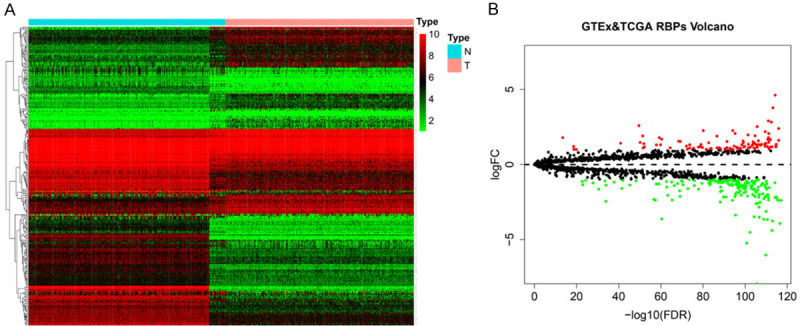
The differentially expressed in stomach adenocarcinoma. A. Heat map. B. Volcano plot.
GO and KEGG functional enrichment analysis
We divided the different expressed RBPs into two groups according to the GO function enrichment analysis for investigate the potential molecular function of them and then upload them to DAVID 6.8 respectively for enrichment analysis. The enrichment results showed that the up-regulated RBPs were Significantly enriched in five biological processes: response to virus, defense response to virus, negative regulation of viral genome replication, RNA splicing and type I interferon signaling pathway (Table 1). Down-regulated RBPs were significantly enriched translational initiation, mRNA processing, mRNA splicing via spliceosome, translation, RNA processing and others (Tables 1 and S3). For molecular function, up-regulated RBPs were enriched in poly(A) RNA binding, RNA binding, 2’-5’-oligoadenylate synthetase activity, double-stranded RNA binding, nucleotide binding (Table 1). The down-regulated RBPs were notably enriched in 6 molecular function such as RNA binding, poly(A) RNA binding, nucleotide binding, structural constituent of ribosome, mRNA binding (Tables 1 and S3). Cellular component analysis showed that Up-regulated RBPs were enriched in cytoplasm, nucleus, nucleoplasm, cytosol, nucleolus (Table 1). The down-regulated genes were significantly enriched in 10 cellular components including nuclear speck, nucleoplasm, ribosome, nucleus, and cytoplasm. analysis showed that Up-regulated RBPs were enriched in cytoplasm, nucleus, nucleoplasm, cytosol, nucleolus (Tables 1 and S3). We conducted pathway enrichment analysis on all identified differentially expressed RBPs. The results demonstrated that the RBPs were enriched in seven pathways: Ribosome, RNA transport, Spliceosome, mRNA surveillance pathway, RNA degradation, Ribosome biogenesis in eukaryotes, Aminoacyl-tRNA biosynthesis, and Influenza (Table 1).
Table 1.
GO and KEGG enrichment analysis result of for differentially expressed RBPs
| Expression | Enrichment term | P Value | FDR |
|---|---|---|---|
| Up-regulated RBPs GO | |||
| Biological processes | response to virus | 5.92E-09 | 8.80E-06 |
| defense response to virus | 2.02E-07 | 3.00E-04 | |
| negative regulation of viral genome replication | 2.01E-06 | 2.98E-03 | |
| RNA splicing | 2.53E-06 | 3.76E-03 | |
| type I interferon signaling pathway | 2.11E-05 | 3.13E-02 | |
| Molecular function | poly(A) RNA binding | 1.88E-23 | 2.37E-20 |
| RNA binding | 4.66E-09 | 5.88E-06 | |
| 2’-5’-oligoadenylate synthetase activity | 6.04E-07 | 7.62E-04 | |
| double-stranded RNA binding | 9.09E-07 | 1.15E-03 | |
| nucleotide binding | 1.78E-05 | 2.25E-02 | |
| Cellular component | cytoplasm | 4.17E-09 | 5.07E-06 |
| nucleus | 4.69E-09 | 5.70E-06 | |
| nucleoplasm | 3.06E-08 | 3.72E-05 | |
| cytosol | 6.98E-08 | 8.49E-05 | |
| nucleolus | 1.37E-07 | 1.67E-04 | |
| Down-regulated RBPs GO | |||
| Biological processes | translational initiation | 6.11E-17 | 1.67E-13 |
| mRNA processing | 6.56E-16 | 9.99E-13 | |
| mRNA splicing, via spliceosome | 4.56E-14 | 6.82E-11 | |
| translation | 5.26E-12 | 7.88E-09 | |
| RNA processing | 5.23E-13 | 7.83E-10 | |
| Molecular function | RNA binding | 9.73E-34 | 1.25E-30 |
| poly(A) RNA binding | 6.65E-32 | 8.54E-29 | |
| nucleotide binding | 5.33E-18 | 6.85E-15 | |
| structural constituent of ribosome | 6.10E-11 | 7.83E-08 | |
| mRNA binding | 3.95E-08 | 5.07E-05 | |
| Cellular component | nuclear speck | 2.56E-12 | 3.17E-09 |
| nucleoplasm | 2.08E-11 | 2.57E-08 | |
| ribosome | 2.47E-10 | 3.06E-07 | |
| nucleus | 1.23E-08 | 1.52E-05 | |
| cytoplasm | 1.86E-07 | 2.30E-04 | |
| Dysregulated RBPS (KEGG) | |||
| Ribosome | 1.20E-17 | 1.51E-15 | |
| RNA transport | 9.46E-10 | 5.96E-08 | |
| Spliceosome | 5.83E-08 | 2.45E-06 | |
| mRNA surveillance pathway | 1.23E-07 | 3.87E-06 | |
| RNA degradation | 3.62E-05 | 9.11E-04 | |
| Ribosome biogenesis in eukaryotes | 1.37E-04 | 2.88E-03 | |
| Aminoacyl-tRNA biosynthesis | 1.66E-04 | 2.99E-03 | |
| Influenza A | 5.53E-04 | 8.70E-03 |
PPI network construction and key modules screening
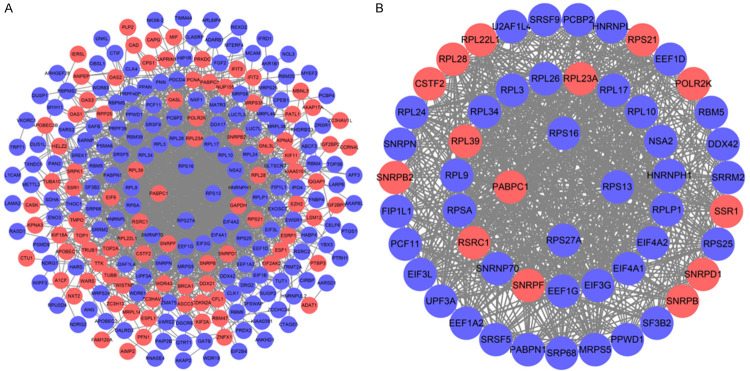
We further study the role of differential expression RBPs in GC by constructing a PPI network. We uploaded 278 RBPs to the String database, set the minimum required interaction score to 0.40, and obtained a PPI network with 197 nodes and 1484 edges (Figure 3A). We used the MODE tool to process PPI networks, identified the key networks and got a network composed of 54 nodes and 721 edges (Figure 3B). GO Enrichment analysis showed that the functions of these 54 genes are mainly enriched in poly(A) RNA binding, structural constituent of ribosome, nucleotide binding, RNA binding. In addition, biological processes are enriched in translation, mRNA splicing through spliceosomes, cytoplasmic translation (Figure 4A). KEGG pathway enrichment analysis indicated that the RBPs pathway in the core module is enriched in Ribosome, Spliceosome, mRNA surveillance pathway, RNA transport, Legionellosis, Systemic lupus erythematosus (Figure 4B).
Figure 3.
Protein-protein interaction network and key modules analysis. A. Protein-protein interaction network of differentially expressed RBPs. B. Key module from PPI network. Blue circles: down-regulation, red circles: up-regulation.
Figure 4.
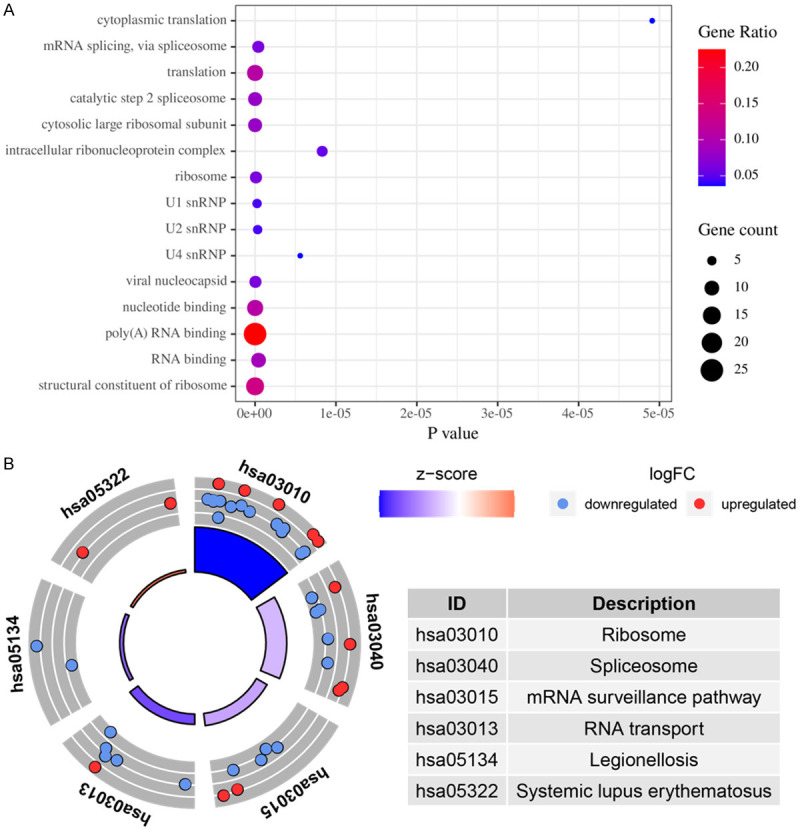
GO and KEGG pathway enrichment analysis of RBPs in key modules of PPI networks. A. GO. B. KEGG.
Identification of RBPs related to prognosis
The core network extracted from the previous step has 54 RBPs. Using univariate Cox regression analysis, we obtained six RBPs related to the overall survival (OS), include: HNRNPL, PABPN1, PCF11, SF3B2, SNRPN, and UPF3A (Table 2), Thereinto, HNRNPL, PABPN1, PCF, SNRPN have the greatest potential prognostic ability (Table 2). The univariate Cox regression analysis of the RBPs related to DSS revealed that EEF1A2, HNRNPL, MRPS5, PCF11 were correlated with DSS (Table 3), and EEF1A2, MRPS5, PCF11 were independent prognostic factors (Table 3).
Table 2.
Univariate Cox regression analysis and multivariate Cox regression analysis to identify OS-related hub RBPs
| Gene ID | Univariate Cox regression analysis | Multivariate Cox regression analysis | |||||
|---|---|---|---|---|---|---|---|
|
|
|
||||||
| HR | 95% CI | P-value | coef | HR | 95% CI | P-value | |
| HNRNPL | 0.0279 | 0.0019-0.4029 | 0.0086 | -2.4730 | 0.0843 | 0.0054-1.3234 | 0.0783 |
| PABPN1 | 0.2576 | 0.0766-0.8665 | 0.0284 | -1.0384 | 0.354 | 0.1070-1.1714 | 0.0890 |
| PCF11 | 0.1726 | 0.0476-0.6253 | 0.0075 | -1.6101 | 0.1999 | 0.0552-0.7237 | 0.0142 |
| SNRPN | 1.5384 | 1.0082-2.3475 | 0.0457 | 0.3265 | 1.3862 | 0.8835-2.1747 | 0.1553 |
| SF3B2 | 0.0719 | 0.0068-0.7620 | 0.0288 | - | - | - | - |
| UPF3A | 0.3779 | 0.1476-0.9673 | 0.0424 | - | - | - | - |
Table 3.
Univariate Cox regression analysis and multivariate Cox regression analysis to identify DSS-related hub RBPs
| Gene ID | Univariate Cox regression analysis | Multivariate Cox regression analysis | |||||
|---|---|---|---|---|---|---|---|
|
|
|
||||||
| HR | 95% CI | P-value | coef | HR | 95% CI | P-value | |
| EEF1A2 | 1.3276 | 1.0698-1.6474 | 0.0100 | 0.1942 | 1.2143 | 0.9682-1.5230 | 0.0928 |
| MRPS5 | 0.1879 | 0.0427-0.8275 | 0.0271 | -2.4877 | 0.0831 | 0.0157-0.4399 | 0.0034 |
| PCF11 | 0.1163 | 0.0227-0.596 | 0.0099 | -2.6142 | 0.0732 | 0.0128-0.4192 | 0.0033 |
| HNRNPL | 0.0270 | 0.0009-0.8094 | 0.0374 | - | - | - | - |
Prognosis model construction and analysis
On account of multivariate Cox regression analysis, four OS-related RBPs were used to construct a prognostic model to predict the OS of GC patients. The risk score of each GC patient is calculated based on the following formula: Risk score = (-2.4730 * ExpHNRNPL) + (-1.0385 * ExpPABPN1) + (-1.6102 * ExpPCF11) + (0.3265 * ExpSNRPN).
In view of the risk scores, we divided 370 STAD patients into a high-risk group and a low-risk group and evaluated the predictive ability of the model through the survival analysis. These results verified that the overall survival rate of the high-risk group was lower than that of the low-risk group (Figure 5A). We further conducted ROC analysis to evaluate the prognostic performance of the OS-related prognostic models constructed by the four RBPs and analyzed the ROC curve of the five-year survival rate. The results showed that the 5-year area under the ROC curve (RUC) of the OS-related model was 0.62, proved that it had a certain predictive ability (Figure 5B). We also plotted the overall survival status, and risk scores of the four hub RBPs expression in the low-risk and high-risk groups, as shown in Figure 5C.
Figure 5.
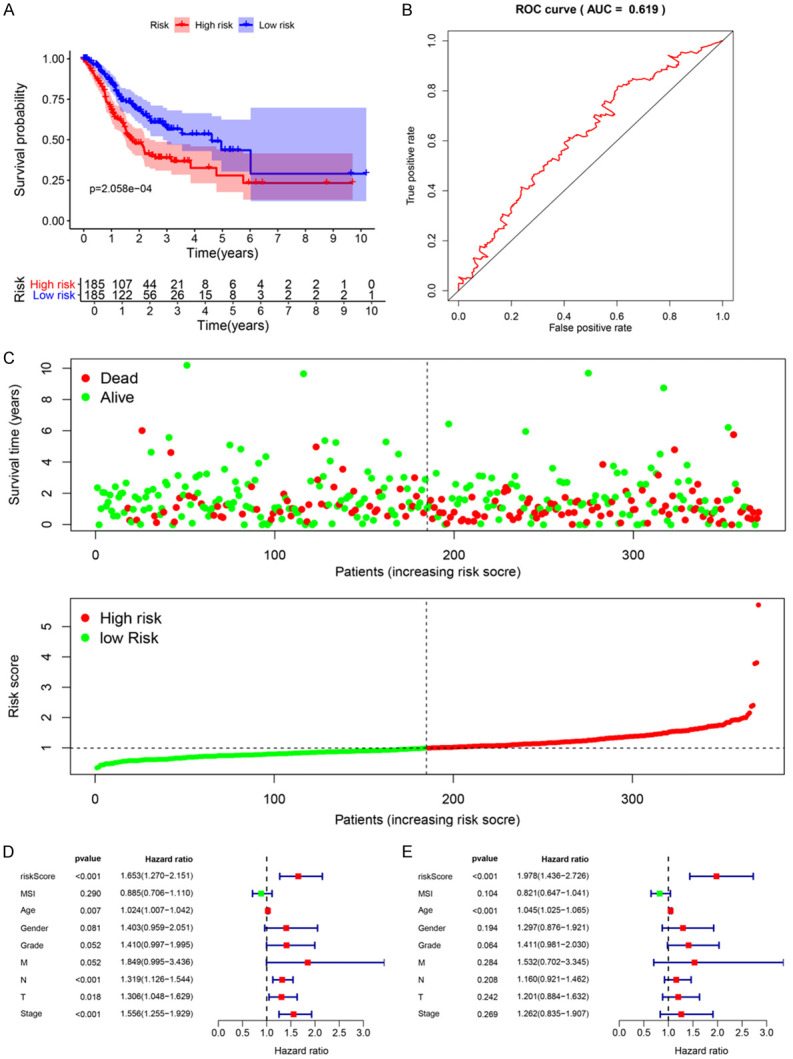
Risk score analysis of overall survival related prognostic models and the clinicopathological prognostic value of OS-related prognostic model in STAD. A. Survival curve for low-risk and high-risk subgroups. B. ROC curve for predicting OS based on risk score. C. Expression heat map, risk score distribution, and survival status. D. Univariate Cox regression analysis. E. Multivariate Cox regression analysis.
Besides, we draw a DSS prediction model. The risk scoring formula for each patient is as follows: Risk score = (0.1942 * ExpEEF1A2) + (-2.4877 * ExpMRPS5) + (-2.6142 * ExpPCF11).
We divided the patients into the high-risk and low risk groups through the risk score and conducted a survival analysis. The analysis illustrated that the DSS of the high-risk group is significantly lower than that of the low-risk group (Figure 6A). By plotting a 5-year ROC curve, the AUC is 0.64, which can predict the DSS of patient (Figure 6B). The disease-specific survival status, and the risk scores of three hub RBPs in the signature were displayed in Figure 6C. We stated the significance of multiple clinical features and overall prognosis in TCGA-STAD by univariate Cox regression analysis. The analysis explained that risk score, age, stage N, stage T, and tumor stage were considered as clinicopathological features related to OS in STAD. Further multivariate Cox regression analysis emphasized that risk score and age were independent prognostic factors related to OS (Figure 5D and 5E). For DSS, based on the results of univariate Cox regression analysis, risk score, gender, stage N and tumor stage are related to DSS. Through multivariate Cox regression analysis, only risk score is an independent prognostic factor for DSS in patients with GC (Figure 6D and 6E).
Figure 6.
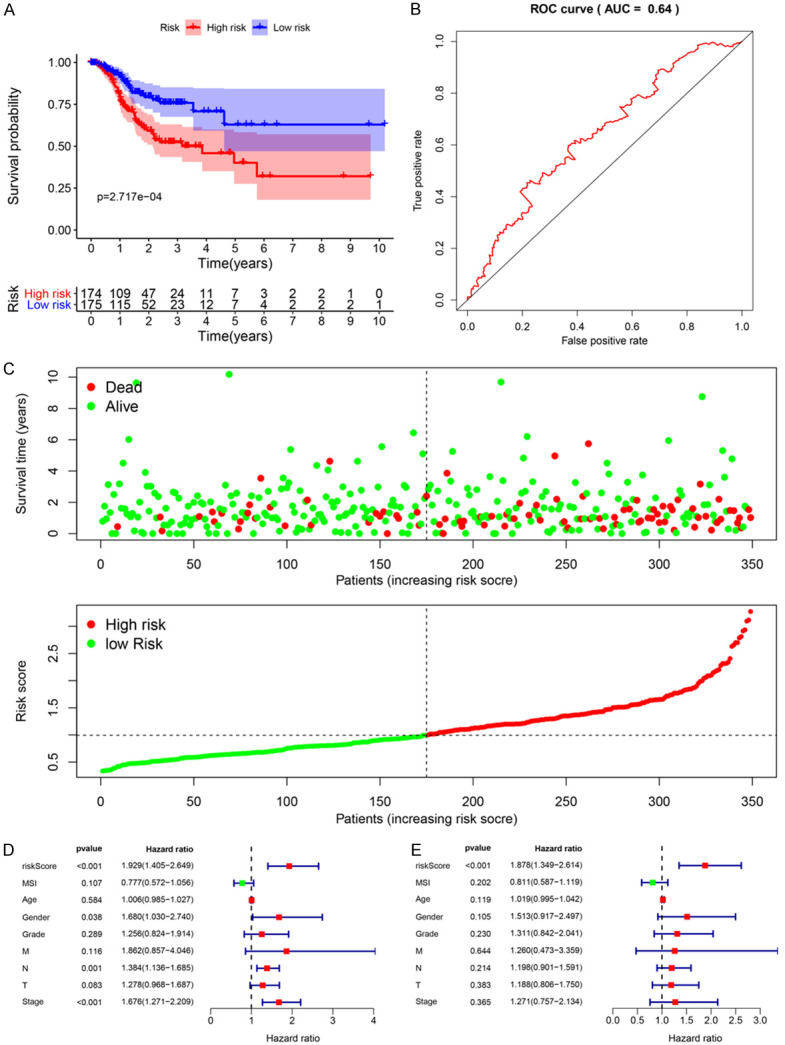
Risk score analysis of disease-specific survival related prognostic models and the clinicopathological prognostic value of DSS-related prognostic model in STAD. A. Survival curve for low-risk and high-risk subgroups. B. ROC curve for predicting DSS based on risk score. C. Expression heat map, risk score distribution, and survival status. D. Univariate Cox regression analysis. E. Multivariate Cox regression analysis.
Construction of nomogram according to hub RBPs
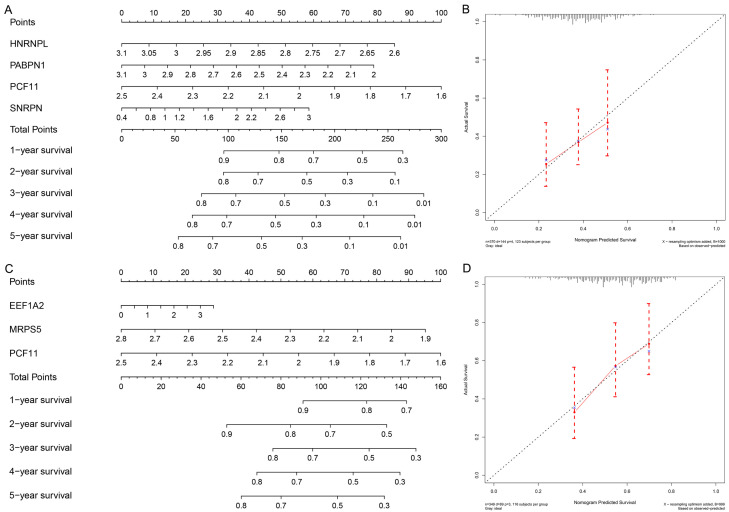
In order to make the risk scoring model predict the prognosis more accurately, we constructed four RBP signatures related to OS (Figure 7A) and three RBP signatures related to DSS (Figure 7C) based on multivariate Cox regression analysis Nomogram. Then we allocated the points in the nomogram to the RBPs in proportion to each point, and draw a horizontal line that determines each RBP point and normalized to a distribution of 0 to 100. We calculated the total points of each patient by adding the points of each RBPs in the model and plotted the total point axis, which supported for us to calculate the OS and DSS of STAD patients from one to five years by drawing a vertical line between the total point axis and each prognostic axis. These studies may improve the accuracy of clinicians making clinical decisions for STAD patients. We divided the samples that constitute the OS and DSS-related nomograms into three equal parts, and drawn a 5-year calibration curve to judge the prognosis of the nomogram. The results suggest that whether it is OS nomogram or DSS nomogram (Figure 7B and 7D), the predicted survival rate is almost the same as the actual survival rate, showing its good predictive ability.
Figure 7.
Nomogram for predicting 1-5 year OS and DSS of STAD patients and validation. A. OS Nomogram. B. Calibration curves for the OS nomogram. C. DSS Nomogram. D. Calibration curves for the OS nomogram.
Validation the expression of hub RBPs
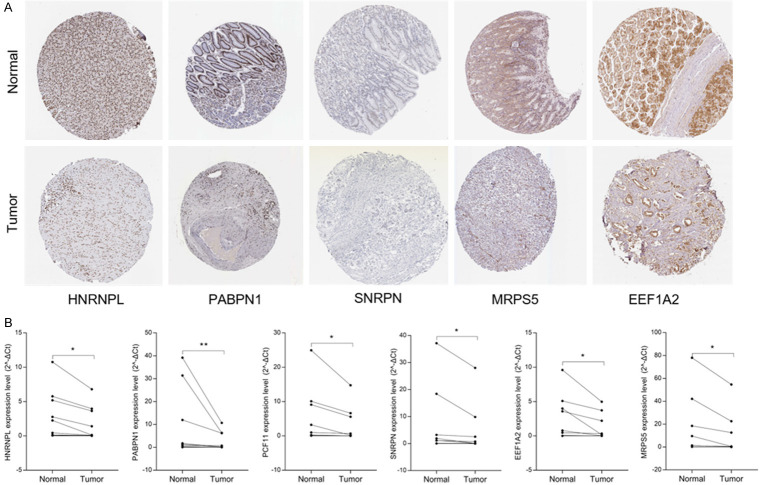
The joint analysis of GTEx and TCGA 391 paracancerous and 375 cancer tissue data indicated that the expression of EEF1A2, HNRNPL, MRPS5, PABPN1, PCF11, SNRPN in tumor tissue was lower than that in paracancerous tissue (Figure S1). Using Kaplan-Meier to analyze the RBPs related to OS and DSS respectively, HNRNPL, PABPN1, PCF11 are the indicators to predict OS, and EEF1A2, MRPS5, PCF11 are the indicators to predict DSS (Figure S1). In order to further verify the protein expression of the seven hub RBPs related to OS and DSS in STAD, we used HPA immunohistochemistry data. Compared with normal gastric tissues, the expression of EEF1A2, HNRNPL, MRPS5, PABPN1, and SNRPN in gastric cancer was relatively reduced (Figure 8A). By qRT-PCR analysis of the expression level of RNA in clinical surgical samples of gastric cancer patients, we found that the expression levels of HNRNPL, PABPN1, PCF11, SNRPN, EEF1A2, MRPS5 in gastric cancer were significantly lower than those in adjacent tissues (Figure 8B), the result is in line with our bioinformatics analysis results.
Figure 8.
Verification of hub RBPs expression. A. HPA database. B. qRT-PCR.
Discussion
Compared with global tumor data, Chinese digestive system tumors still account for a large proportion. The incidence of GC is gradually increasing, and currently ranks second after lung cancer [2]. The main feature of malignant tumors is uncontrolled cell growth, which is due to abnormal expression of oncogenes that regulate cell proliferation and differentiation. Multiple studies in recent years have confirmed that RBPs expression is dysregulated in GC [13,14]. However, only a small part of the research on the regulatory mechanism of RBPs in GC which makes the expression pattern and role of RBPs in STAD poorly understood. In this study, we integrated RNA-seq data of GTEx and TCGA gastric and GC tissues, and identified 278 dysregulated RBPs. Through systematic analysis of related molecular functions and biological pathways, the PPI network of these RBPs were constructed. Moreover, we used univariate and multivariate Cox regression analysis to determine hub RBPs, and separately constructed OS-related risk prediction signatures composed of four hub RBPs, and based on three hub RBPs to predict the risk model of DSS in STAD patients. These findings can help clinical practitioners develop novel biomarkers to more accurately predict and diagnose STAD patients.
The biological functions and molecular biological mechanism of 278 dysregulated RBPs were obtained by GO and KEGG function enrichment analysis. Firstly, for biological process, differentially expressed RBPs are mainly enriched in translation, RNA processing, splicing, decomposition, and response to viruses. The occurrence and development of GC involve multiple genes and multiple pathways in harmony. The regulation of RNA metabolism, RNA processing, and translation has been shown to participate in the occurrence and progression of various human diseases and play an important role [32-34]. The regulation of RNA stability post-transcription is considered to be an important process in gene expression. RBPs are proteins that enhance the stability of target mRNA and promote gene expression. This ability is mainly achieved by interacting with RNA to form a ribosomal protein complex. This function of RBPs plays an important role in the progression of various diseases. The stability of NF90 protein is enhanced by directly binding to TMEM98 mRNA and promotes GC progression [15]. DDX6 protein acts as an RNA binding protein for FGFR2 mRNA, and actively regulates the expression of HER2 and FGFR2 in GC cells in the post-transcription step [17]. HNRNPR promote the proliferation and metastasis of GC by stabilizing the expression of CCNB1 and CENPF mRNA [35]. The potential link between Epstein-Barr virus (EBV) and GC has passed for thirty years. GC associated with EBV is a specific subtype of GC [36]. Multiple reports indicated that RBPs regulates EBV mRNA transcription [37,38]. But the relationship between RBPs, EBV and GC is not clear. In terms of molecular function, RBPs can combine with RNA and nucleotides including poly(A) RNA, mRNA, double-stranded RNA to perform its function. In addition, it has structural constituent of ribosome and 2’-5’-oligoadenylate synthetase activity. The ribosome is a key organelle for protein synthesis. Mutations in ribosomal proteins regulate p53 translation and activity, ultimately leading to disease and cancer [39]. The 2’-5’oligoadenylate synthase is closely related to the viral response, which may be related to EBV-related GC. KEGG pathway analysis showed that they are mainly enriched in Ribosome, RNA transport, spliceosome, RNA degradation, mRNA surveillance pathway, ribosome biogenesis in eukaryotes, aminoacyl-tRNA biosynthesis and other pathways to affect the development of GC.
We constructed a PPI network of 278 dysregulated RBPs and obtained a key module containing 54 hub RBPs. Despite the connection between these differentially expressed RBP and GC is uncertain, it is reported that some RBPs are related to other malignant tumors. For example, KIF11 can enhance the characteristics of breast cancer stem cells by activating the Wnt/β-catenin signaling pathway to facilitate the self-renewal of breast cancer cells [44]. KPNA2 accelerates metabolic reprogramming of glioblastoma by regulating c-myc signaling axis [45] and promote the proliferation and tumorigenicity of epithelial ovarian cancer through the c-Myc pathway and FOXO3a [46]. EZH2 silently recruits the non-coding RNA PHACTR2-AS1 of histone methyltransferase SUV39H1, resulting in excessive activation of ribosomal synthesis and instability of ribosomal DNA, thereby promoting the proliferation and metastasis of cancer cells [47]. The hub RBP in key models also plays an essential role in tumors. RPL22L1 and RPS21 have been identified as candidate biomarkers for diagnosis and prognosis of prostate cancer [40]. Colorectal cancer was confirmed that RPL22L1 is associated with poor prognosis and induces 5-FU resistance [41]. In ovarian cancer, RPL22L1 can trigger epithelial-mesenchymal transition and promote tumor metastasis [42]. Studies in non-small cell carcinoma have shown that the core component of spliceosome SNRPB can formally regulate RAB26 alternative splicing and mRNA expression through the pathway by promoting tumor progression [43]. PPI network key module analysis showed that STAD is related to intracellular ribonucleoprotein complex, poly(A) RNA binding, RNA binding, structural constituent of ribosome, nucleotide binding, translation, MRNA splicing through spliceosomes, cytoplasmic translation.
We determined the center point RBP based on the results of univariate Cox regression analysis combined with the results of multivariate Cox regression analysis. Four OS-related hub RBPs (HNRNPL, PABPN1, PCF11, and SNRPN) and three DSS-related (ESS1A2, MRPS5, and PCF11) were identified. Although these hub RBPs have not been reported in GC, studies have shown that they are associated with other tumors. PABPN1 is an inhibitor of Alternative Polyadenylation, and its down-regulation in lung cancer promotes tumor invasion by releasing cancer cells from microRNA-mediated gene regulation [48]. SNRPN is a key component of the spliceosome and considered to be a crucial factor for tumor growth in pancreatic cancer cells, promoting tumor proliferation [49]. Translation elongation factor EEF1A2 inhibits the activity of RNA-dependent protein kinase PKR and promotes tumor cell survival [50]. These evidences are consistent with the results of our analysis. ROC curve analysis showed that the two risk models have moderate diagnostic ability and can predict the prognosis of STAD patients. Furthermore, we established nomograms to predict OS and DSS separately to help clinicians more intuitively predict operating systems from one to five years the 5-year calibration curve shows a good predictive power of these two nomograms. Through the qRT-PCR and HPA database, we verified the expression of RNA and protein levels of these six genes, which is consistent with the results of our GTEx and TCGA analysis, suggesting that the OS and DSS prognostic models we constructed have potential value in adjusting the treatment plan of GC patients.
Overall, we have constructed a prediction model based on four genes for OS and a prediction model based on three genes for DSS, which has favourable prediction performance, which helps to develop new STAD prognostic indicators. The gene signatures associated with RBPs revealed vital biological functions, which indicated that they can potentially be used for clinical adjuvant therapy. However, our research has some deficiencies. First of all, the GC RNA-seq data of our prediction model only comes from the TCGA database and has not been verified in other databases and clinical cohorts. Secondly, the lack of certain clinical information in the TCGA dataset may lead to the reliability of multivariate Cox regression analysis. Finally, this study is based on retrospective analysis, and prospective studies should be conducted to further verify the results.
Acknowledgements
National Natural Science Foundation of China, Grant/Award Numbers: 81760549, 81872480; Science and Technology Research Project of Education Department of Jiangxi Province, Grant/Award Number: GJJ180024; Nanchang University Graduate Innovation Fund, Grant/Award Number: CX2018196.
Disclosure of conflict of interest
None.
Supporting Information
References
- 1.Bray F, Ferlay J, Soerjomataram I, Siegel RL, Torre LA, Jemal A. Global cancer statistics 2018: GLOBOCAN estimates of incidence and mortality worldwide for 36 cancers in 185 countries. CA Cancer J Clin. 2018;68:394–424. doi: 10.3322/caac.21492. [DOI] [PubMed] [Google Scholar]
- 2.Chen W, Zhang R, Zhang S, Zhao P, Zeng H, Zou X. Report of cancer incidence and mortality in China, 2010. Ann Transl Med. 2014;2:61. doi: 10.3978/j.issn.2305-5839.2014.04.05. [DOI] [PMC free article] [PubMed] [Google Scholar]
- 3.Van CE, Sagaert X, Topal B, Haustermans K, Prenen H. Gastric cancer. Lancet. 2016;388:2654–2664. doi: 10.1016/S0140-6736(16)30354-3. [DOI] [PubMed] [Google Scholar]
- 4.Sun P, Xiang JB, Chen ZY. Meta-analysis of adjuvant chemotherapy after radical surgery for advanced gastric cancer. Br J Surg. 2009;96:26–33. doi: 10.1002/bjs.6408. [DOI] [PubMed] [Google Scholar]
- 5.Wang ZL, Li B, Luo YX, Lin Q, Liu SR, Zhang XQ, Zhou H, Yang JH, Qu LH. Comprehensive genomic characterization of RNA-binding proteins across human cancers. Cell Rep. 2018;22:286–298. doi: 10.1016/j.celrep.2017.12.035. [DOI] [PubMed] [Google Scholar]
- 6.Gerstberger S, Hafner M, Tuschl T. A census of human RNA-binding proteins. Nat Rev Genet. 2014;15:829–845. doi: 10.1038/nrg3813. [DOI] [PMC free article] [PubMed] [Google Scholar]
- 7.Lukong KE, Chang KW, Khandjian EW, Richards S. RNA-binding proteins in human genetic disease. Trends Genetics. 2008;24:416–425. doi: 10.1016/j.tig.2008.05.004. [DOI] [PubMed] [Google Scholar]
- 8.Neelamraju Y, Hashemikhabir S, Janga SC. The human RBPome: from genes and proteins to human disease. J Proteomics. 2015;127:61–70. doi: 10.1016/j.jprot.2015.04.031. [DOI] [PubMed] [Google Scholar]
- 9.Darnell RB. RNA regulation in neurologic disease and cancer. Cancer Res Treat. 2010;42:125–129. doi: 10.4143/crt.2010.42.3.125. [DOI] [PMC free article] [PubMed] [Google Scholar]
- 10.Jang HH, Lee HN, Kim SY, Hong S, Lee WS. Expression of RNA-binding Motif Protein 3 (RBM3) and Cold-inducible RNA-binding protein (CIRP) is associated with improved clinical outcome in patients with colon cancer. Anticancer Res. 2017;37:1779–1785. doi: 10.21873/anticanres.11511. [DOI] [PubMed] [Google Scholar]
- 11.Busà R, Paronetto MP, Farini D, Pierantozzi E, Botti F, Angelini DF, Attisani F, Vespasiani G, Sette C. The RNA-binding protein Sam68 contributes to proliferation and survival of human prostate cancer cells. Oncogene. 2007;26:4372–4382. doi: 10.1038/sj.onc.1210224. [DOI] [PubMed] [Google Scholar]
- 12.Pareira B, Billaud M, Almeida R. RNA-Binding proteins in cancer: old players and new actors. Trends Cancer. 2017;3:506–528. doi: 10.1016/j.trecan.2017.05.003. [DOI] [PubMed] [Google Scholar]
- 13.Cheng Y, Jin Z, Agarwal R, Ma K, Yang J, Ibrahim S, Olaru AV, David S, Ashktorab H, Smoot DT, Duncan MD, Hutcheon DF, Abraham JM, Meltzer SJ, Mori Y. LARP7 is a potential tumor suppressor gene in gastric cancer. Lab Invest. 2012;92:1013–1019. doi: 10.1038/labinvest.2012.59. [DOI] [PMC free article] [PubMed] [Google Scholar]
- 14.Bian Y, Wang L, Lu H, Yang G, Zhang Z, Fu H, Lu X, Wei M, Sun J, Zhao Q, Dong G, Lu Z. Downregulation of tumor suppressor QKI in gastric cancer and its implication in cancer prognosis. Biochem Biophys Res Commun. 2012;422:187–193. doi: 10.1016/j.bbrc.2012.04.138. [DOI] [PubMed] [Google Scholar]
- 15.Ao X, Li X, Chen Y, Zang Z, Guo W, Liang J. The TMEM98 mRNA promotes proliferation and invasion of gastric cells by directly interacting with the NF90 protein. Cell Biol Int. 2020;44:1820–1830. doi: 10.1002/cbin.11375. [DOI] [PubMed] [Google Scholar]
- 16.Liang X, Chen W, Shi H, Gu X, Li Y, Qi Y, Xu K, Zhao A, Liu J. PTBP3 contributes to the metastasis of gastric cancer by mediating CAV1 alternative splicing. Cell Death Dis. 2018;9:569. doi: 10.1038/s41419-018-0608-8. [DOI] [PMC free article] [PubMed] [Google Scholar]
- 17.Tajirika T, Tokumaru Y, Taniguchi K, Sugito N, Matsuhashi N, Futamura M, Yanagigara K, Akao Y, Yoshida K. Dead-box protein RNA-helicase DDX6 regulates the expression of HER2 and FGFR2 at the post-transcriptional step in gastric cancer cells. Int J Mol Sci. 2018;19:2005. doi: 10.3390/ijms19072005. [DOI] [PMC free article] [PubMed] [Google Scholar]
- 18.Weinstein JN, Collisson EA, Mills GB, Shaw KR, Ozenberger BA, Ellrott K, Shmulevich I, Sander C, Stuart JM. The cancer genome atlas pan-cancer analysis project. Nat Genet. 2013;45:1113–1120. doi: 10.1038/ng.2764. [DOI] [PMC free article] [PubMed] [Google Scholar]
- 19.Wang Q, Armenia J, Zhang C, Penson AV, Reznik E, Zhang L, Minet T, Ochoa A, Gross BE, Iacobuzio-Donahue CA, Betel D, Taylor BS, Gao J, Schultz N. Unifying cancer and normal RNA sequencing data from different sources. Sci Data. 2018;5:180061. doi: 10.1038/sdata.2018.61. [DOI] [PMC free article] [PubMed] [Google Scholar]
- 20.GTEx Consortium. Human genomics. The Genotype-Tissue Expression (GTEx) pilot analysis: multitissue gene regulation in humans. Science. 2015;348:648–660. doi: 10.1126/science.1262110. [DOI] [PMC free article] [PubMed] [Google Scholar]
- 21.Li K, Guo ZW, Zhai XM, Yang XX, Wu YS, Liu TC. RBPTD: a database of cancer-related RNA-binding proteins in humans. Database. 2020;2020:baz156. doi: 10.1093/database/baz156. [DOI] [PMC free article] [PubMed] [Google Scholar]
- 22.Li B, Ruotti V, Stewart RM, Thomson JA, Dewey CN. RNA-seq gene expression estimation with read mapping uncertainty. Bioinformatics. 2009;26:493–500. doi: 10.1093/bioinformatics/btp692. [DOI] [PMC free article] [PubMed] [Google Scholar]
- 23.Leek JT, Johnson WE, Parker HS, Jaffe AE, Storey JD. The sva package for removing batch effects and other unwanted variation in high-throughput experiments. Bioinformatics. 2012;28:882–883. doi: 10.1093/bioinformatics/bts034. [DOI] [PMC free article] [PubMed] [Google Scholar]
- 24.Ritchie ME, Phipson B, Wu D, Hu Y, Law CW, Shi W, Smyth GK. limma powers differential expression analyses for RNA-sequencing and microarray studies. Nucleic Acids Res. 2015;43:e47. doi: 10.1093/nar/gkv007. [DOI] [PMC free article] [PubMed] [Google Scholar]
- 25.Huang DW, Sherman BT, Tan Q, Collins JR, Alvord WG, Roayaei J, Stephens R, Baseler MW, Lane HC, Lempicki RA. The DAVID gene functional classification tool: a novel biological module-centric algorithm to functionally analyze large gene lists. Genome Biol. 2007;8:R183. doi: 10.1186/gb-2007-8-9-r183. [DOI] [PMC free article] [PubMed] [Google Scholar]
- 26.Wslter W, Sánchez-Cabo F, Ricote M. GOplot: an R package for visually combining expression data with functional analysis. Bioinformatics. 2015;31:2912–2914. doi: 10.1093/bioinformatics/btv300. [DOI] [PubMed] [Google Scholar]
- 27.Szklarczyk D, Franceschini A, Kuhn M, Simonovic M, Roth A, Minguez P, Doerks T, Stark M, Muller J, Bork P, Jensen LJ, von Mering C. The STRING database in 2011: functional interaction networks of proteins, globally integrated and scored. Nucleic Acids Res. 2011;39:D561–568. doi: 10.1093/nar/gkq973. [DOI] [PMC free article] [PubMed] [Google Scholar]
- 28.Shannon P, Markiel A, Ozier O, Baliga NS, Wang JT, Ramage D, Amin N, Schwikowski B, Ideker T. Cytoscape: a software environment for integrated models of biomolecular interaction networks. Genome Res. 2003;13:2498–2504. doi: 10.1101/gr.1239303. [DOI] [PMC free article] [PubMed] [Google Scholar]
- 29.Bader GD, Hogue CW. An automated method for finding molecular complexes in large protein interaction networks. BMC Bioinformatics. 2003;4:2. doi: 10.1186/1471-2105-4-2. [DOI] [PMC free article] [PubMed] [Google Scholar]
- 30.Heagerty PJ, Zheng Y. Survival model predictive accuracy and ROC curves. Biometrics. 2005;61:92–105. doi: 10.1111/j.0006-341X.2005.030814.x. [DOI] [PubMed] [Google Scholar]
- 31.Luck K, Kim DK, Lambourne L, Spirohn K, Begg BE, Bian W, Brignall R, Cafarelli T, Campos-Laborie FJ, Charloteaux B, Choi D, Coté AG, Daley M, Deimling S, Desbuleux A, Dricot A, Gebbia M, Hardy MF, Kishore N, Knapp JJ, Kovács IA, Lemmens I, Mee MW, Mellor JC, Pollis C, Pons C, Richardson AD, Schlabach S, Teeking B, Yadav A, Babor M, Balcha D, Basha O, Bowman-Colin C, Chin SF, Choi SG, Colabella C, Coppin G, D’Amata C, De Ridder D, De Rouck S, Duran-Frigola M, Ennajdaoui H, Goebels F, Goehring L, Gopal A, Haddad G, Hatchi E, Helmy M, Jacob Y, Kassa Y, Landini S, Li R, van Lieshout N, MacWilliams A, Markey D, Paulson JN, Rangarajan S, Rasla J, Rayhan A, Rolland T, San-Miguel A, Shen Y, Sheykhkarimli D, Sheynkman GM, Simonovsky E, Taşan M, Tejeda A, Tropepe V, Twizere JC, Wang Y, Weatheritt RJ, Weile J, Xia Y, Yang X, Yeger-Lotem E, Zhong Q, Aloy P, Bader GD, De Las Rivas J, Gaudet S, Hao T, Rak J, Tavernier J, Hill DE, Vidal M, Roth FP, Calderwood MA. A reference map of the human binary protein interactome. Nature. 2020;580:402–408. doi: 10.1038/s41586-020-2188-x. [DOI] [PMC free article] [PubMed] [Google Scholar]
- 32.Kim TH, Tsang B, Vernon RM, Sonenberg N, Kay LE, Forman-Kay JD. Phospho-dependent phase separation of FMRP and CAPRIN1 recapitulates regulation of translation and deadenylation. Science. 2019;365:825–829. doi: 10.1126/science.aax4240. [DOI] [PubMed] [Google Scholar]
- 33.Siang DTC, Lim YC, Kyaw AMM, Win KN, Chia SY, Degirmenci U, Hu X, Tan BC, Walet ACE, Sun L, Xu D. The RNA-binding protein HuR is a negative regulator in adipogenesis. Nat Commun. 2020;11:213. doi: 10.1038/s41467-019-14001-8. [DOI] [PMC free article] [PubMed] [Google Scholar]
- 34.Jain A, Brown SZ, Thomsett HL, Londin E, Brody JR. Evaluation of post-transcriptional gene regulation in pancreatic cancer cells: studying RNA binding proteins and their mRNA targets. Methods Mol Biol. 2019;1882:239–252. doi: 10.1007/978-1-4939-8879-2_22. [DOI] [PubMed] [Google Scholar]
- 35.Chen EB, Qin X, Peng K, Li Q, Tang C, Wei YC, Yu S, Gan L, Liu TS. HnRNPR-CCNB1/CENPF axis contributes to gastric cancer proliferation and metastasis. Aging (Albany NY) 2019;11:7473–7491. doi: 10.18632/aging.102254. [DOI] [PMC free article] [PubMed] [Google Scholar]
- 36.Fukayama M, Abe H, Kunita A, Shinozaki-Ushiku A, Matsusaka K, Ushiku T, Kaneda A. Thirty years of Epstein-Barr virus-associated gastric carcinoma. Virchows Arch. 2020;476:353–365. doi: 10.1007/s00428-019-02724-4. [DOI] [PubMed] [Google Scholar]
- 37.Lee N, Yario TA, Gao JS, Steitz JA. EBV noncoding RNA EBER2 interacts with host RNA-binding proteins to regulate viral gene expression. Proc Natl Acad Sci U S A. 2016;113:3221–3226. doi: 10.1073/pnas.1601773113. [DOI] [PMC free article] [PubMed] [Google Scholar]
- 38.Mure F, Panthu B, Zanella-Cléon I, Delolme F, Manet E, Ohlmann T, Gruffat H. Epstein-Barr Virus protein EB2 stimulates translation initiation of mRNAs through direct interactions with both poly(a)-binding protein and eukaryotic initiation factor 4g. J Virol. 2018;92:e01917-17. doi: 10.1128/JVI.01917-17. [DOI] [PMC free article] [PubMed] [Google Scholar]
- 39.Goudarzi KM, Lindström MS. Role of ribosomal protein mutations in tumor development. Int J Oncol. 2016;48:1313–1324. doi: 10.3892/ijo.2016.3387. [DOI] [PMC free article] [PubMed] [Google Scholar]
- 40.Liang Z, Mou Q, Pan Z, Zhang Q, Gao G, Cao Y, Gao Z, Pan Z, Feng W. Identification of candidate diagnostic and prognostic biomarkers for human prostate cancer: RPL22L1 and RPS21. Med Oncol. 2019;36:56. doi: 10.1007/s12032-019-1283-z. [DOI] [PubMed] [Google Scholar]
- 41.Pei YY, Li GC, Ran J, Wan XH, Wei FX, Wang L. Kinesin family member 11 enhances the self-renewal ability of breast cancer cells by participating in the Wnt/β-catenin pathway. J Breast Cancer. 2019;22:522–532. doi: 10.4048/jbc.2019.22.e51. [DOI] [PMC free article] [PubMed] [Google Scholar]
- 42.Li J, Liu Q, Liu Z, Xia Q, Zhang Z, Zhang R, Gao T, Gu G, Wang Y, Wang D, Chen X, Yang Y, He D, Xin T. KPNA2 promotes metabolic reprogramming in glioblastomas by regulation of c-myc. J Exp Clin Cancer Res. 2018;37:194. doi: 10.1186/s13046-018-0861-9. [DOI] [PMC free article] [PubMed] [Google Scholar]
- 43.Huang L, Wang HY, Li JD, Wang JH, Zhou Y, Luo RZ, Yun JP, Zhang Y, Jia WH, Zheng M. KPNA2 promotes cell proliferation and tumorigenicity in epithelial ovarian carcinoma through upregulation of c-Myc and downregulation of FOXO3a. Cell Death Dis. 2013;4:e745. doi: 10.1038/cddis.2013.256. [DOI] [PMC free article] [PubMed] [Google Scholar]
- 44.Chu W, Zhang X, Qi L, Fu Y, Wang P, Zhao W, Du J, Zhang J, Zhan J, Wang Y, Zhu WG, Yu Y, Zhang H. The EZH2-PHACTR2-AS1-ribosome axis induces genomic instability and promotes growth and metastasis in breast cancer. Cancer Res. 2020;80:2737–2750. doi: 10.1158/0008-5472.CAN-19-3326. [DOI] [PubMed] [Google Scholar]
- 45.Rao S, Peri S, Hoffmann J, Cai KQ, Harris B, Rhodes M, Connolly DC, Testa JR, Wiest DL. RPL22L1 induction in colorectal cancer is associated with poor prognosis and 5-FU resistance. PLoS One. 2019;14:e0222392. doi: 10.1371/journal.pone.0222392. [DOI] [PMC free article] [PubMed] [Google Scholar]
- 46.Rao S, Peri S, Hoffmann J, Cai KQ, Harris B, Rhodes M, Connolly DC, Testa JR, Wiest DL. Ribosomal L22-like1 (RPL22L1) promotes ovarian cancer metastasis by inducing epithelial-to-mesenchymal transition. PLoS One. 2015;10:e0143659. doi: 10.1371/journal.pone.0143659. [DOI] [PMC free article] [PubMed] [Google Scholar]
- 47.Liu N, Wu Z, Chen A, Wang Y, Cai D, Zheng J, Liu Y, Zhang L. SNRPB promotes the tumorigenic potential of NSCLC in part by regulating RAB26. Cell Death Dis. 2019;10:667. doi: 10.1038/s41419-019-1929-y. [DOI] [PMC free article] [PubMed] [Google Scholar]
- 48.Ichinose J, Watanabe K, Sano A, Nagase T, Nakajima J, Fukayama M, Yatomi Y, Ohishi N, Takai D. Alternative polyadenylation is associated with lower expression of PABPN1 and poor prognosis in non-small cell lung cancer. Cancer Sci. 2014;105:1135–1141. doi: 10.1111/cas.12472. [DOI] [PMC free article] [PubMed] [Google Scholar]
- 49.Ma J, Zhang Z, Wang J. Small nuclear ribonucleoprotein associated polypeptide N accelerates cell proliferation in pancreatic adenocarcinoma. Mol Med Rep. 2015;12:6060–6064. doi: 10.3892/mmr.2015.4208. [DOI] [PubMed] [Google Scholar]
- 50.Losada A, Muñoz-Alonso MJ, Martínez-Díez M, Gago F, Domínguez JM, Martínez-Leal JF, Galmarini CM. Binding of eEF1A2 to the RNA-dependent protein kinase PKR modulates its activity and promotes tumour cell survival. Br J Cancer. 2018;119:1410–1420. doi: 10.1038/s41416-018-0336-y. [DOI] [PMC free article] [PubMed] [Google Scholar]
Associated Data
This section collects any data citations, data availability statements, or supplementary materials included in this article.


