

Abstract
Objective: We propose a computational framework for integrating diverse patient measurements into an aggregate health score and applying it to patient stability prediction.
Materials and Methods: We mapped retrospective patient data from the Multiparameter Intelligent Monitoring in Intensive Care (MIMIC) II clinical database into a discrete multidimensional space, which was searched for measurement combinations and trends relevant to patient outcomes of interest. Patient trajectories through this space were then used to make outcome predictions. As a case study, we built AutoTriage, a patient stability prediction tool to be used for discharge recommendation.
Results: AutoTriage correctly identified 3 times as many stabilizing patients as existing tools and achieved an accuracy of 92.9% (95% CI: 91.6–93.9%), while maintaining 94.5% specificity. Analysis of AutoTriage parameters revealed that interdependencies between risk factors comprised the majority of each patient stability score.
Discussion: AutoTriage demonstrated an improvement in the sensitivity of existing stability prediction tools, while considering patient safety upon discharge. The relative contributions of risk factors indicated that time-series trends and measurement interdependencies are most important to stability prediction.
Conclusion: Our results motivate the application of multidimensional analysis to other clinical problems and highlight the importance of risk factor trends and interdependencies in outcome prediction.
Keywords: patient discharge, medical informatics, length of stay, computer-assisted diagnosis, clinical decision support systems
BACKGROUND AND SIGNIFICANCE
The increased use of electronic health records in clinical practice has provided an opportunity to translate knowledge into practice at the point of care. Clinical decision support (CDS) systems provide patient-specific information, presented to the care provider at appropriate times during the clinical workflow, to help with decisions that enhance the health of the patient. Based on the clinical context, CDS systems take on a variety of forms, including alerts, reminders, and risk scores.1
Risk-scoring systems quantify a patient’s degree of homeostatic stability and augment the clinician’s ability to determine the appropriate care setting for treatment. However, the most common CDS scoring systems can fail to identify nearly 60% of unstable patients.2 As a result, many unstable patients are not transferred to appropriate care until after they have experienced a life-threatening homeostatic failure like anaphylaxis, heart failure, or kidney failure. Moreover, patients are sometimes misidentified as stable and are transferred to less acute care or are discharged and subsequently undergo homeostatic failure.3 Collectively, these mistakes are referred to as patient transfer and discharge (TD) errors.
Each year, TD errors cost the US health care system billions of dollars and are partially responsible for at least 46 000 deaths.4–8 Existing CDS scoring systems are weakly tuned to the underlying homeostatic physiologies of patients, which limits their ability to support TD decisions. In particular, these systems assume risk factors are independent of one another. Moreover, they are unable to account for chronic conditions, variations in physiology among patients, and trends in patient information. Here, we present a general methodology for homeostatic analysis that addresses the shortcomings of existing CDS scoring systems by considering interactions between risk factors as well as their changes over time. We demonstrate this technique with AutoTriage, a patient stability prediction tool. We compare AutoTriage results to the Medical Emergency Team (MET) calling criteria, the most prevalent tool for identifying at-risk patients, as well as the Modified Early Warning Score (MEWS 4), a state-of-the-art CDS scoring system in clinical use.9,10
METHODS
Preparation of datasets for training and testing
We used a dataset of 4000 patient records from the MIMIC II database.11 This subset consisted of anonymized clinical documentation of adult patients admitted to an ICU at the Beth Israel Deaconess Medical Center (BIDMC) with a variety of chief complaints. The Institutional Review Boards of BIDMC and the Massachusetts Institute of Technology waived the requirement for individual patient consent, as the study did not impact clinical care and all data were de-identified.
Inclusion criteria for this study were:
I. Adult (ie., age ≥18 years) admitted to the cardiac, medical, surgical, or trauma Intensive Care Unit (ICU)
II. Documented length of stay and survival for at least 48 hours following admission
The first 48 hours of each patient’s stay were available for analysis, and we utilized both patient demographic information and dynamic physiological measurements with 1-hour resolution. In particular, we used age, blood oxygen saturation, Glasgow Coma Score, heart rate, respiration rate, systolic blood pressure, temperature, and white blood cell count. These measurements were chosen due to the practical considerations of implementing a discharge recommendation tool in a clinical setting and to facilitate comparison of our results with MET and MEWS, which also rely on vital signs. In particular, these measurements were chosen because they are frequently sampled and widely available, ensuring that our predictions are current and less susceptible to missing data.
Gold standard
The length of stay in the ICU and the number of days survived following ICU admission were known for each patient and were used to define the gold standard for patient stability. In particular, patients were defined to be stable if they (1) were discharged within the 24 hours following our last observation period, and (2) lived for at least 30 days following discharge (Table 1). A random selection of half the patients formed the training set; the remaining patients were reserved for testing. The partitioning was done with a built-in MATLAB (MathWorks, Natick, MA, R2014a) function, which randomized the patients being placed in each group based on their anonymized medical record number (AMRN). In MIMIC-II, AMRNs were assigned in a randomized fashion to meet the Health Insurance Portability and Accountability Act (HIPAA) privacy rule in de-identified clinical data.
Table 1.
Breakdown of patients satisfying the gold standard for stability
| Gold Standard Met | Training Set | Testing Set |
|---|---|---|
| 99 | 92 | |
| 1901 | 1908 |
Y indicates the number of patients that were discharged within the 24 hours after observation ended and were alive for at least 30 days after discharge from the ICU.
Identifying and weighting groups of risk factors
To discretize the possible ranges of each biological measurement of interest, the measurement ranges were first partitioned into a finite number of bins. In this study, we partitioned the 6 vital signs according to a custom heuristic table that incorporates recent findings in the scientific literature and is similar in structure to the MEWS partitioning table. For measurements not covered by existing heuristic tables (eg, white blood cell count), partitions were set to make the number of patients in each bin roughly equal, which is sometimes referred to as statistical binning. Patient trajectories (time-parameterized evolution or coevolution of physiological parameters) were then constructed from the progression of the binned measurements and inserted into a finite discrete hyper-dimensional (FDHD) space (Figure 1). Further, to analyze trends in patient physiology over time, we computed and binned the trends in measurements hour by hour. These differences were treated in the same way as other patient observations. For example, just as a patient would have a heart rate (HR) observation every hour, they would also have a ΔHR (change or trend in HR) observation every hour (difference in HR between the current hour and the previous one).
Figure 1.

Representative schematic of S2-type and D2-type analyses. (A) Sample patient physiological data. (B) Heart rate (HR) and systolic blood pressure (SysBP) coevolve over time and (C) ΔHR (change or trend in HR) and ΔSysBP (trend in SysBP) coevolve over time. In panel (A), observations of HR and SysBP, as well as their hourly changes, are tabulated and normalized according to a heuristic lookup table (bolded numbers in parentheses). These normalized values are then mapped into finite discrete hyper-dimensional space as time-parametrized curves in panels (B) and (C).
We then used custom MATLAB scripts to search each subset of the FDHD space for groupings of risk factors that have significant correlation with patient stability. We searched all individual measurements and groupings of 2 measurements (denoted S1 and S2) and the equivalent for trends (denoted D1 and D2) for the combinations that were most significantly correlated with patient stability (see Figure 1 for examples of S2 and D2 analyses). Specifically, we searched through the time-parameterized evolution of 8 S1 measurements (the 8 physiological values used in this study) and 28 S2 measurements (all possible pairs of physiological values). D1 and D2 also had 8 and 28 measurements, respectively, because there is 1 trend measure (eg, ΔHR) for each physiological value (eg, HR). Each measurement of S1, S2, D1, or D2 type was then assigned a weight between 0 and 1 that indicated its relative impact on patient stability. The weights of the 16 individual measurements and the 56 pairs of measurements were fixed after this step.
Assigning AutoTriage scores for patient stability
After weighting individual measurements by their correlation with patient stability, S-types and D-types (categories) were scaled and combined according to Eq. 1.
| (1) |
MEWS, where normalized values of each vital sign are summed, motivated Eq. 1. The normalized sum-based structure is extended in Eq. 1 to include interdependencies and trends among measurements. The stability score is the sum of trajectory groupings, weighted by coefficient αi. Pi denotes the correlation between measurement grouping i and patient stability. The index, i, takes on values from the set of possible groupings G = {S1, S2, D1, D2}. Note that while Eq. 1 is a linear combination, the Pi values already contain information on higher-dimensional correlations between risk factors. The αi was chosen by an interior-point optimization algorithm to maximize the partial area under the training set receiver operator characteristic curve, corresponding to specificities above 90%, which are within the clinical operating range for discharge specificity.4,12 This optimization criterion was selected to ensure that AutoTriage would achieve high sensitivity (to facilitate early discharge for as many stable patients as possible) with a low false positive rate (to ensure that patients who are not stable are not erroneously discharged). In order to better ensure that the optimized solution was a global maximum, the optimization was performed for 1000 random initializations of coefficients, with values ranging from −0.5 to 0.5. Each coefficient was constrained to lie within −1 to 1.
RESULTS
Prediction performance comparison
When applied to the test set, AutoTriage assigned stability scores ranging from 0.0020 to 0.1533, with an average score of 0.1282. The discharge prediction comparison is shown in Figure 2, yielding area under the ROC curve (AUC) receiver operator characteristic (ROC) values of 0.81, 0.68, and 0.68 for AutoTriage, MET, and MEWS, respectively. To illustrate AutoTriage performance within the range of acceptable erroneous discharge rates, a stability score cutoff of 0.1312 identified 57.7% (95% CI: 55.4–59.8%) of all stable patients while maintaining an erroneous discharge rate of ∼5.5% (95% CI: 4.5–6.6%). AutoTriage identified roughly 3 times the number of stable patients recognized by MET (18.5%) and MEWS (14.1%) at the same discharge error rate. K-fold cross-validation (with K = 10) yielded a similar improvement in performance over MET and MEWS, with AutoTriage identifying 55.2% of stable patients while maintaining an erroneous discharge rate of 93.4%. This corresponded to an average AUC of 0.75, as well as average positive and negative predictive values of 29.7% and 96.7%, respectively. Notably, the AUC performance metric was robust to changes in the time binning interval; choices of 30-, 90-, or 120-minute intervals yielded AUCs similar to that of our default 60-minute bin.
Figure 2.
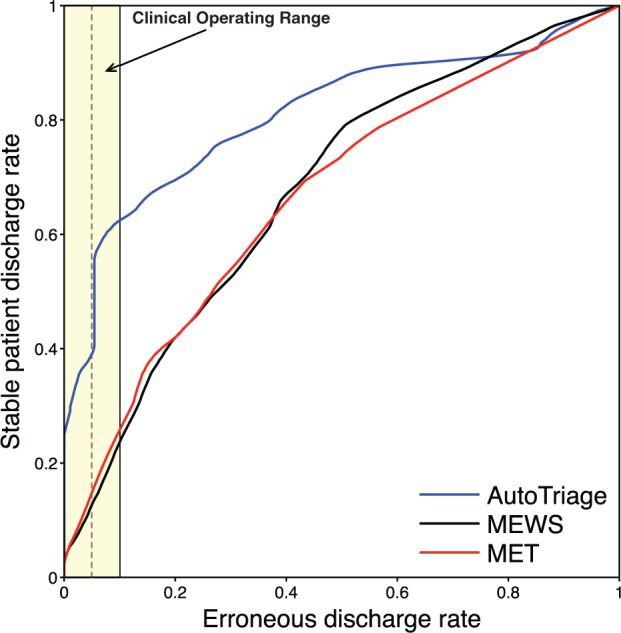
Discharge prediction comparison receiver operating characteristic (ROC) curve of AutoTriage, MET, and MEWS. The clinical operating range, which is the region with an acceptable discharge error rate, is highlighted in yellow.3,11 At an erroneous discharge rate of 5.5% (vertical dotted line), stable patient discharge rates of AutoTriage, MET, and MEWS are 0.578, 0.185, and 0.141, respectively.
Table 2 lists the correctly and incorrectly identified patients from the test set, using the stability score cutoff described above. indicates the number of patients predicted to be discharged by AutoTriage, while denotes the set of patients satisfying the gold standard. Thus, the top-left table entry (,), for example, lists the number of true positives. At a score cutoff of 0.1312, AutoTriage accurately identifies 92.9% (95% CI: 91.6–93.9%) of test set patients.
Table 2.
Confusion matrix for patient stability analysis
| 53 | 104 | |
| 39 | 1804 |
Contributions of individual trajectory groupings to patient score
In order to determine the most important measurement types (categories) for stability prediction, we analyzed the distribution of static (S) and trend (D) type score contributions on a patient-by-patient basis. Averaging the fraction of each patient score from S-type and D-type over all patients revealed that, for AutoTriage, patient stability scores were mostly determined by higher-dimensional and time-series trend measurement types, as opposed to MET and MEWS, which are S1-type (1-dimensional and static) analyses (Figure 3). In particular, S1 accounted for 18.8% (95% CI: 18.6–19.0%), D1 for 19.1% (95% CI: 18.9–19.3%), D2 for 28.3% (95% CI: 28.2–28.5%), and S2 for 33.8% (95% CI: 33.6–34.0%) of each patient’s score.
Figure 3.

Average percent contribution of each measurement type on patient score. S1 are individual measurements and D1 are the trends of individual measurements. S2 are the groupings of 2 measurements and D2 are the equivalent groupings of 2 trends. 95% confidence interval error bars are shown.
DISCUSSION
The homeostatic analysis framework described here has expanded functionality as compared to existing CDS systems. Diverse patient information sources are made interoperable in FDHD space and used to explore risk factor interdependencies. Moreover, while existing risk scoring systems focus on predicting mortality, our framework can be used to predict any binary clinical outcome. This was demonstrated with the creation of AutoTriage, a patient stability prediction tool that can quantify imminent patient discharge 24 hours in advance.
Making sound discharge recommendations requires high specificity, to protect against the erroneous discharge of an unstable patient. Because typical 30-day unplanned rehospitalization rates tend to range from 10% to 20%, we aimed to keep the AutoTriage erroneous discharge rate below 10%.4,12 However, while maintaining patient safety, improving sensitivity for discharge recommendations could greatly reduce costs from unnecessary testing and extended length of stay in the ICU and reduce the risk of contracting hospital-acquired infections. Further, early discharge can accelerate patient recovery in some cases, because rest at home is unhindered by the cacophony of medical alarm noise ever present in the ICU.13 The concern for patient safety and the benefit of early discharge were both incorporated during stability score training, where measurement types were weighted to improve sensitivity while maintaining high specificity. The resulting receiver operator characteristic curve demonstrated that AutoTriage recommendations could ensure patient safety while doubling the number of patients correctly recommended for early discharge. High specificity will also encourage the acknowledgment of AutoTriage recommendations in the clinical setting, as low specificity can cause an estimated 96% of computerized alerts to be disregarded.14
AutoTriage, while built for patient stability prediction, sits atop a general CDS framework. Within this framework, the many possible parameter combinations are searched for those that show the greatest improvement in prediction metrics. This flexibility is critical for developing robust prediction tools, as was demonstrated by the differential weighting of discharge predictor types. Notably, the resulting parameter weightings for S2 and D2 analyses were much higher than the simpler 1-dimensional analyses. These results can help explain the difference in predictive capabilities between AutoTriage, which considers low- and high-dimensional trends, and MET/MEWS, which rely solely on 1-dimensional S-type predictors. In addition, the D-type trend measurements played a large role in stability scoring, which demonstrates the value of including time-series data in predictions.
While AutoTriage was specifically used to recommend discharge, the general CDS framework may also be well suited for applications where early intervention in serious conditions could mitigate morbidity and mortality. For example, it has been shown that mortality from traumatic brain injuries is doubled when patients experience more than 2 hypotensive episodes in the emergency department.15 A time-series analysis of vital sign data could predict a trajectory trending toward a second episode of hypotension and warn the clinician to intervene before a life-threating secondary brain insult occurs. In a similar fashion, it has been shown that hypertension in stroke victims results in a worse neurologic outcome and that accounting for the duration and intensity of hypertension can lead to a more accurate prediction of neurologic outcome.16 Thus, by considering the trajectory of multiple influences on blood pressure and other vital signs, this methodology may be able to warn the clinician much earlier in the patient’s clinical course, when an intervention can reduce the severity of an adverse neurologic outcome. These are 2 examples of the potential application of this methodology to be not only a warning, but a guide to early intervention. Other high-need cases that may be targeted are early detection of sepsis onset, early detection of cardiogenic shock in acute myocardial infarction, and early detection of herniation in traumatic brain injuries and stroke.
In this study, the same medical center (BIDMC) provided the data for both the training and testing of AutoTriage. For patient populations with demographics different than those of BIDMC, it is possible that AutoTriage results may vary. In addition, regional and institutional differences in medical policy and practice could affect the number and types of measurements available for use in making predictions. While the AutoTriage stability score is designed to adapt to changes in patient populations through retraining and the system uses widely used and frequently recorded physiological measurements as inputs, these sources of variation call for future validation studies on more comprehensive datasets. We are currently arranging to validate our results with retrospective patient datasets collected from other hospital systems in geographically distinct regions of the USA.
In addition to providing patient information from diverse institutions and regions, these datasets will contain much longer time series. In the dataset used here, due to data availability, we were limited to using the first 48 hours of patient measurements after ICU admission. This limitation manifested as a sparseness in discharge positive patients (upper row of Table 1) and a low positive predictive value, and threatened the generalizability of our results. To compensate for the lack of positive test patients, we performed extensive cross-validation analysis, which suggests that our results are robust. However, with more longitudinal information, we will be able to expand our gold standard definition to include all patients who eventually stabilize, not just those who stabilize within 3 days of ICU admission, and further validate AutoTriage discharge recommendations.
Currently, our discharge recommendations act on only the most widely available and frequently sampled patient measurements. This benefits AutoTriage’s performance, as data are less frequently missing or unavailable, and allows the higher-dimensional risk factors to be computed more quickly. Further, the challenge of data unavailability will be exacerbated during prospective clinical implementation. However, there are many other measurements, such as additional lab tests and ICD-9 codes, that could be useful in making AutoTriage predictions. But because the number of possible risk factors increases exponentially with the number of measurements, this may lead to large, time-consuming computations. In addition, we anticipate that the inclusion of many new measurements would lead to our model overfitting the data, making our performance less robust to new datasets. One possible solution is to implement a statistical method like least absolute shrinkage and selection operator (LASSO), which would remove risk factors that contribute little to discharge recommendations, thus reducing computation time and overfit. We hope to explore this possible improvement, among the others discussed above, in future work.
The methodology described here integrates information from multiple systems to better inform the clinician of the patient’s trajectory by elucidating patterns among complex correlations among large sets of medical data. While AutoTriage was used to reduce ICU length of stay, we believe that the same CDS framework could identify dangerous patient trajectories in a myriad of other medical syndromes and disease cases and empower the clinician to intervene more effectively.
FUNDING
This material is based upon work supported by the National Science Foundation under Grant No. 1549867. The funder had no role in the conduct of the study; collection, management, analysis, and interpretation of data; preparation, review, and approval of the manuscript; and decision to submit the manuscript for publication.
COMPETING INTERESTS
The authors have no competing interests to declare.
ACKNOWLEDGEMENTS
We would like to thank Mitchell D. Feldman, MD, MPhil (Department of Medicine, University of California, San Francisco, CA, USA) and Jana Hoffman, PhD (Dascena Inc., Hayward, CA, USA) for their suggestions and help with editing.
CONTRIBUTORS
J.S.C. designed the study, contributed to the data analysis, interpreted results, and drafted and revised the paper. D.A.P. contributed to the data acquisition and data analysis, and made revisions to the paper. C.W.B. contributed to the study design and data interpretation, and made significant revisions to the paper. U.K.C. contributed to the study design and results interpretation, and made substantive revisions to the paper. R.D. helped to conceive the study, and contributed to the study design, data analysis, and paper revisions.
REFERENCES
- 1. What is Clinical Decision Support? http://www.healthit.gov/policy-researchers-implementers/clinical-decision-support-cds. Accessed July 1, 2015.
- 2. Santos M, Clifton D, Tarassenko L. Performance of early warning scoring systems to detect patient deterioration in the Emergency Department. In: Gibbons J, MacCaull W, eds. Foundations of Health Information Engineering and Systems. Springer, 2014, 159–169. [Google Scholar]
- 3. Hua M, Wunsch H. The complexities of ICU discharge. Chest. 2015;147: 281–282. [DOI] [PubMed] [Google Scholar]
- 4. Jencks S, Williams M, Coleman E. Rehospitalizations among patients in the Medicare fee-for-service program. N Engl J Med. 2009;360: 1418–1428. [DOI] [PubMed] [Google Scholar]
- 5. Angus D, Kelley M, Schmitz R, et al. Current and projected workforce requirements for care of the critically ill and patients with pulmonary disease: can we meet the requirements of an aging population? JAMA. 2000;284:2762–2770. [DOI] [PubMed] [Google Scholar]
- 6. Chalfin D, Trzeciak S, Likourezos A, et al. Impact of delayed transfer of critically ill patients from the emergency department to the intensive care unit. Crit Care Med. 2007;35:1477–1483. [DOI] [PubMed] [Google Scholar]
- 7. Dasta J, McLaughlin T, Mody S, et al. Daily cost of an intensive care unit day: the contribution of mechanical ventilation. Crit Care Med. 2005;33: 1266–1271. [DOI] [PubMed] [Google Scholar]
- 8. Fakhry S, Leon S, Derderian C, et al. Intensive care unit bounce back in trauma patients: an analysis of unplanned returns to the intensive care unit. J Trauma Acute Care Surg. 2013;74:1528–1533. [DOI] [PMC free article] [PubMed] [Google Scholar]
- 9. Lee A, Bishop G, Hillman K, et al. The medical emergency team. Shock. 1995;7:183–186. [DOI] [PubMed] [Google Scholar]
- 10. Subbe C, Kruger M, Rutherford P, et al. Validation of a modified early warning score in medical admissions. QJM. 2001;94:521–526. [DOI] [PubMed] [Google Scholar]
- 11. Goldberger A, Amaral L, Glass L, et al. Physiobank, physiotoolkit, and physionet components of a new research resource for complex physiologic signals. Circulation. 2000;101:e215–e220. [DOI] [PubMed] [Google Scholar]
- 12. Leppin A, Gionfriddo M, Kessler M, et al. Preventing 30-day hospital readmissions: a systematic review and meta-analysis of randomized trials. JAMA Intern Med. 2014;174:1095–1107. [DOI] [PMC free article] [PubMed] [Google Scholar]
- 13. Xie H, Kang J, Mills G. Clinical review: the impact of noise on patients’ sleep and the effectiveness of noise reduction strategies in intensive care units. Crit Care. 2009;13:208. [DOI] [PMC free article] [PubMed] [Google Scholar]
- 14. Roshanov P, Fernandes N, Wilczynski J, et al. Features of effective computerised clinical decision support systems: meta-regression of 162 randomised trials. BMJ. 2013;346:f657. [DOI] [PubMed] [Google Scholar]
- 15. Barton C, Hemphill J, Morabito D, et al. A novel method of evaluating the impact of secondary brain insults on functional outcomes. Acad Emerg Med. 2004;5:486–487. [DOI] [PubMed] [Google Scholar]
- 16. Barton C, Hemphill J. Cumulative dose of hypertension predicts outcome in intracranial hemorrhange better than American Heart Association guidelines. Acad Emerg Med. 2007;14:695–701. [DOI] [PubMed] [Google Scholar]