Abstract
Background:
Noninvasive measurement of placental blood flow is the major technical challenge for predicting ischemic placenta (IPD). Pseudocontinuous arterial spin labeling (pCASL) MRI was recently shown to be promising, but the potential value in predicting the subsequence development of IPD is not known.
Purpose:
To derive global and regional placental blood flow parameters from longitudinal measurements of pCASL MRI and to assess the associations between perfusion-related parameters and IPD.
Study Type:
Prospective.
Population:
Eighty-four women completed two pCASL MRI scans (first; 14–18 weeks and second; 19–24 weeks) from prospectively recruited 118 subjects. A total of 69 subjects were included for the analysis, of which 15 subjects developed IPD.
Field Strength/Sequence:
3T/T2-weighted half-Fourier single-shot turbo spin-echo (HASTE) and pCASL.
Assessment:
Four perfusion-related parameters in the placenta were derived: placenta volume, placental blood flow (PBF), high PBF (hPBF), and relative hPBF. The longitudinal changes of the parameters and their association with IPD were tested after being normalizing to the 16th and 20th weeks of gestation.
Statistical Tests:
Comparisons between two gestational ages within subjects were performed using the paired Wilcoxon tests, and comparisons between normal and IPD groups were performed using the unpaired Wilcoxon tests.
Results:
The difference between the first and second MRI scans was statistically significant for volume (156.6 cm3 vs. 269.7 cm3, P < 0.001) and PBF (104.9 ml/100g/min vs. 111.3 ml/100g/min, P = 0.02) for normal subjects, indicating an increase in pregnancy with advancing gestation. Of the parameters tested, the difference between the normal and IPD subjects was most pronounced in hPBF (278.1 ml/100g/min vs. 180.7 ml/100g/min, P < 0.001) and relative hPBF (259.1% vs. 183.2%, P < 0.001) at 16 weeks.
Data Conclusion:
The high perfusion-related image parameters for IPD were significantly decreased from normal pregnancy at 14–18 weeks of gestation.
Placental dysfunction is thought to cause serious consequences such as gestational hypertension, preeclampsia,1–5 preterm birth,6 intrauterine growth restriction,7 and prematurity.8 In addition, abnormalities in placental development can cause lifelong morbidity, including cardiovascular disease, type 2 diabetes, and certain cancers and infections in the off-spring.9,10 Therefore, the development of an accurate real-time and noninvasive way to assess placental health early in pregnancy would have great potential to help diagnose abnormalities in order to improve the health of both mother and child.11
Ischemic placental disease (IPD) represents various conditions of placental insufficiency, and each condition shares some common features such as a failure of spiral artery remodeling, uteroplacental underperfusion, chronic hypoxia, and placental ischemia.12 It is still under debate if an early failure of the spiral artery remodeling induces an overall change in placental blood flow and downstream resistance.13–16 However, it is reported that the local placental blood flow should decrease to ~10 cm/s to ensure adequate perfusion of oxygen and nutrition from the intervillus space to the villus.17,18 Therefore, noninvasive real-time measurement of the volumetric placental blood flow may provide useful information in predicting IPD.
The most common noninvasive method in current use to monitor blood flow is performing an ultrasound Doppler, which provides hemodynamic information within the uterine artery (UA). UA Doppler has previously been deemed useful in detecting an abnormal increase in placental vascular resistance.19 However, the UA Doppler measures blood flow in the uterine artery, not in the placenta, limiting the ability to measure placental volumetric perfusion abnormalities. Therefore, several studies have reported that UA Doppler may not possess sufficient sensitivity and specificity necessary in predicting IPD at early gestation.20–23
Magnetic resonance imaging (MRI), on the other hand, could serve as a reliable imaging alternative to the UA Doppler measurements because it is a similarly noninvasive method able to measure volumetric placental blood flow. Arterial spin labeling (ASL)24 is one of the most promising noncontrast perfusion MRI techniques. Several studies have shown the feasibility of measuring placental perfusion using pulsed ASL (PASL)25,26 and velocity-selective ASL (VSASL).27 However, major challenges still exist, including a requirement for full volumetric coverage of the placenta and separation of blood flow contributed from maternal vs. fetal sources. Pseudocontinuous ASL (pCASL) was shown to be a promising modality capable of overcoming these challenges, since the technique allows the measurement of blood flow contributed solely from the maternal source with high signal-to-noise ratio (SNR) efficiency. Shao et al recently demonstrated the feasibility in measuring volumetric placental blood flow using a multidelay pCASL sequence with the inner-volume 3D GRASE acquisition.28
In this study we aimed to perform a longitudinal analysis of pCASL MRI during the second trimester by deriving global and regional placenta perfusion-related parameters and to assess associations between placenta perfusion-related parameters and IPD. The imaging features from placental blood flow were examined in the context of clinical primary outcomes of IPD vs. normal pregnancies to evaluate the potential value of this modality in predicting the subsequent development of IPD.
Materials and Methods
Subject Population and Primary Outcome
This prospective study was approved by the local Institutional Review Board (IRB), and all subjects provided written informed consent. Without preselection, we approached all eligible pregnant women entering prenatal care in the first trimester of pregnancy at the local prenatal clinic. The eligibility criteria included subjects less than 14 weeks gestational age, more than 18 years old, viable pregnancy, not carrying twins, and planning to deliver at the same local institution. A total of 118 pregnant women were recruited from February 2016 to August 2018 and underwent two longitudinal MRI scans (first: 14–18 weeks, and second: 19–24 weeks). Gestational age was confirmed by a dating ultrasound scan in the first trimester of pregnancy. Thirty-four subjects were excluded because of incomplete MRI scans (n = 13) and unavailable or waiting for birth outcomes (n = 21). A total of 84 subjects completed both MRI exams and 15 out of 84 subjects developed IPD, including three gestational hypertension, five preeclampsia, three intrauterine growth restriction (IUGR) / small for gestational age (SGA), two preterm birth, and two a combination of these conditions. We excluded 10 normal pregnancy subjects due to severe imaging artifacts, potentially due to amniotic fluid, subcutaneous fat, or motion and five subjects who developed gestational diabetes, leaving a total of 69 women (age 33.4 ± 4.4, from 21–43 years old) included for the analysis. The baseline characteristics of all 69 women are shown in Table 1, and the flowchart for the study inclusion of 69 subjects is presented in Fig. 1.
TABLE 1.
Baseline Characteristics of All 69 Women In Both Normal Subjects and Subjects With IPD
| Characteristic | Normal subjects | Subjects with IPD (N = 15) | |
|---|---|---|---|
| Age (year) | 34.2 ± 4.7 (26.0–43.0) | 34.2 ± 4.9 (25.8–43.0) | 35.1 ± 3.5 (29.2–42.2) |
| First MRI scan (week) | 15.6 ± 1.0 (14.1–17.5) | 15.7 ± 1.0 (14.1–17.6) | 15.7 ± 1.0 (14.4–17.1) |
| Second MRI scan (week) | 20.8 ± 1.3 (19.3–24.4) | 20.8 ± 1.3 (19.3–24.2) | 20.2 ± 1.2 (19.0–23.4) |
Data are means ± standard deviations, with 95% confidence intervals in parentheses. IPD = Ischemic Placenta Disease, PBF = Placenta Blood Flow, and hPBF = High Placenta Blood Flow.
FIGURE 1:
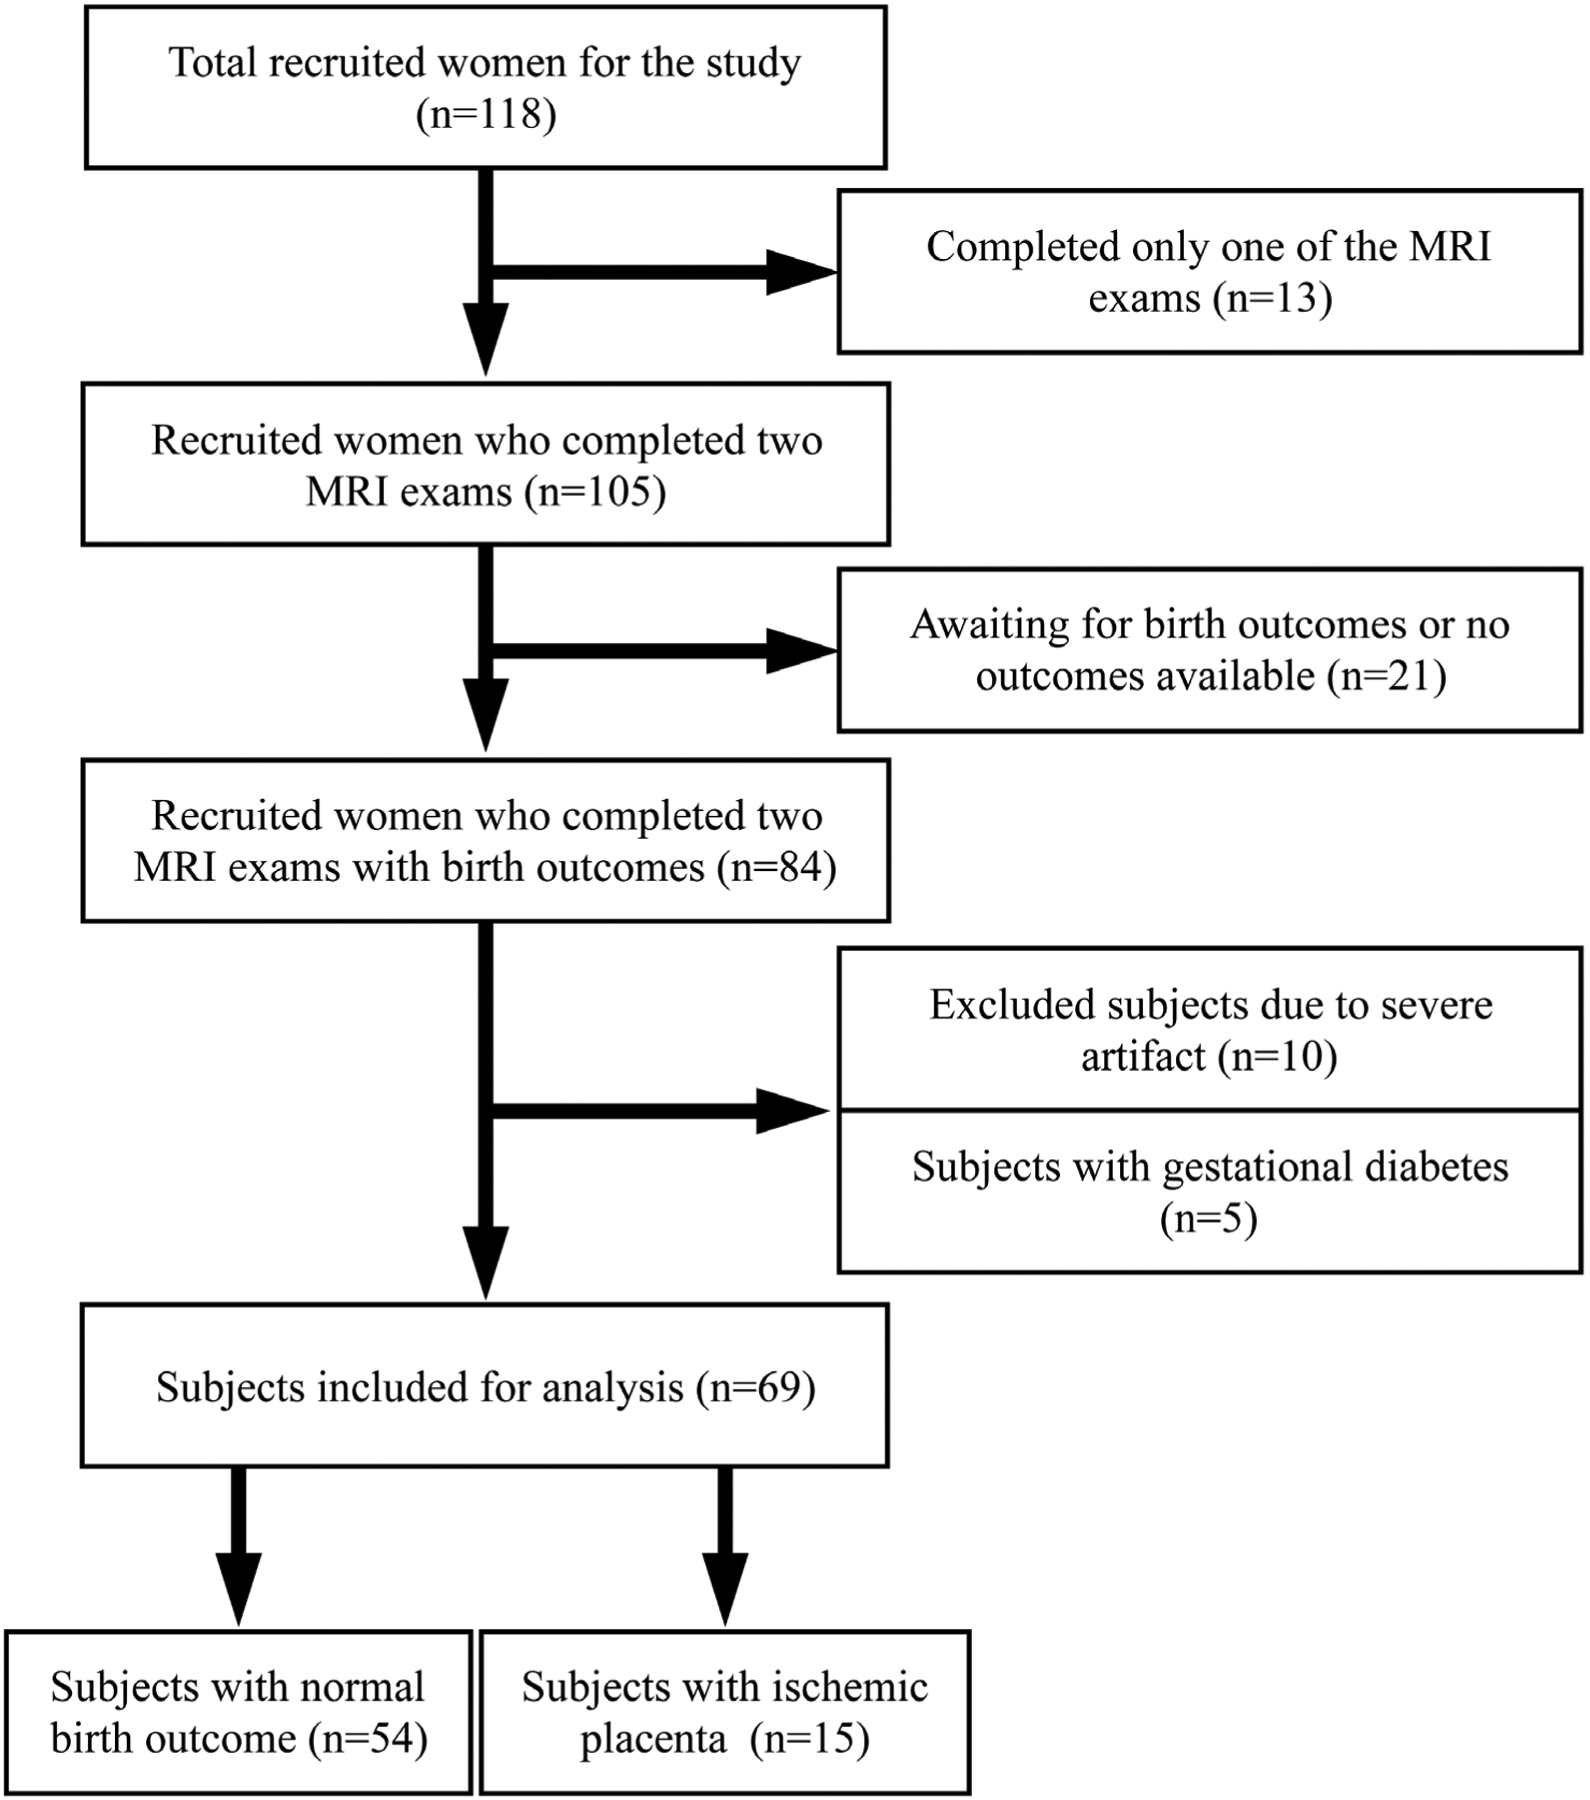
Flowchart for study inclusion describing how the patient cohort was derived.
At the time of birth, clinical information inclusive of maternal and neonatal outcomes were reviewed to assess the primary outcome, namely, the composite placenta insufficiency, IPD. We defined IPD as women diagnosed with gestational hypertension, preeclampsia, or bearing IUGR/SGA, preterm birth, or a combination of these conditions that have been used by the American College of Obstetrics and Gynecology (ACOG).29,30 Preeclampsia was defined as systolic blood pressure of 140 mm Hg or higher, or diastolic pressure of 90 mm Hg or higher on two occasions at least 4 hours apart after 20 weeks of gestation in a woman with a previously normal blood pressure and proteinuria of 300 mg or more in 24 hours. In the absence of proteinuria, preeclampsia was defined as new-onset hypertension with new-onset of thrombocytopenia, renal insufficiency (serum creatinine greater than 1.1 mg/dL), impaired liver function (elevated liver transaminases to twice the normal concentration), pulmonary edema, or cerebral or visual symptoms.29 IUGR/SGA was defined as fetal growth deceleration with estimated fetal weight less than 10% for expected gestational age and/or newborn weight less than 10% for expected newborn weight. Preterm birth was defined as a liveborn or stillborn infant for any cause between 20–37 weeks of gestation.
MRI Technique
All the experiments were performed on two Siemens 3T MRI scanners (Skyra and Prisma; Siemens Healthineers, Erlangen, Germany) using a phased-array body coil. All subjects underwent MRI scans in a feet-first, supine position and were breathing normally. Our imaging protocol included T2-weighted (T2w) half-Fourier single-shot turbo spin-echo (HASTE) MRI for anatomical references and pCASL for placental blood flow (PBF) measurements. Three free-breathing T2w HASTE MRI images were acquired to cover the whole placenta along axial (echo time [TE] / repetition time [TR] = 92/3000 msec, echo train length [ETL] = 70, field-of-view [FOV] = 500 × 265 mm2, and resolution = 0.98 × 0.98 × 5 mm3), sagittal (TE/TR = 92/3000 msec, ETL = 86, FOV = 500 × 265 mm2, and resolution = 0.98 × 0.98 × 5 mm3) and coronal (TE/TR = 92 /3000 msec, ETL = 114, FOV = 500 × 375 mm2, and resolution = 0.98 × 0.98 × 5 mm3) planes, each lasting about 2 minutes. The T2w images were used to calculate the placental volume and as a reference in choosing the labeling position and imaging plane for pCASL.
A free-breathing 3D pCASL sequence with inner-volume excitation was used for the PBF measurement (TE/TR = 37.12/4000 msec, FOV = 300 × 300 mm2, and resolution = 3.13 × 3.13 × 3 mm3). Eight slices were acquired for the volumetric coverage of placenta (slice thickness = 3 mm). Background suppression with two inversion pulses was used to minimize noise from motion.31 A 10-mm thick pCASL labeling plane was positioned right above the aortic bifurcation to apply a 1.5-sec labeling pulse train, as shown in Fig. 2, and three postlabeling delays (PLD) were used (1000 msec, 1500 msec, and 2000 msec). For each PLD, an image without labeling and background suppression (M0) was first acquired, and 14 pairs of label-control images were acquired (2 min scan time for each PLD).
FIGURE 2:
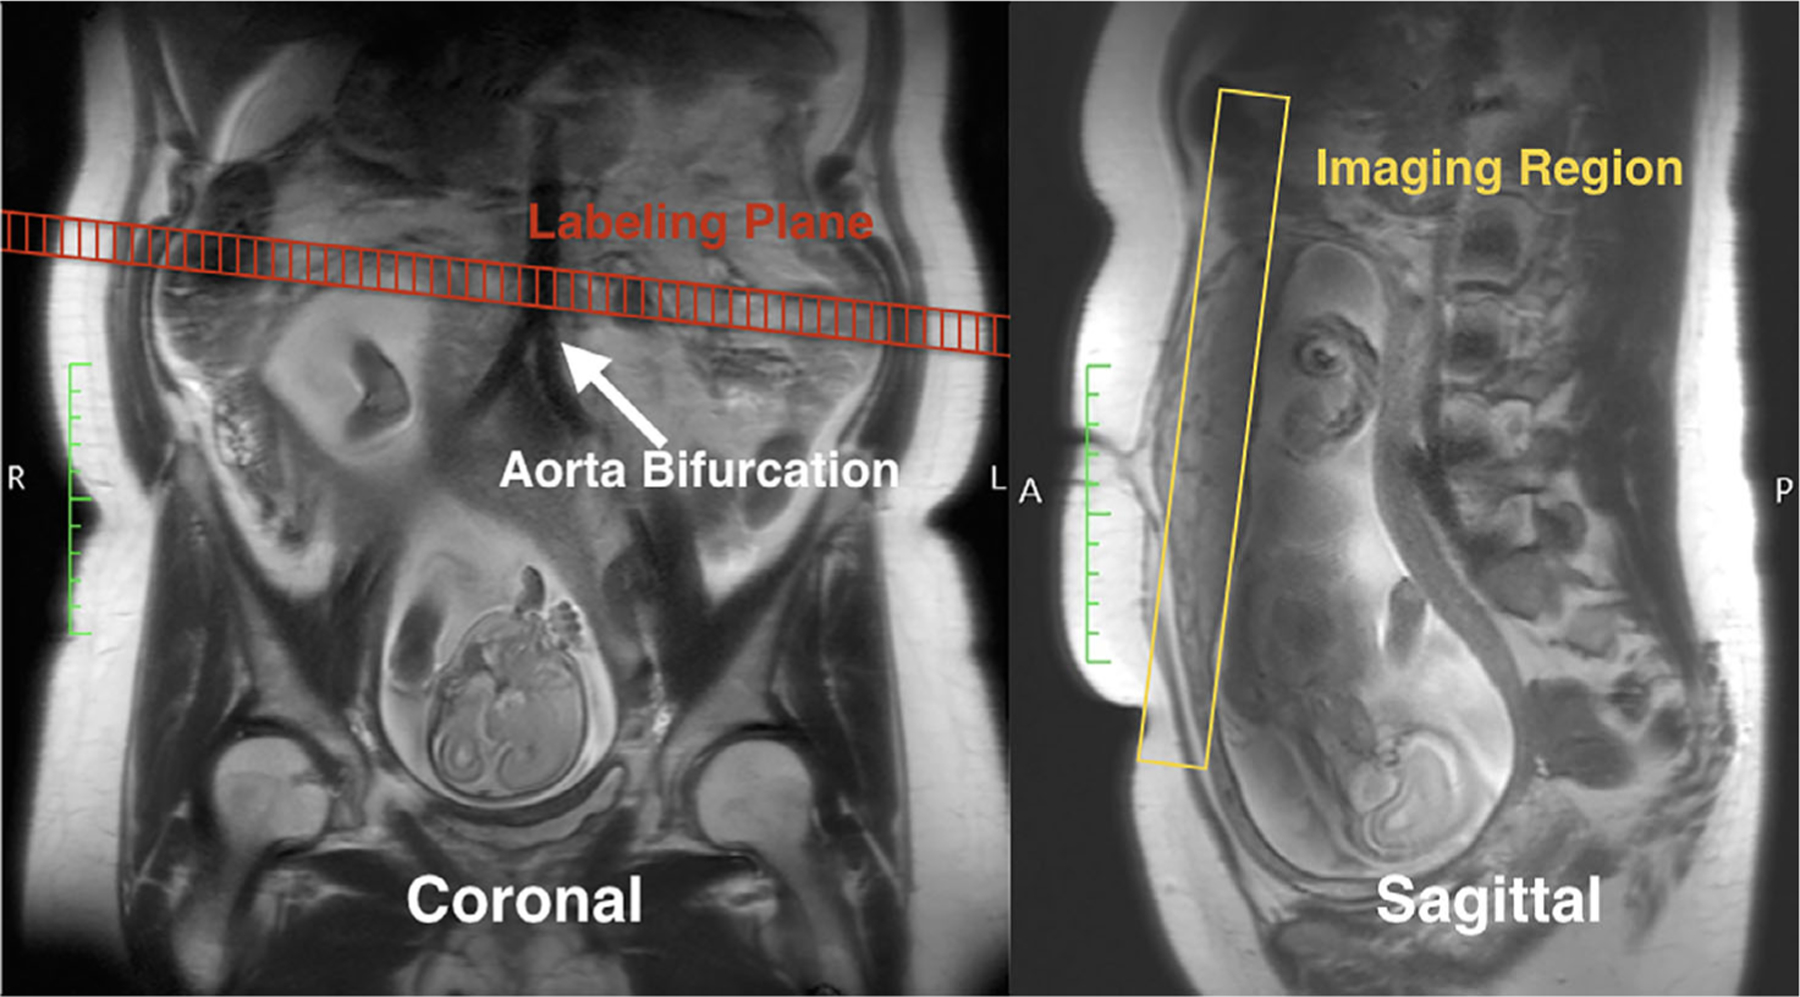
Illustration of the labeling and imaging planes of pCASL MRI, overlaid with the T2-HASTE image as anatomical references. The labeling plane was placed right above the aortic bifurcation, perpendicular to the main blood flow. The volumetric imaging region was placed to cover the placenta.
Image Analysis
All the image analysis was performed using MatLab (MathWorks, Natick, MA), ImageJ (Rasband, National Institutes of Health, v. 1.51s, URL: https://imagej.nih.gov/ij)32 and the open-source image analysis software OsiriX MD v. 8.0. Figures were drawn with matplotlib.33 For PBF maps, radiology research fellows, supervised by MRI scientists, manually defined ROIs on M0, excluding artifacts from fat and amniotic fluid, referencing with T2w HASTE images. The research fellows were also supervised by both a radiologist who is specialized in maternal fetal imaging and an obstetrician-gynecologist who is specialized in maternal and fetal medicine whenever the placenta anatomy is challenging to segment. After the placenta segmentation was completed, pixelwise PBF (ml/100g/min) was estimated by fitting the pairwise subtraction of control and label images (ΔM) into the perfusion model,24,34 expressed as:
| (1) |
where λ is the blood and placenta tissue water partition coefficient, R1α is the longitudinal relaxation rate of blood, α is the labeling efficiency, Δ is the transit time from the labeling to the placenta, ω is PLD (=1000/1500/2000 msec), and τ is labeling duration (=1500 msec). We measured PBF and δ with the assumption of α of 0.767, λ of 0.9 ml/g, and R1α of 1/1650 msec−1.28 The motion between each pCASL acquisition was corrected by the advanced normalization tools (http://www.picsl.upenn.edu/ANTS). For placental volumes, 3D regions of interest (ROIs) were also manually drawn in each imaging plane (axial, sagittal, and coronal) to cover the entire placenta, as shown in Fig. 3. The placenta volumes measured by three orthogonal planes were averaged to minimize potential error due to low through-plane resolution on T2w HASTE MRI.
FIGURE 3:
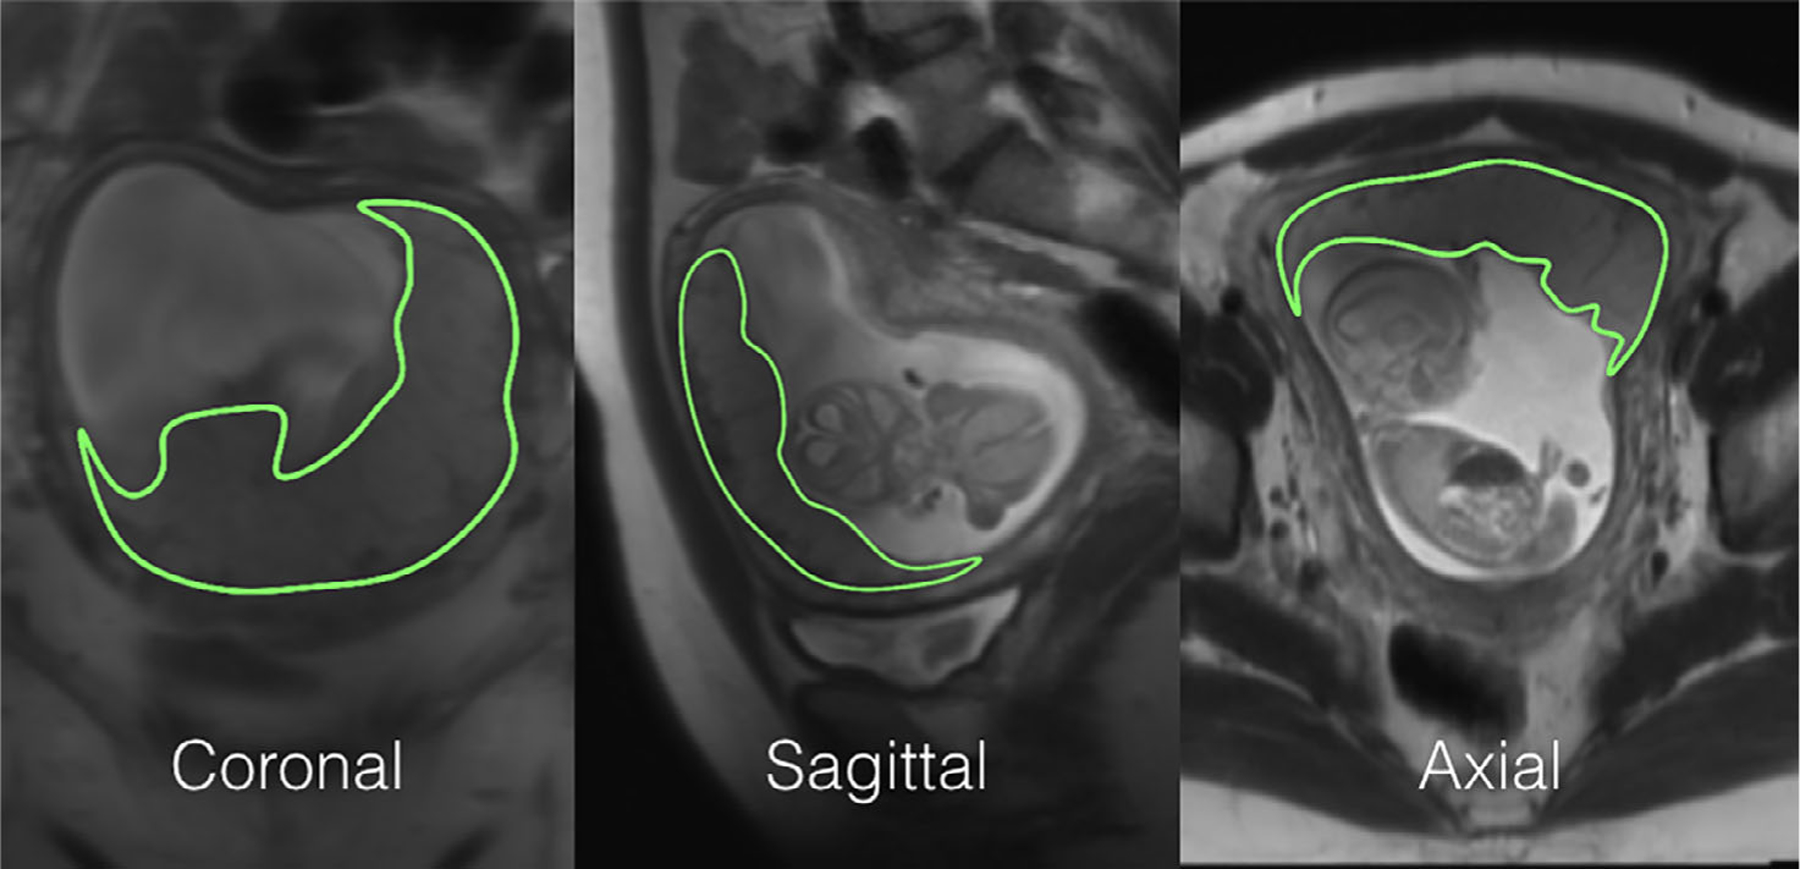
An example of placenta segmentations on T2-HASTE used for placental volume quantification. 3D ROIs were drawn on all three directions. The final volume was calculated as an average of all three.
As placental blood flow heterogeneity was observed, two new imaging parameters, named high PBF (hPBF) and relative hPBF, were computed by accounting for regional high perfusion. We applied the initial thresholding to separate high and low PBF areas by using a binary segmentation algorithm.35 To minimize any potential bias from noise, a point-by-point SNR map was computed, as the mean divided by standard error across measurements, and was applied to the initial hPBF, as described below:
| (2) |
where θ is the threshold. Thus, the hPBF ROI was just defined as the intersection of areas of PBF greater than θ and SNR greater than 1, as shown in Fig. 4. When no available hPBF ROI exists (no placenta blood flow greater than θ shown on the high SNR region), the scan was excluded from the hPBF calculation (nine out of 69 subjects were excluded, all of whom delivered normally). The final hPBF was calculated as the mean of PBF values over the hPBF ROI. We also computed the relative contribution of the regional high blood flow, relative hPBF, by normalizing hPBF with the global placenta blood flow in percentage, defined as hPBF/PBF × 100%. Note that the estimation process for both PBF and hPBF does not include any manual selection except the placenta segmentation, minimizing intra- and interobserver variability.
FIGURE 4:
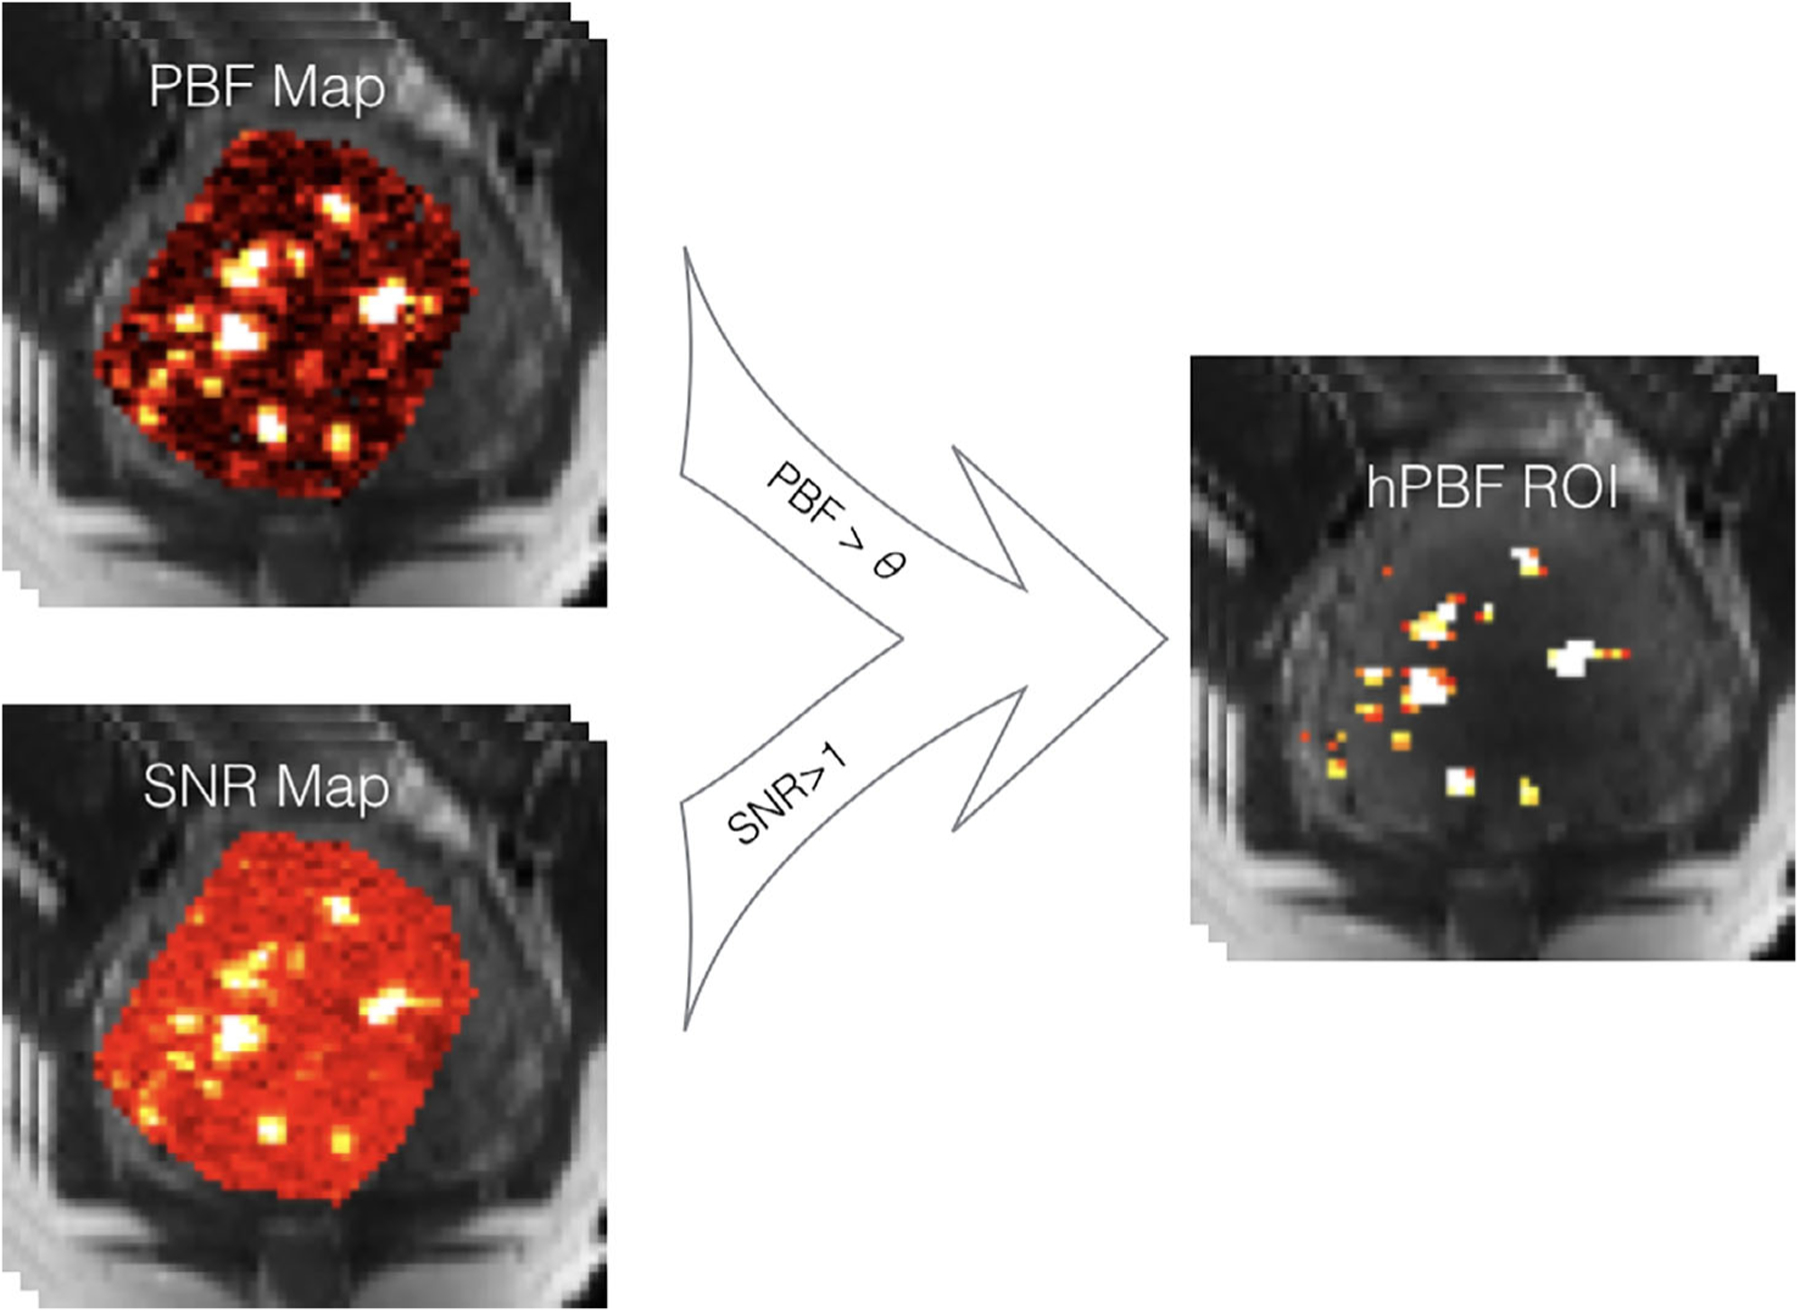
A diagram of generating hPBF. The high PBF region was identified by Otsu’s method, and the high SNR region was segmented by the threshold of one. The final hPBF region was an intersection of both.
Four perfusion-related imaging parameters were derived: placental volume, PBF, hPBF, and relative hPBF. Each parameter consists of two temporal points on a longitudinal continuum, corresponding to the first and second MRI scans, and the two points were normalized to the 16th and 20th weeks of gestation based on a linearity assumption. The 16 and 20 weeks were the average gestational age of all 69 subjects during their first and second scans. The longitudinal patterns of four imaging parameters were tested with and without temporal normalization, and associations between imaging parameters and IPD were evaluated. We also tested the repeatability of the perfusion-related imaging parameters by randomly selecting seven pairs of the pCASL label/control images in test and retest groups. Linear correlation was performed between test and retest groups, and Pearson’s correlation coefficient was used to evaluate the strength of the linear relationship.
Statistical Analysis
All statistical analyses were performed using MatLab (MathWorks). Mean and standard deviation (SD) were used to summarize the distributions of the four imaging parameters of normal and IPD cases. Comparisons between two gestational ages within subjects were performed using the paired Wilcoxon tests, and comparisons between normal and IPD groups were performed using the unpaired Wilcoxon tests. P-values less than 0.05 were considered statistically significant and less than 0.01 were considered highly significant.
Results
Figure 5 shows two representative examples of PBF maps using pCASL MRI: normal and preterm birth subjects at first and second MRI scans. Spatial heterogeneities of the placental blood flow can be clearly observed with scattered high blood flow areas in normal pregnancy (PBF = 151.1 ml/100g/min and hPBF = 420.0 ml/100g/min) at 16 weeks and (PBF = 162.1 ml/100g/min and hPBF = 526.4 ml/100g/min) at 20 weeks, while low spatial heterogeneities with low blood flow was noted in the preterm birth subject, particularly (PBF = 95.4 ml/100g/min and hPBF = 198.7 ml/100g/min) at 16 weeks.
FIGURE 5:
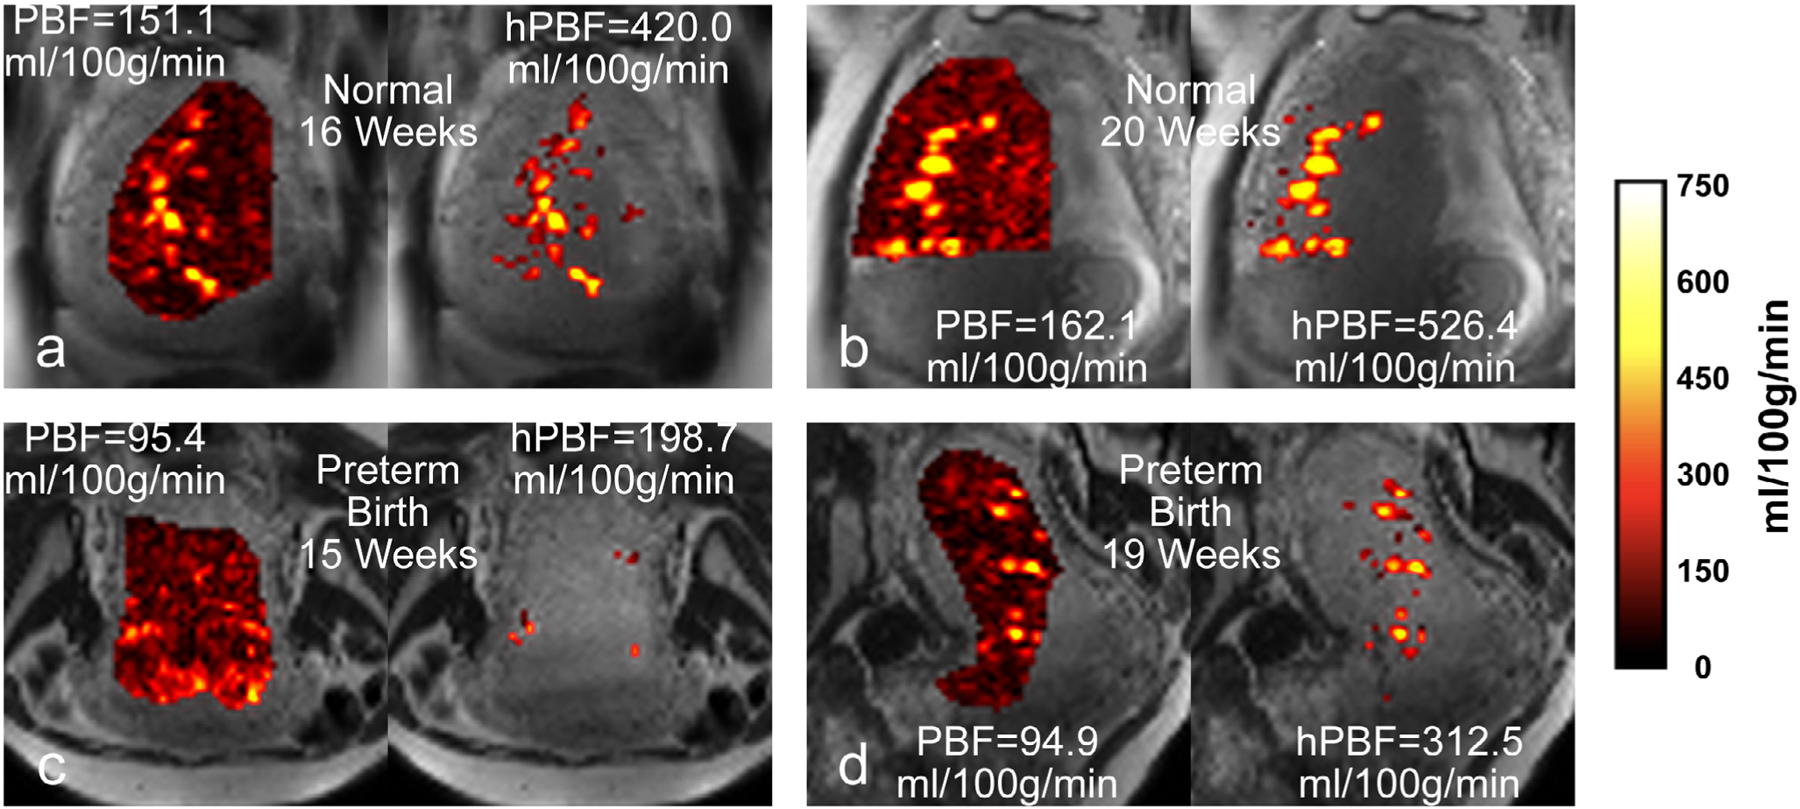
PBF and hPBF maps of representative examples: a normal case at first (a) and second (b) scans; a preterm birth case at first (c) and second (d) scans.
Table 2 shows a summary of the longitudinal changes of the four imaging parameters observed in normal and IPD subjects. The imaging parameters at normalized weeks are shown as means ± standard deviations. The difference between first and second MRI scans was highly significant for the placental volume (156.6 cm3 ± 53.8 vs. 269.7 cm3 ± 80.0, P < 0.001) and statistically significant for PBF (104.9 ml/100g/min ± 31.4 vs. 111.3 ml/100g/min ± 25.9, P = 0.02) in normal subjects, indicating an overall development of the placenta along advancing gestational age and its associated increase in blood flow. Note that the longitudinal trajectory of placental volume generally matches that observed in a previous MRI study.36
TABLE 2.
Longitudinal Changes of the Perfusion-Related Imaging Parameters in Normal and IPD Subjects
| Placental volume (cm3) | PBF (ml/100g/min) | hPBF (ml/100g/min) | Relative hPBF (%) | |||||
|---|---|---|---|---|---|---|---|---|
| Normal subjects N = 54 (N = 45 for hPBF and relative hPBD) | 156.6 ± 53.8 (74.6–400.2) | 269.7 ± 80.0 (130.7–483.9) | 104.9 ± 31.4 (52.8–171.1) | 111.3 ± 25.9 (70.0–169.1) | 278.1 ± 81.8 (60.2–449.2) | 298.2 ± 90.2 (128.1–515.0) | 259.1 ± 64.4 (87.9–498.1) | 270.8 ± 73.5 (102.9–422.6) |
| P-value | <0.001** | 0.02* | 0.09 | 0.14 | ||||
| Subjects with IPD N = 15 | 132.0 ± 33.4 (82.2–206.0) | 259.5 ± 87.1 (179.7–500.9) | 97.2 ± 25.3 (45.3–134.8) | 106.6 ± 22.3 (64.3–136.2) | 180.7 ± 74.0 (47.0–326.3) | 256.1 ± 113.5 (32.5–430.6) |
183.2 ± 55.1 (99.0–295.2) | 237.2 ± 95.5 (47.2–372.0) |
| P-value | <0.001** | 0.11 | 0.048* | 0.06 | ||||
Data are means ± standard deviations, with 95% confidence intervals in parentheses. P values were obtained using the paired Wilcoxon tests between first and second MRI scans after normalizing to 16 and 20 weeks. IPD = Ischemic Placenta Disease, PBF = Placenta Blood Flow, and hPBF = High Placenta Blood Flow.
Statistically significant (P < 0.05).
Highly significant (P < 0.01).
The differences between normal and IPD subjects for the four imaging parameters are illustrated in Fig. 6 as boxplots. The red color denotes IPD and the blue color denotes normal pregnancy. Table 3 contains the statistical comparison between normal and IPD subjects. The difference between the normal and IPD subjects was most pronounced in hPBF (278.1 ml/100g/min ± 81.8 vs. 180.7 ml/100g/min ± 74.0, P < 0.001) and relative hPBF (259.1% ± 64.4 vs. 183.2% ± 55.1, P < 0.001) at 16 weeks. This difference was not consistent in hPBF (298.2 ml/100g/min ± 90.2 vs. 256.1 ml/100g/min ± 113.5, P = 0.33) and relative hPBF (270.8% ± 73.5 vs. 237.2% ± 95.5) at 20 weeks, which may suggest the recruitment of various compensatory mechanisms during the second trimester.
FIGURE 6:
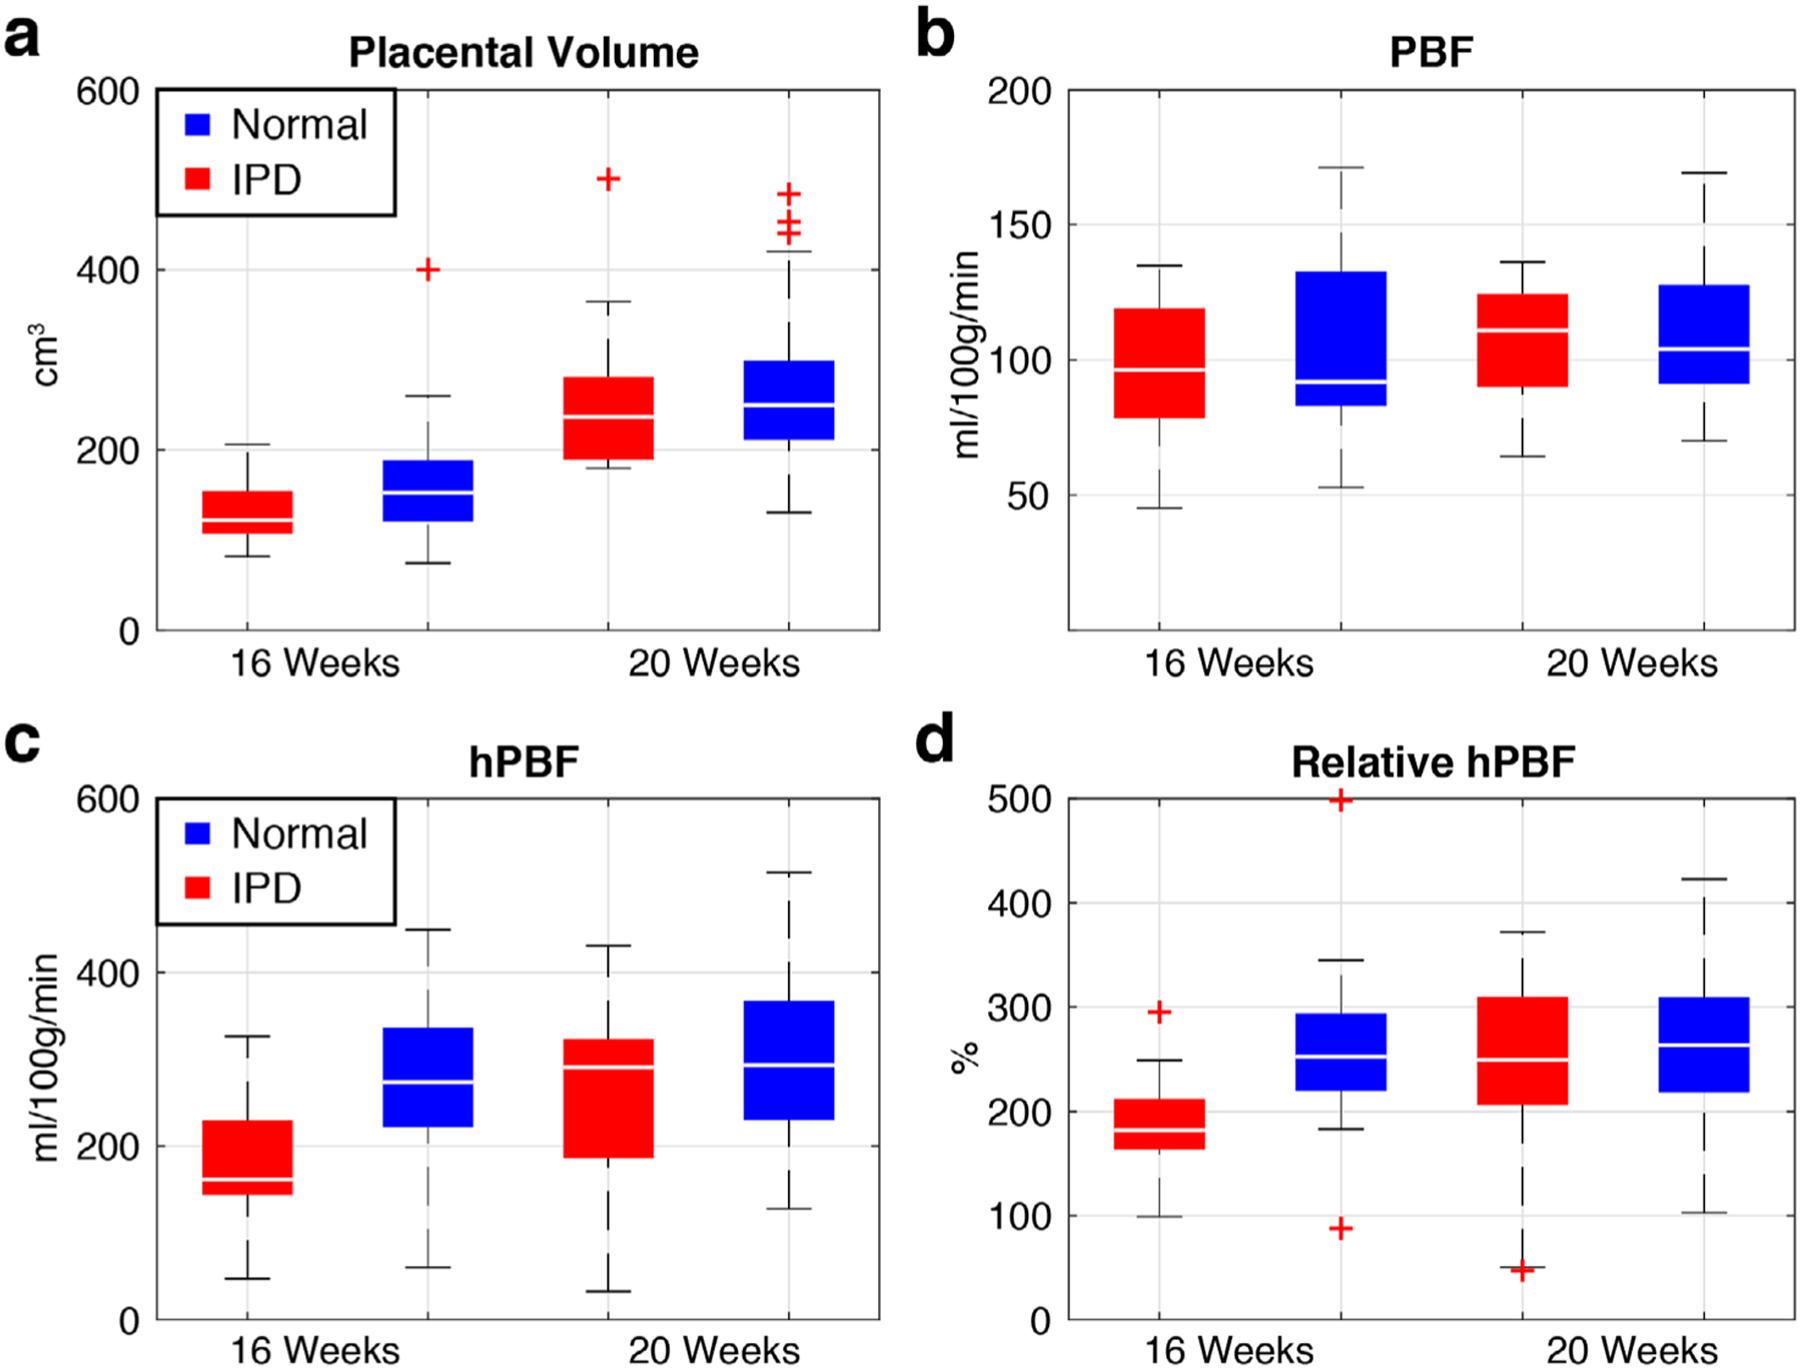
Boxplots of placental volume (a), PBF (b), hPBF (c), and relative hPBF (d) at normalized 16 and 20 weeks for both IPD (red) and normal (blue) cases. The maximum difference between normal and IPD cases was observed in both hPBF (P < 0.001) and relative hPBF (P < 0.001) at 16 weeks.
TABLE 3.
Statistical Comparison Between Normal and IPD Subjects
| Placental volume (cm3) | PBF (ml/100g/min) | hPBF (ml/100g/min) | Relative hPBF (%) | |||||
|---|---|---|---|---|---|---|---|---|
| 16 Weeks (normalized) | 156.6 ± 53.8 (86.3–232.3) | 132.0 ± 33.4 (85.4–199.3) | 104.9 ± 31.4 (63.3–161.1) | 97.2 ± 25.3 (50.0–132.0) | 278.1 ± 81.8 (164.9–414.8) | 180.7 ± 74.0 (57.1–311.0) | 259.1 ± 64.4 (183.3–340.8) | 183.2 ± 55.1 (100.1–283.6) |
| P-value | 0.08 | 0.53 | <0.001** | <0.001** | ||||
| 20 Weeks (normalized) | 269.7 ± 80.0 (176.4–436.3) | 259.5 ± 87.1 (180.1–466.8) | 111.3 ± 25.9 (78.3–159.4) | 106.6 ± 22.3 (66.7–136.1) | 298.2 ± 90.2 (152.3–428.2) | 256.1 ± 113.5 (38.7–418.3) | 270.8 ± 73.5 (176.8–414.3) | 237.2 ± 95.5 (48.0–364.5) |
| P-value | 0.48 | 0.76 | 0.33 | 0.37 | ||||
| Slope | 56.6 ± 27.0 (20.9–120.1) | 63.7 ± 30.7 (36.2–136.6) | 3.2 ± 12.5 (−19.6–20.8) | 4.7 ± 12.3 (−18.4–28.2) | 10.0 ± 35.2 (−45.2–65.1) | 37.7 ± 69.7 (−127.5–129.3) | 5.9 ± 36.1 (−57.4–58.4) | 27.0 ± 60.0 (−106.8–120.8) |
| P-value | 0.55 | 0.95 | 0.007** | 0.03* | ||||
| Average | 213.1 ± 62.6 (138.5–315.0) | 195.7 ± 58.4 (139.0–330.2) | 108.1 ± 25.9 (73.1–151.2) | 101.9 ± 20.4 (65.5–132.7) | 288.1 ± 78.6 (173.1–406.7) | 218.4 ± 65.7 (118.5–319.8) | 264.9 ± 58.9 (185.7–348.7) | 210.2 ± 49.8 (118.3–288.5) |
| P-value | 0.25 | 0.60 | 0.003** | 0.002** | ||||
Data are means ± standard deviations, with 95% confidence intervals in parentheses. P values were obtained using the unpaired Wilcoxon tests between normal and IPD subjects. IPD = Ischemic Placenta Disease, PBF = Placenta Blood Flow, and hPBF = High Placenta Blood Flow.
Statistically significant (P < 0.05).
Highly significant (P < 0.01).
Figure 7 demonstrates the relationship between hPBF and relative hPBF at 16 weeks (Fig. 7a) and 20 weeks (Fig. 7b). Among all the parameters measured, the combination of hPBF and relative hPBF demonstrates the most likely potential of being able to differentiate between normal and IPD subjects, particularly as early as at 16 weeks (see Supplemental Fig 1. for scatterplots between individual conditions of IPD and normal subjects).
FIGURE 7:
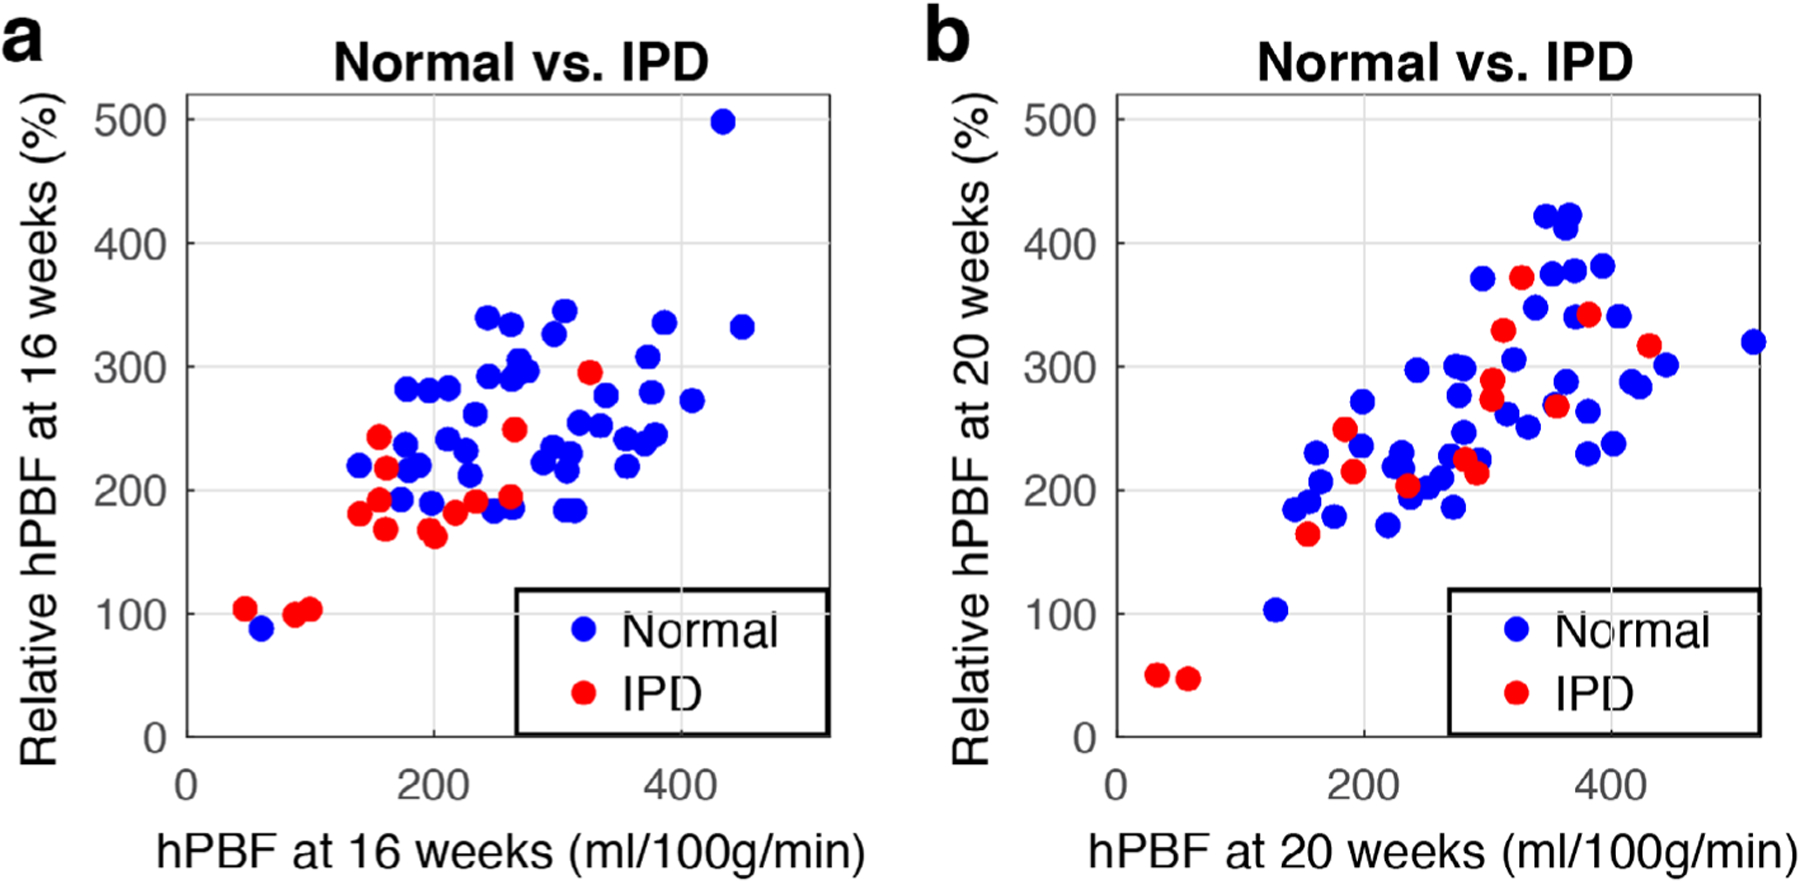
Scatterplots of hPBF and relative hPBF at normalized first (a) and second (b) scans. Blue dots represent normal pregnancy, red dots represent IPD cases.
Figure 8 shows the repeatability test of PBF, hPBF, and relative PBF between test and retest groups at 16 weeks and 20 weeks. Strong linear correlations were observed in PBF (Fig. 8a; r = 0.91 at both 16 and 20 weeks), hPBF (Fig. 8b; r = 0.88 at 16 weeks and r = 0.92 at 20 weeks), and relative hPBF (Fig. 8c; r = 0.89 at 16 weeks and r = 0.86 at 20 weeks).
FIGURE 8:
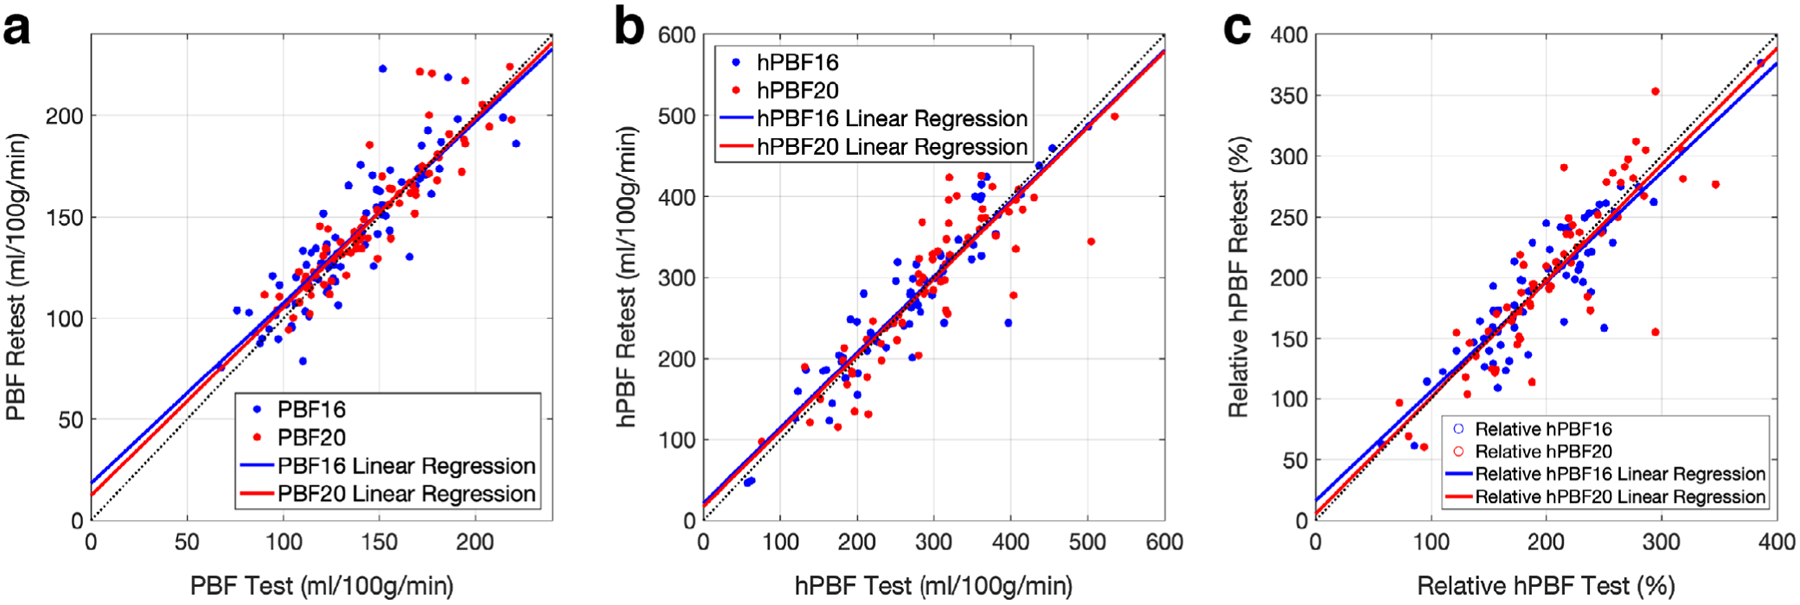
The repeatability test of the perfusion-related parameters: PBF (a), hPBF (b), relative hPBF (c). Linear regressions between test and retest groups are shown for 16 and 20 weeks.
Discussion
Pseudocontinuous ASL (pCASL) MRI was recently shown to be a promising modality capable of measuring volumetric blood flow in the placenta, but the potential value in predicting the subsequent development of IPD is not known. We proposed to derive global and regional placental blood flow parameters using a longitudinal analysis using pCASL MRI and assessed associations between perfusion-related imaging parameters and IPD using a total number of 69 pregnant women. The high perfusion-related imaging parameters, hPBF and relative hPBF, were significantly different between IPD and normal subjects at 14–18 weeks, while other perfusion-related parameters were not so at both 14–18 weeks and 19–24 weeks.
We investigated the longitudinal changes of PBF during the second trimester. The placental volume demonstrated a significant difference between the first and second MRI scans for normal and IPD subjects, indicating an overall development of placenta along the gestational age and its associated increase of blood flow. Due to the limited number of longitudinal MRI scans, we normalized the perfusion-related imaging parameters to the 16th and 20th weeks of gestation based on the linear interpolation and extrapolation. This linearity assumption may not pose an issue, since intervals between the two scans were relatively short (5.2 ± 1.3 weeks for normal subjects and 4.5 ± 1.3 weeks for IPD).
Our study prospectively recruited a total of 118 women at established antenatal clinics and followed their clinical information and neonatal outcomes to evaluate associations of placental perfusion-related imaging parameters and concomitant primary outcomes. We lost some study participation due to the nature of the study, which requires participation in two longitudinal MRI scans with continuation of monitoring until the time of birth. Nonetheless, we successfully recruited 84 women who completed two MRI exams without preselection, where the incidence of IPD was ~18% (15 out of 84 subjects). This incidence rate was consistent with what we estimated based on our prior experience and other studies (preeclampsia complicates ~2–8% of pregnancies, preterm birth affects about 10% of pregnancies, and SGA/IUGR affects an estimated 3–5% of pregnancies).37 We believe this study cohort is highly valuable, and our observation can contribute to a better understanding of differentiating between normal and abnormal early placental development.
PBF values were 104.9 ± 31.4 and 111.3 ± 25.9 ml/100g/min, respectively, at 16 weeks and 20 weeks for normal subjects. These are consistent but slightly lower than the reported PBF values measured by other ASL techniques.25,27,38 This is somewhat understandable, since our 3D pCASL sequence included the separation of the blood flow contributed from maternal and fetal sources and the 3D volumetric coverage of the placenta. The classical placenta perfusion rate was expected to be ~110 ml/100g/min, based on the estimated maternal blood supply of 600 ml/min and the mass of the placenta mass to be 550 g.25 However, there may exist a systematic difference between PBF and the classical perfusion rate since the maternal blood does not travel in capillaries through the placenta, but collects in pools or lobes and mixes with the tissue.25 The absolute flow rate includes many assumptions (modeling, blood T1, blood tissue fraction, labeling efficiency, etc), which may cause errors among different ASL techniques. However, these errors are generally systematic, less likely including a significant bias when comparing longitudinal changes and normal/pathology differences using the same technique.
Similar patterns of the spatial heterogeneity in the placenta have been previously observed25,27,38,39 at various weeks of gestation. Although the origin of the heterogeneity is not entirely understood, many assumed it to be related to the underlying vascular units, cotyledons of the placenta. We applied the binary segmentation algorithm to separate high blood flow regions from low blood flow regions based on the assumption that the placenta blood flow has a bimodal distribution, trying to separate. Further studies may be desirable to evaluate the origin of the heterogeneity or could include approaches without assuming the bimodal distribution, such as texture analysis when analyzing the spatial heterogeneity.
Our study contains a few limitations. First, the difference between normal and IPD subjects may be underpowered by the limited sample size of IPD (n = 15). IPD is defined as a collection of various conditions of placental insufficiency, where these conditions may be highly variable clinically. For example, SGA is commonly used as a proxy for IUGR, but a large proportion of SGA infants are not actually growth restricted but are either constitutionally small or small for physiologic reasons. Also, there exist differences in the pathology and clinical manifestations of early- and late-onset IUGR, but only a few studies have addressed early- and late-onset IUGR as separate conditions.37 Further investigation with a larger sample size of each condition would be useful to further understand the associations between perfusion-related imaging parameters and each condition. Second, the PBF calculation is sometimes limited by imaging artifacts from various sources of error, such as motion, amniotic fluid, subcutaneous fat, large vessels, and B0 inhomogeneity. We manually excluded these cases with such errors (n = 10) and an additional nine cases for hPBF due to inefficient labeling.40 These sources of error can be further eliminated with improved background suppression, fat saturation, and more efficient labeling techniques. Third is the limited volumetric coverage. We used a single-shot inner-volume 3D GRASE readout for 3D imaging acquisition to be able to achieve a total of eight slices (through-plane coverage was 2.4 cm). This is generally sufficient, particularly at early gestation, but may be not enough for special cases when the shape of the placenta is too curved, which inevitably limits spatial analysis of PBF. An improved volumetric coverage may also be desirable when late gestation MRI scans are needed. Further improvements may be necessary for 3D imaging acquisition techniques.
In conclusion, we derived four perfusion-related parameters, including placental volume, PBF, hPBF, and relative hPBF from the pseudocontinuous ASL measurements. The longitudinal analyses of the perfusion-related imaging parameters showed that the placental volume significantly changes between 16 and 20 weeks in normal subjects, indicating an overall development of the placenta and its associated increase of blood flow with advancing gestation. The high perfusion-related image parameters, hPBF and relative hPBF, for IPD were significantly decreased from normal pregnancy during early gestation, supporting the potential of serving as an imaging biomarker for predicting IPD.
Supplementary Material
Acknowledgments
Contract grant sponsor: National Institutes of Health (NIH); Contract grant number: U01-HD087221.
Footnotes
Conflict of Interest
The authors declare no conflicts of interest.
References
- 1.Roberts JM, Gammill HS. Preeclampsia: Recent insights. Hypertension 2005;1243–1249. [DOI] [PubMed] [Google Scholar]
- 2.McMaster MT, Zhou Y, Fisher SJ. Abnormal placentation and the syndrome of preeclampsia. Semin Nephrol 2004;24:540–547. [DOI] [PubMed] [Google Scholar]
- 3.Fisher SJ. The placental problem: Linking abnormal cytotrophoblast differentiation to the maternal symptoms of preeclampsia. Reprod Biol Endocrinol 2004;2:53. [DOI] [PMC free article] [PubMed] [Google Scholar]
- 4.Zhou Y, Gormley MJ, Hunkapiller NM, et al. Reversal of gene dysregulation in cultured cytotrophoblasts reveals possible causes of preeclampsia. J Clin Invest 2013;123:2862–2872. [DOI] [PMC free article] [PubMed] [Google Scholar]
- 5.Silasi M, Cohen B, Karumanchi SA, Rana S. Abnormal placentation, angiogenic factors, and the pathogenesis of preeclampsia. Obstet Gynecol Clin North Am 2010;37:239–253. [DOI] [PubMed] [Google Scholar]
- 6.Faye-Petersen OM. The placenta in preterm birth. J Clin Pathol 2008; 61:1261–1275. [DOI] [PubMed] [Google Scholar]
- 7.Regnault TRH, Galan HL, Parker TA, Anthony RV. Placental development in normal and compromised pregnancies—A review. Placenta 2002;23:S119–S129. [DOI] [PubMed] [Google Scholar]
- 8.Norwitz ER. Defective implantation and placentation: Laying the blueprint for pregnancy complications. Reprod Biomed Online 2007;14 (Spec No):101–109. [DOI] [PubMed] [Google Scholar]
- 9.Barker DJ, Larsen G, Osmond C, Thornburg KL, Kajantie E, Eriksson JG. The placental origins of sudden cardiac death. Int J Epidemiol 2012;41:1394–1399. [DOI] [PubMed] [Google Scholar]
- 10.Barker DJP, Thornburg KL. Placental programming of chronic diseases, cancer and lifespan: A review. Placenta 2013;34:841–845. [DOI] [PubMed] [Google Scholar]
- 11.Guttmacher AE, Maddox YT, Spong CY. The Human Placenta Project: Placental structure, development, and function in real time. Placenta 2014;35:303–304. [DOI] [PMC free article] [PubMed] [Google Scholar]
- 12.Ananth CV, Peltier MR, Chavez MR, Kirby RS, Getahun D, Vintzileos AM. Recurrence of ischemic placental disease. Obstet Gynecol 2007;110:128–133. [DOI] [PubMed] [Google Scholar]
- 13.Prefumo F, Sebire NJ, Thilaganathan B. Decreased endovascular trophoblast invasion in first trimester pregnancies with high-resistance uterine artery Doppler indices. Hum Reprod 2004;19:206–209. [DOI] [PubMed] [Google Scholar]
- 14.Matijevic R, Meekins JW, Walkinshaw SA, Neilson JP, McFadyen IR. Spiral artery blood flow in the central and peripheral areas of the placental bed in the second trimester. Obstet Gynecol 1995;86:289–292. [DOI] [PubMed] [Google Scholar]
- 15.Hsieh YY, Chang CC, Tsai HD, Lee CC, Tsai CH. Longitudinal Doppler sonographic measurements of vascular impedance in the central and peripheral spiral arteries throughout pregnancy. J Clin Ultrasound 2000;28:78–82. [DOI] [PubMed] [Google Scholar]
- 16.Schaaps J-P, Tsatsaris V, Goffin F, et al. Shunting the intervillous space: New concepts in human uteroplacental vascularization. Am J Obstet Gynecol 2005;192:323–332. [DOI] [PubMed] [Google Scholar]
- 17.Brosens I. A study of the spiral arteries of the decidua basalis in normotensive and hypertensive pregnancies. BJOG Int J Obstet Gynaecol 1964;71:222–230. [DOI] [PubMed] [Google Scholar]
- 18.Burton GJ, Woods AW, Jauniaux E, Kingdom JCP. Rheological and physiological consequences of conversion of the maternal spiral arteries for uteroplacental blood flow during human pregnancy. Placenta 2009;30:473–482. [DOI] [PMC free article] [PubMed] [Google Scholar]
- 19.Li S, Hoskins PR, Anderson T, McDicken WN. Measurement of mean velocity during pulsatile flow using time-averaged maximum frequency of Doppler ultrasound waveforms. Ultrasound Med Biol 1993;19: 105–113. [DOI] [PubMed] [Google Scholar]
- 20.Parry S, Sciscione A, Haas DM, et al. Role of early second-trimester uterine artery Doppler screening to predict small-for-gestational-age babies in nulliparous women. Am J Obstet Gynecol 2017;217: 594e1–594e10. [DOI] [PMC free article] [PubMed] [Google Scholar]
- 21.Chien PFW, Arnott N, Gordon A, Owen P, Khan KS. How useful is uterine artery Doppler flow velocimetry in the prediction of pre-eclampsia, intrauterine growth retardation and perinatal death? An overview. BJOG Int J Obstet Gynaecol 2000;107:196–208. [DOI] [PubMed] [Google Scholar]
- 22.Pongrojpaw D, Chanthasenanont A, Nanthakomon T, Pongrojpa D, Chanthasenanon A, Nanthakomo T. Second trimester uterine artery Doppler screening in prediction of adverse pregnancy outcome in high risk women. J Med Assoc Thai 2010;93(Suppl 7):S127–130. [PubMed] [Google Scholar]
- 23.Savasan ZA, Goncalves LF, Bahado-Singh RO. Second- and third-trimester biochemical and ultrasound markers predictive of ischemic placental disease. Semin Perinatol 2014;38:167–176. [DOI] [PubMed] [Google Scholar]
- 24.Alsop DC, Detre JA, Golay X, et al. Recommended implementation of arterial spin-labeled perfusion MRI for clinical applications: A consensus of the ISMRM perfusion study group and the European consortium for ASL in dementia. Magn Reson Med 2015;73:102–116. [DOI] [PMC free article] [PubMed] [Google Scholar]
- 25.Gowland PA, Francis ST, Duncan KR, et al. In vivo perfusion measurements in the human placenta using echo planar imaging at 0.5 T. Magn Reson Med 1998;40:467–473. [DOI] [PubMed] [Google Scholar]
- 26.Masselli G, Brunelli R, Bernieri M, et al. Arterial spin labelling in the human placenta: Mapping perfusion. RSNA 2014. [Google Scholar]
- 27.Zun Z, Zaharchuk G, Andescavage NN, Donofrio MT, Limperopoulos C. Non-invasive placental perfusion imaging in pregnancies complicated by fetal heart disease using velocity-selective arterial spin labeled MRI. Sci Rep 2017;7:16126. [DOI] [PMC free article] [PubMed] [Google Scholar]
- 28.Shao X, Liu D, Martin T, et al. Measuring human placental blood flow with multidelay 3D GRASE pseudocontinuous arterial spin labeling at 3T. J Magn Reson Imaging 2018;47:1667–1676. [DOI] [PMC free article] [PubMed] [Google Scholar]
- 29.American College of Obstetricians and Gynecologists, Task Force on Hypertension in Pregnancy. Hypertension in pregnancy. Obstet Gynecol 2013;122:1122–1131. [DOI] [PubMed] [Google Scholar]
- 30.Committee Opinion No 579. Obstet Gynecol 2013;122:1139–1140. [DOI] [PubMed] [Google Scholar]
- 31.Shao X, Wang Y, Moeller S, Wang DJJ. A constrained slice-dependent background suppression scheme for simultaneous multislice pseudocontinuous arterial spin labeling. Magn Reson Med 2018;79: 394–400. [DOI] [PMC free article] [PubMed] [Google Scholar]
- 32.Schneider CA, Rasband WS, Eliceiri KW. NIH Image to ImageJ: 25 years of image analysis. Nat Methods 2012;9:671–675. [DOI] [PMC free article] [PubMed] [Google Scholar]
- 33.Hunter JD. Matplotlib: A 2D graphics environment. Comput Sci Eng 2007;9:90–95. [Google Scholar]
- 34.McCallum WD, Williams CS, Napel S, Daigle RE. Fetal blood velocity waveforms. Am J Obstet Gynecol 1978;132:425–429. [DOI] [PubMed] [Google Scholar]
- 35.Otsu N. A threshold selection method from gray-level histograms. IEEE Trans Syst Man Cybernet 1979;9:62–66. [Google Scholar]
- 36.Langhoff L, Grønbeck L, von Huth S, et al. Placental growth during normal pregnancy — A magnetic resonance imaging study. Gynecol Obstet Invest 2017;82:462–467. [DOI] [PubMed] [Google Scholar]
- 37.Parker SE, Werler MM. Epidemiology of ischemic placental disease: A focus on preterm gestations. Semin Perinatol 2014;38:133–138. [DOI] [PMC free article] [PubMed] [Google Scholar]
- 38.Morris DM, Wright C, Dobbs MS, et al. Arterial spin labelling in the human placenta — Mapping perfusion. In: Proc 20th Annual Meeting ISMRM, Melbourne; 2012:570. [Google Scholar]
- 39.Sørensen A, Sinding M, Peters DA, et al. Placental oxygen transport estimated by the hyperoxic placental BOLD MRI response. Physiol Rep 2015;3:e12582. [DOI] [PMC free article] [PubMed] [Google Scholar]
- 40.Zhao L, Vidorreta M, Soman S, Detre JA, Alsop DC. Improving the robustness of pseudo-continuous arterial spin labeling to off-resonance and pulsatile flow velocity. Magn Reson Med 2016;78:1342–1351. [DOI] [PMC free article] [PubMed] [Google Scholar]
Associated Data
This section collects any data citations, data availability statements, or supplementary materials included in this article.


