

Summary
Pancreatic cancer is an aggressive malignancy with changes in the tumor microenvironment. Here, we demonstrate that PINK1 and PARK2 suppressed pancreatic tumorigenesis through control of mitochondrial iron-dependent immunometabolism. Using mouse models of spontaneous pancreatic cancer, we show that depletion of Pink1 and Park2 accelerates mutant Kras-driven pancreatic tumorigenesis. PINK1-PARK2 pathway-mediated degradation of SLC25A37 and SLC25A28 increases mitochondrial iron accumulation, which leads to the HIF1A-dependent Warburg effect and AIM2-dependent inflammasome activation in tumor cells. AIM2-mediated HMGB1 release further induces expression of CD274/PD-L1. Consequently, pharmacological administration of mitochondrial iron chelator, anti-HMGB1 antibody, or genetic depletion of Hif1a or Aim2 in pink1−/− and park2−/− mice confers protection against pancreatic tumorigenesis. Low PARK2 expression and high SLC25A37 and AIM2 expression are associated with poor prognosis in patients with pancreatic cancer. These findings suggest that disrupted mitochondrial iron homeostasis may contribute to cancer development and hence constitute a target for therapeutic intervention.
Introduction
Macroautophagy/autophagy is a conserved process of self-degradation that can be either nonselective or selective (Klionsky, 2007). One example of selective autophagy is the degradation of superfluous or damaged mitochondria, a process termed mitophagy. In mammalian cells, the mitochondrially-targeted protein PINK1 (PTEN induced putative kinase 1) and PRKN/PARK2 (parkin RBR E3 ubiquitin protein ligase) are critical mediators of mitophagy (Geisler et al., 2010). This PINK1-PARK2 pathway depends on the ubiquitination of mitochondrial outer membrane substrates and subsequent docking of autophagic cargo receptors to selectively remove mitochondria (Geisler et al., 2010). The mitophagy-independent function of PINK1 and PARK2 has also been implicated in the regulation of mitochondrial function and stress response (Voigt et al., 2016).
Iron is an element essential for cell growth, but excessive iron leads to the generation of reactive oxygen species (ROS) and oxidative injury. The acquisition, transport, and storage of iron are homeostatically regulated at both the systemic and organellar level. In addition to energy production, proper mitochondrial function is crucial in maintaining cellular iron homeostasis. Iron is transported to the mitochondrion for the synthesis of heme and the generation of iron-sulfur proteins through mitochondrial iron importers such as SLC25A37/mitoferrin-1 (solute carrier family 25 member 37) and SLC25A28/mitoferrin-2 (Paradkar et al., 2009; Shaw et al., 2006). Increased mitochondrial iron accumulation is implicated in human diseases such as chronic obstructive pulmonary disease and neurodegenerative disorders. However, little is known about the pathological role of mitochondrial iron in tumorigenesis.
In the present study, we used pink1−/− and park2−/− mice to examine the effects of the PINK1-PARK2 system on oncogenic Kras-driven pancreatic ductal adenocarcinoma (PDAC), one of the deadliest cancers worldwide. Loss of Pink1 or Park2 promotes oncogenic Kras-driven pancreatic tumorigenesis in mice. This Pink1 or Park2 deficiency-mediated pancreatic tumorigenesis requires activation of mitochondrial iron-dependent tumor immunometabolism.
Results
Pink1 and Park2 suppress oncogenic Kras-driven pancreatic tumorigenesis
To determine the role of PINK1 and PARK2 in PDAC, we created two transgenic murine strains (termed KCP1 and KCP2) by backcrossing pink1−/− or park2−/− null mice to the genetically engineered KC (Pdx1-Cre;KrasG12D/+) strain. These KCP1 and KCP2 mice exhibited shorter survival (Fig. 1A) and increased tumor invasion or metastasis to the liver and lung and PDAC compared to KC mice (Fig. 1B), indicating that Pink1 and Park2 suppress oncogenic Kras-driven pancreatic cancer development.
Figure 1. Pink1 or Park2 deficiency promotes Kras-driven pancreatic tumorigenesis.
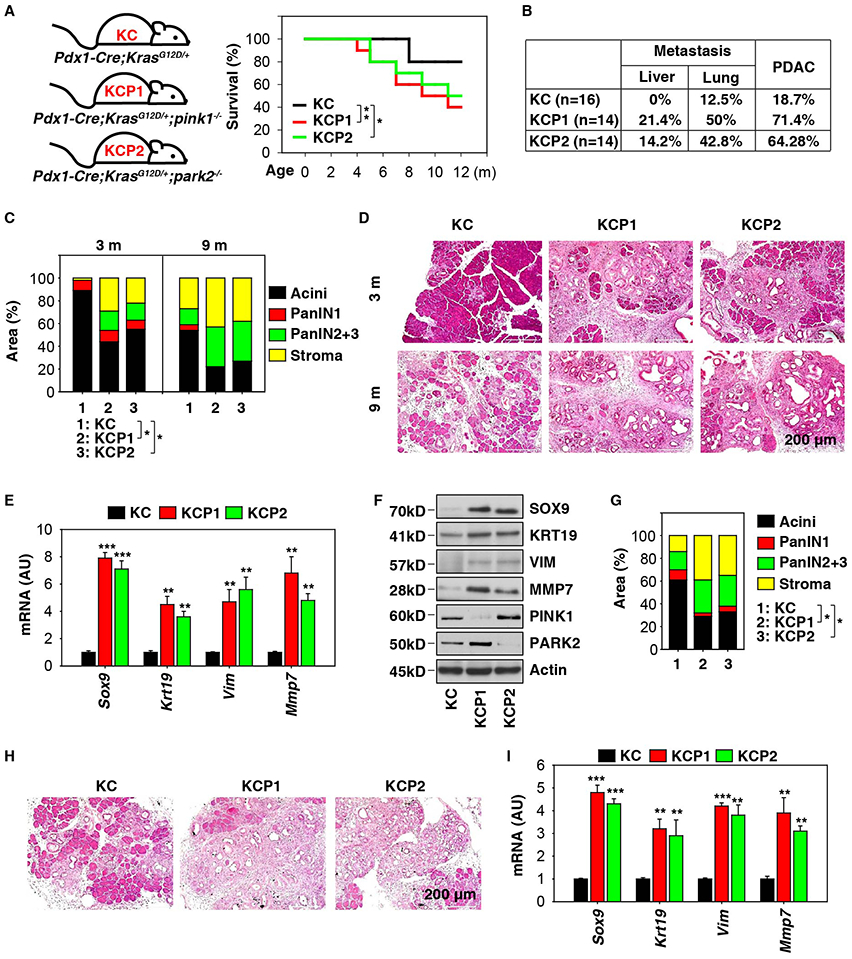
(A) Survival of KC, KCP1, and KCP2 mice at 12 months of age (n=20 mice/group, * p < 0.05, ** p < 0.01, log-rank test). (B) Incidence of tumor metastasis/invasion and PDAC in KC, KCP1, and KCP2 mice at 12 months of age. (C) Histological evaluation of pancreata in KC, KCP1, and KCP2 mice at three and nine months of age (n=5 mice/group, * p < 0.05, unpaired t-test, data are expressed as percentage of positive area). (D) A representative hematoxylin and eosin (H&E) stain of pancreas from indicated mice. (E) Q-PCR analysis of indicated gene expression in pancreata from KC, KCP1, and KCP2 mice at three months of age (n=3 mice/group, ** p < 0.01, *** p < 0.001 versus KC group, unpaired t-test, data are expressed as means ± s.e.m., AU, arbitrary units). (F) Western blot analysis of indicated protein expression in pancreata from KC, KCP1, and KCP2 mice at three months of age. (G) Histological evaluation of pancreata in KC, KCP1, and KCP2 mice in response to cerulein-induced pancreatitis for three weeks (n=5 mice/group, * p < 0.05, unpaired t-test, data are expressed as percentage of positive area). (H) A representative H&E stain of pancreas from indicated mice. (I) In parallel, Q-PCR analysis of indicated gene expression in pancreata from KC, KCP1, and KCP2 mice in response to cerulein-induced pancreatitis for three weeks (n=3 mice/group, ** p < 0.01, *** p < 0.001 versus KC group, unpaired t-test, data are expressed as means ± s.e.m., AU, arbitrary units).
Most PDAC precursor lesions are pancreatic intraepithelial neoplasias (PanINs). In line with previous reports (Hingorani et al., 2003), control KC mice displayed low grade PanINs (PanIN-1) at three months of age and high grade PanINs (PanIN-2 and −3) at nine months within otherwise normal pancreatic acinar tissue (Fig. 1C and 1D). In contrast, pancreata from KCP1 or KCP2 mice exhibited increased high grade PanINs and decreased normal pancreatic acinar tissue (Fig. 1C and 1D). KCP1 and KCP2 also displayed an increased stromal response (Fig. 1C and 1D), a reason for its aggressive tumor biology.
We next assayed the expression of molecular markers of acinar-to-ductal metaplasia (e.g., SOX9 [sex determining region Y-box 9]), ductal lesions (e.g., KRT19/CK19 [keratin 19]), stromal response (e.g., VIM [vimentin]), and invasion (e.g., MMP7 [matrix metallopeptidase 7]) in KC, KCP1, and KCP2 mice at three months of age. The mRNA (Fig. 1E) and protein expression (Fig. 1F) of SOX9, KRT19, VIM, and MMP7 in the pancreas were increased in KCP1 and KCP2 mice compared to KC mice.
We further compared the phenotype of tumor initiation in KC, KCP1, and KCP2 mice at six weeks of age in response to cerulein-induced pancreatitis. Administration of cerulein accelerates PanIN development and stromal response in KC mice at day 21 (Fig. 1G and 1H). Depletion of Pink1 or Park2 led to increased high grade PanINs and stromal responses and resulted in a loss of normal pancreatic acinar tissue after cerulein treatment (Fig. 1G and 1H). Accordingly, the mRNA expression of Sox9, Krt19, Vim, and Mmp7 in the pancreas was increased in KCP1 and KCP2 mice following cerulein treatment (Fig. 1I). These observations further support our hypothesis that Pink1 or Park2 deficiency promotes oncogenic Kras-driven pancreatic tumorigenesis.
Mitochondrial iron accumulation contributes to pancreatic tumorigenesis
Oxidative stress and the resulting lipid peroxidation are associated with tumor progression. Loss of Pink1 or Park2 increased pancreatic malondialdehyde (MDA, an end product of lipid peroxidation) levels in KCP1 or KCP2 mice at two to nine months of age, especially at three months of age (Fig. S1A). Lipid peroxidation-derived pancreatic 4-hydroxynonenal (4-HNE) production was also elevated in KCP1 or KCP2 mice (Fig. S1A). In contrast, glutathione (GSH), a master antioxidant in tissue, was decreased in pancreata from KCP1 or KCP2 mice (Fig. S1A). These findings suggest that lipid peroxidation is increased in KCP1 and KCP2 mice.
The Fenton reaction involves the creation of free radicals by metal ions. The levels of iron (Fig. 2A), but not zinc or copper (Fig. S1A), were increased in pancreata from KCP1 and KCP2 mice compared to those from KC mice. Concomitantly, serum iron levels were increased in KCP1 and KCP2 mice (Fig. 2B). KCP1 and KCP2 mice exhibited higher pancreatic mitochondrial iron loading compared to cytosolic iron levels (Fig. 2C). KCP1 and KCP2 mice also displayed increased MDA, 4-HNE, and iron and decreased GSH in pancreatic acinar cells (Fig. S1B and S1C).
Figure 2. Mitochondrial iron accumulation promotes pancreatic tumorigenesis.
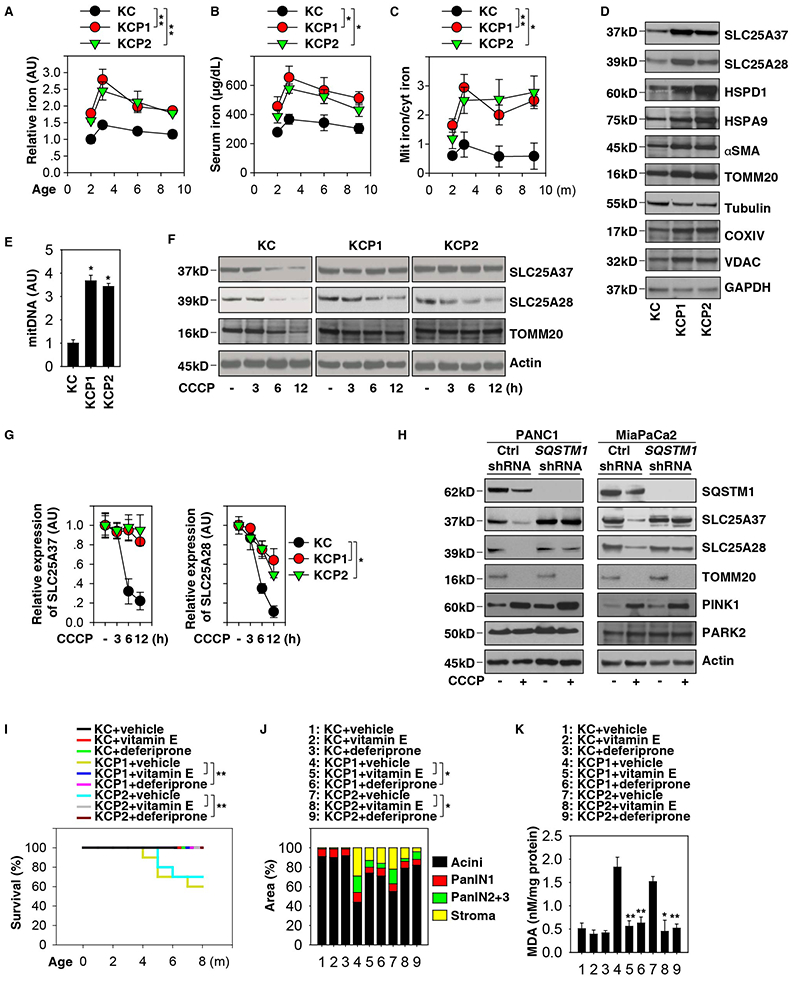
(A) Analysis of iron levels in pancreata from KC, KCP1, and KCP2 mice (n=3 mice/group, ** p < 0.01, ANOVA test, data are expressed as means ± s.e.m., AU, arbitrary units). (B) Analysis of serum iron levels from KC, KCP1, and KCP2 mice (n=3 mice/group, * p < 0.05, ANOVA test, data are expressed as means ± s.e.m.). (C) Analysis of the ratio of mitochondrial iron to cytosolic iron in pancreata from KC, KCP1, and KCP2 mice (n=3 mice/group, * p < 0.05, ** p < 0.01, ANOVA test, data are expressed as means ± s.e.m.). (D) Western blot analysis of indicated protein expression in pancreata from KC, KCP1, and KCP2 mice at three months of age. (E) In parallel, circulating mitochondrial DNA (mitDNA) were assayed (n=5 mice/group, *p < 0.05 versus KC mice, t test, data are expressed as means ± s.e.m., AU, arbitrary units.). (F) Western blot analysis of SLC25A37 and SLC25A28 expression in primary indicated PDAC cells following treatment with CCCP (10 μM) for three to 12 h. (G) Semi-quantification of SLC25A37 and SLC25A28 protein expression in primary indicated PDAC cells following treatment with CCCP (10 μM) for three to 12 h (n=3 mice/group, *p < 0.05, ANOVA test, data are expressed as means ± s.e.m., AU, arbitrary units). (H) The effect of knockdown of SQSTM1 on CCCP (10 μM, 12 h)-induced SLC25A37 and SLC25A28 expression in the indicated human PDAC cell lines. (I) Kaplan-Meier survival analysis was performed for KC or KCP1 or KCP2 mice with or without vitamin E (100 mg/kg p.o., twice per week, started at four weeks of age for eight weeks) or deferiprone (50 mg/kg p.o., twice per week, started at four weeks of age for eight weeks) (n=10-20 mice/group, ** p < 0.01, log-rank test). (J) Histological evaluation of pancreata at three months of age (n=5 mice/group, * p < 0.05, unpaired t-test, data are expressed as percentage of positive area). (K) Pancreatic MDA levels at three months of age (n=3 mice/group, * p < 0.05, ** p < 0.01, unpaired t-test, data are expressed as means ± s.e.m.). See also Figures S1, S2, S3 and S4.
To elucidate the molecular mechanisms of Pink1 or Park2 deficiency in promoting mitochondrial iron accumulation, the protein expression of mitochondrial iron importers (SLC25A37 and SLC25A28), mitochondrial stress makers (HSPD1 [heat shock protein family D (Hsp60) member 1] and HSPA9 [heat shock protein family A (Hsp70) member 9]), and the marker for stromal cells (αSMA [alpha smooth muscle actin]) were assayed using western blot. These proteins in the pancreas were increased in KCP1 and KCP2 mice (Fig. 2D). Consistent with the notion that Pink1 and Park2 play roles in reducing mitochondrial injury, circulating mitochondrial DNA (Fig. 2E) and mitophagy deficiency-associated markers (VDAC [voltage dependent anion channel], COX4I1/COXIV [cytochrome C oxidase subunit 4I1], and TOMM20 [translocase of outer mitochondrial membrane 20]) were increased in KCP1 and KCP2 mice (Fig. 2D). Furthermore, treatment with carbonyl cyanide m-chlorophenylhydrazone (CCCP), an inducer of mitochondrial depolarization, decreased the protein levels of SLC25A37, SLC25A28, and TOMM20 in PDAC cells from KC mice (Fig. 2F and 2G). This process was inhibited by the loss of Pink1 or Park2 in PDAC cells from KCP1 and KCP2 mice (Fig. 2F and 2G). In contrast, the mRNA levels of Slc25a37 and Slc25a28 were not changed by Pink1 or Park2 (Fig. S1D). KCP1 and KCP2 cells also exhibited an increase in fragmented mitochondria and mitochondrial protein ATP synthase beta fluorescence signals (Fig. S2). Thus, the PINK1-PARK2 pathway protects against mitochondrial injury in PDAC cells.
NCOA4 (nuclear receptor coactivator 4) is a selective cargo receptor for the autophagic turnover of ferritin (Mancias et al., 2014). BNIP3L/NIX (BCL2 interacting protein 3 like) contributes to mitophagy as an alternative pathway (Youle and Narendra, 2011). Knockdown of NCOA4 or BNIP3L failed to block CCCP-induced degradation of SLC25A37, SLC25A28, and TOMM20 (Fig. S3A), loss of mitochondrial DNA (Fig. S3B), and colocalization between MAP1LC3B/LC3B (microtubule associated protein 1 light chain 3 beta) and mitochondria (Fig. S3C) in the human PDAC cell line PANC1. In contrast, knockdown of SQSTM1/p62 (sequestosome 1) blocked CCCP-induced SLC25A37, SLC25A28 (but not TOMM20) degradation in human PDAC cell lines (PANC1 and MiaPaCa2) (Fig. 2H). CCCP-induced loss of mitochondrial DNA contents (Fig. S3B) and colocalization between MAP1LC3B and mitochondria (Fig. S3C) was not affected by SQSTM1-shRNA, indicating that SQSTM1 is dispensable for PAKR2-mediated mitophagic degradation. Immunoprecipitation analysis found that SLC25A37 and SLC25A28 bound SQSTM1, but not other cargo receptors (NCOA4, OTPN [optineurin] and CALCOCO2/NDP52 [calcium binding and coiled-coil domain 2]), in CCCP-induced mitochondrial injury (Fig. S3D). Of note, CCCP-induced SLC25A37/SLC25A28-SQSTM1 complex was mainly observed in cytoplasmic fractions, but not in mitochondrial fractions (Fig. S3E).
Activation of the ubiquitin-proteasome system is required for the degradation of mitochondrial outer membrane proteins such as TOMM20 during PARK2-mediated mitophagy (Chan et al., 2011). The proteasome inhibitor epoxomicin prevented CCCP-induced TOMM20 (but not SLC25A37 and SLC25A28) degradation in PANC1 cells (Fig. S3F). In contrast, administration of the autophagy inhibitor bafilomycin A1 (Fig. S3G) or knockdown of the core autophagy driver ATG5 suppressed CCCP-induced SLC25A37 and SLC25A28 (but not TOMM20) degradation in PANC1 cells (Fig. S3H).
To determine whether mitochondrial iron accumulation contributes to pancreatic tumorigenesis, we treated KC, KCP1 and KCP2 mice with vitamin E (a lipophilic peroxyl radical scavenger) or deferiprone (a mitochondrial iron chelator). Both vitamin E and deferiprone prolonged the survival of KCP1 and KCP2 mice (Fig. 2I) as they decreased the formation of pancreatic lesions and the desmoplastic response (Fig. 2J and S4A), increased normal acinar structures (Fig. 2J and S4A), and reduced pancreatic MDA levels (Fig. 2K) at three months of age. In contrast, vitamin E or deferiprone had no significant effects on KC mice (Fig. 2I-K). These data provide evidence that mitochondrial iron-dependent oxidative stress promotes pancreatic tumorigenesis in KCP1 or KCP2 mice.
Mitochondrial iron mediates the Warburg effect in pancreatic tumorigenesis
The best-known metabolic abnormality in cancer cells is the Warburg effect (also termed aerobic glycolysis), which results in exacerbated glycolysis, even in the presence of oxygen. We therefore investigated the potential impact of mitochondrial iron accumulation on the Warburg effect. Lactate is the end product of glucose metabolism via glycolysis. Indeed, the lactate levels in serum (Fig. 3A) or pancreas (Fig. 3B) were increased in KCP1 and KCP2 mice. Serum glucose, glucagon, and insulin levels were similar in KC, KCP1, and KCP2 mice (Fig. S1A), although previous reports show that autophagy plays a role in sustaining pancreatic β cell mass or function in diabetes (Watada and Fujitani, 2015). Furthermore, treatment with deferiprone and vitamin E reduced lactate levels in serum (Fig. 3C) and pancreatic tissue (Fig. 3D) from KCP1 and KCP2 mice.
Figure 3. Mitochondrial iron mediates the Warburg effect in pancreatic tumorigenesis.
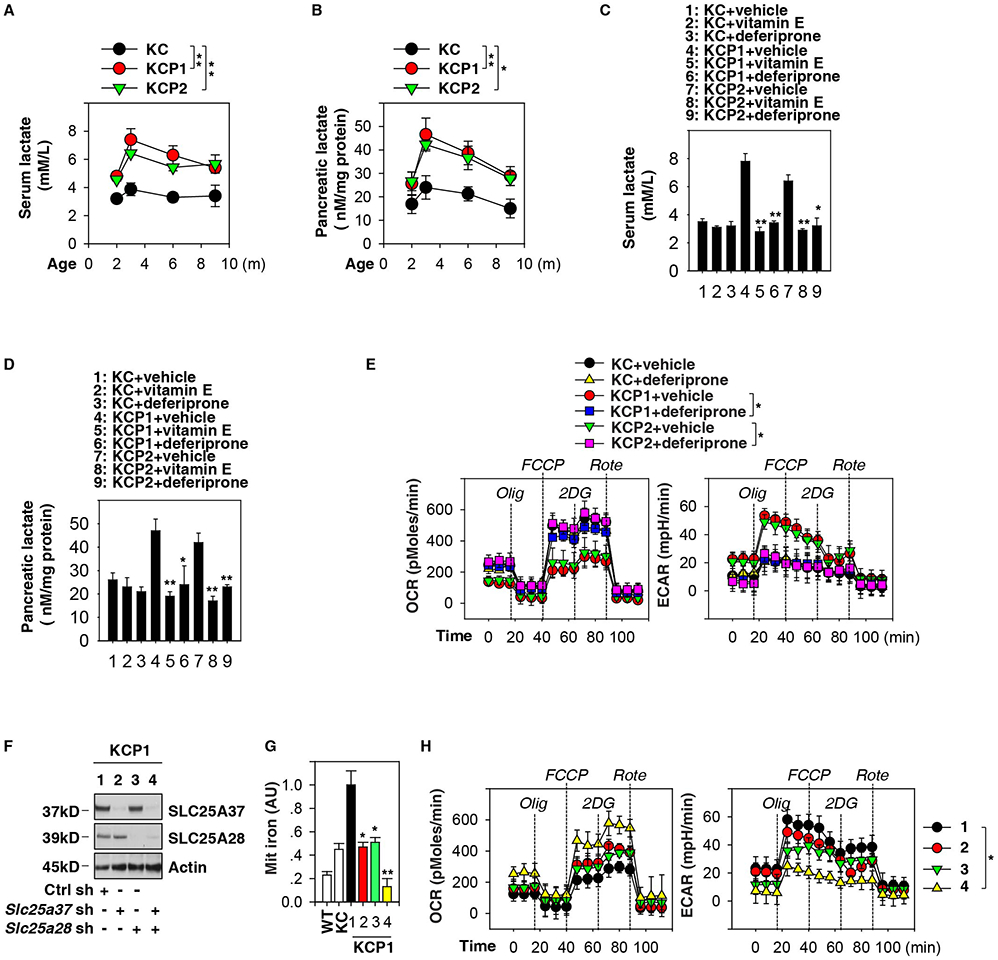
(A) Analysis of serum lactate levels in KC, KCP1, and KCP2 mice (n=3 mice/group, ** p < 0.01, ANOVA test, data are expressed as means ± s.e.m.). (B) Analysis of lactate levels in pancreata in KC, KCP1, and KCP2 mice (n=3 mice/group, * p < 0.05, ** p < 0.01, ANOVA test, data are expressed as means ± s.e.m.). (C) Analysis of serum lactate levels in KC, KCP1 and KCP2 mice with or without vitamin E or deferiprone treatment at three months of age (n=3 mice/group, * p < 0.05, ** p < 0.01 versus vehicle group, unpaired t-test, data are expressed as means ± s.e.m.). (D) Analysis of lactate levels in pancreata in KC, KCP1 and KCP2 mice with or without vitamin E or deferiprone treatment at three months of age (n=3 mice/group, * p < 0.05, ** p < 0.01 versus vehicle group, unpaired t-test, data are expressed as means ± s.e.m.). (E) Indicated PDAC cells were pretreated with deferiprone (100 μM) for 1 h and then treated with oligomycin (“Olig”, 1 μM), carbonyl cyanide-4-(trifluoromethoxy)phenylhydrazone (“FCCP”, 0.3 μM), 2-deoxy-D-glucose (“2DG”, 100 mM), and rotenone (“Rote”, 1 μM) for indicated times. ECAR and OCR were assayed using the Seahorse Bioscience Extracellular Flux Analyzer (n=3, * p < 0.05, ANOVA test, data are expressed as means ± s.e.m.). (F) Western blot analysis of SLC25A37 and SLC25A28 expression in indicated PDAC cells after knockdown of SLC25A37 and SLC25A28. (G) Knockdown of SLC25A37 and SLC25A28 reduced mitochondrial iron levels in PDAC cells from KCP1 mice at three months of age (n=3, * p < 0.05, ** p < 0.01 versus control shRNA group, unpaired t-test, data are expressed as means ± s.e.m., AU, arbitrary units.). (H) Analysis of ECAR and OCR in PDAC cells from KCP1 mice with or without knockdown of SLC25A37 and SLC25A28 (n=3, * p < 0.05, ANOVA test, data are expressed as means ± s.e.m.).
We further monitored the extracellular acidification rate (ECAR, an indicator of glycolysis) and oxygen consumption rate (OCR, an indicator of oxidative phosphorylation). PDAC cells from KCP1 and KCP2 mice exhibited increased ECAR and decreased OCR compared to PDAC cells from KC mice (Fig. 3E). This sign of an exacerbated Warburg phenotype linked to Pink1 or Park2 deficiency was corrected by deferiprone pretreatment (Fig. 3E). Consistently, depletion of Slc25a37 and Slc25a28 by RNAi in KCP1 PDAC cells (Fig. 3F) restored mitochondrial iron to normal wild type levels (Fig. 3G) and reversed the Warburg effect (Fig. 3H). Altogether, these metabolic analyses indicate that mitochondrial iron overload contributes to the Warburg effect in Pink1- or Park2-defective PDAC cells.
HIF1A is required for the Warburg effect in pancreatic tumorigenesis in KCP1 and KCP2 mice
Compared with normal cells, aerobic glycolysis is accelerated in cancer cells by preferential expression of glucose transporters (e.g., SLC2A1/glucose transporter 1) and enzyme isoforms (e.g., HK2 [hexokinase 2], ALDOA [aldolase A, fructose-bisphosphate], and LDHA [lactate dehydrogenase A]) that drive glucose flux in a way that satisfies the anabolic demands of neoplastic cells (Hay, 2016). The mRNAs coding for Slc2a1, Hk2, Aldoa, and Ldha were all upregulated in the pancreata of KCP1 or KCP2 mice (Fig. 4A). In contrast, deferiprone treatment reduced mRNA levels of these genes in pancreata from KCP1 and KCP2 mice, but not KC mice (Fig. 4A). Knockdown of Slc25a37 and Slc25a28 similarly decreased the Slc2a1, Hk2, Aldoa, and Ldha mRNAs in PDAC cells from KCP1 mice (Fig. 4B). Thus, changes in the expression of glycolysis-relevant genes may explain the mechanisms by which mitochondrial iron accumulation contributes to the Warburg effect.
Figure 4. HIF1A is required for the Warburg effect in pancreatic tumorigenesis.
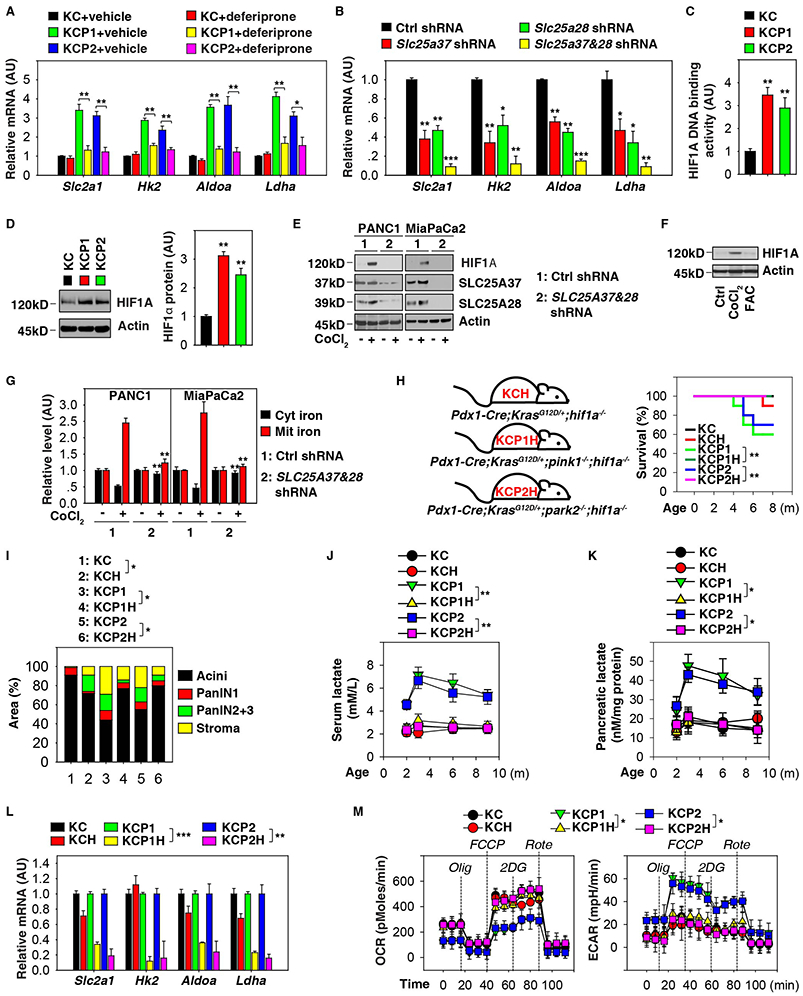
(A) Analysis of the expression of indicated genes in pancreata from KC, KCP1, and KCP2 mice with or without deferiprone treatment at three months of age (n=3 mice/group, * p < 0.05, ** p < 0.01, unpaired t-test, data are expressed as means ± s.e.m., AU, arbitrary units.). (B) Analysis of expression of indicated genes in PDAC cells from KCP1 mice with or without knockdown of SLC25A37 and SLC25A28 (n=3/group, * p < 0.05, ** p < 0.01, *** p < 0.001 versus control shRNA group, unpaired t-test, data are expressed as means ± s.e.m., AU, arbitrary units.). (C) Analysis of HIF1A DNA binding activity in pancreata from KC, KCP1, and KCP2 mice at three months of age (n=3 mice/group, ** p< 0.01 versus KC group, unpaired t-test, data are expressed as means ± s.e.m., AU, arbitrary units.). (D) Analysis of HIF1A protein expression in pancreata from KC, KCP1, and KCP2 mice at three months of age (n=3 mice/group, ** p< 0.01 versus KC group, unpaired t-test, data are expressed as means ± s.e.m., AU, arbitrary units). (E) Knockdown of SLC25A37 and SLC25A28 limited CoCl2 (5 μM, 24 h)-induced HIF1A expression in human PDAC cell lines. (F) Western blot analysis of HIF1A expression in PANC1 cells following treatment with CoCl2 (5 μM) or ferric ammonium citrate (“FAC”, 10 μM) for 24 h. (G) Analysis of iron levels in the mitochondria or cytoplasm in the indicated human PDAC cell lines with or without CoCl2 (5 μM, 24 h) treatment (n=3, ** p< 0.01 versus control shRNA group, unpaired t-test, data are expressed as means ± s.e.m., AU, arbitrary units). (H) Kaplan-Meier survival analysis was performed with the indicated mice (n=10-20 mice/group, ** p < 0.01, log-rank test). (I) Histological evaluation of pancreata at three months of age (n=5 mice/group, * p < 0.05, unpaired t-test, data are expressed as percentage of positive area). (J) Analysis of serum lactate levels in indicated mice (n=3 mice/group, ** p < 0.01, ANOVA test, data are expressed as means ± s.e.m.). (K) Analysis of lactate levels in pancreata in indicated mice (n=3 mice/group, * p < 0.05, ANOVA test, data are expressed as means ± s.e.m.). (L) Analysis of the expression of indicated genes in pancreata from indicated mice at three months of age (n=3 mice/group, ** p < 0.01, *** p < 0.001, unpaired t-test, data are expressed as means ± s.e.m., AU, arbitrary units.). (M) Analysis of ECAR and OCR in PDAC cells from indicated mice at three months of age (n=3, * p < 0.05, ANOVA test, data are expressed as means ± s.e.m.). See also Figure S4.
HIF1A (hypoxia inducible factor 1, alpha subunit) is a transcription factor involved in the control of glycolysis-associated gene expression in tumor metabolism. HIF1A DNA binding activity (Fig. 4C) and HIF1A protein expression (Fig. 4D) was increased in pancreata from KCP1 or KCP2 mice. In addition, cobalt (II) chloride (CoCl2, a chemical hypoxia mimetic)-induced HIF1A expression was diminished by knockdown of SLC25A37 and SLC25A28 in human PDAC cell lines, indicating that mitochondrial iron accumulation contributes to HIF1A activation (Fig. 4E). Unlike CoCl2, exogenous iron (ferric ammonium citrate) did not induce HIF1A expression in PANC1 cells (Fig. 4F). It should be noted that cytosolic iron promotes HIF1A degradation (Peyssonnaux et al., 2008). Accordingly, knockdown of SLC25A37 and SLC25A28 prevented CoCl2-induced iron transport from the cytosol to the mitochondria in human PDAC cell lines (Fig. 4G). Thus, the balance between cytosolic and mitochondrial iron levels might determine HIF1A protein stability.
HIF1A has been implicated in tumor progression as well as in tumor suppression, depending on tumor type and context (Lee et al., 2016; Semenza, 2013). Knockout of Hif1a in KC mice (Pdx1-Cre;KrasG12D/+;hif1a −/−, termed KCH mice) mildly increased animal death (Fig. 4H) and the formation of pancreatic lesions (Fig. 4I). In contrast, knockout of Hif1a in KCP1 (Pdx1-Cre;KrasG12D/+;pink1−/−;hif1a −/−, termed KCP1H mice) or KCP2 mice (Pdx1-Cre;KrasG12D/+;park2−/−;hif1a−/−, termed KCP2H mice) retarded the death of the animals (Fig. 4H) and attenuated the formation of pancreatic lesions (Fig. 4I and S4B). HIF1A depletion in KCP1 or KCP2 mice was also associated with decreased lactate concentrations in pancreatic tissue and the serum (Fig. 4J and 4K), as well as reduced local expression of Slc2a1, Hk2, Aldoa, and Ldha mRNAs (Fig. 4L). Moreover, PDAC cells from KCP1H and KCP2H mice diminished ECAR and augmented OCR of PDAC cells from KCP1 and KCP2 mice (Fig. 4M). In contrast, the phenotype difference between KC and KCH mice in lactate production, expression of glycolysis-relevant genes, OCR, and ECAR was not significant (Fig. 4J-4M). These findings indicate that HIF1A-mediated metabolic reprogramming may specifically contribute to pancreatic tumorigenesis in KCP1 and KCP2 mice.
AIM2 inflammasome contributes to pancreatic tumorigenesis in KCP1 and KCP2 mice
We next sought to define the mechanism of action of metabolic reprogramming in Pink1 or Park2 deficiency-associated pancreatic tumorigenesis. We focused on inflammasome activation because the serum levels of inflammasome cytokines such as IL1B (interleukin 1 beta), IL18, and HMGB1 (high mobility group box 1) were elevated in KCP1 and KCP2 mice (Fig. 5A). Treatment with deferiprone or Hif1a depletion lowered the circulating levels of IL1B, IL18, and HMGB1, but not TNF (tumor necrosis factor) and IL10 in KCP1 and KCP2 mice (Fig. 5A).
Figure 5. AIM2 inflammasome contributes to pancreatic tumorigenesis.
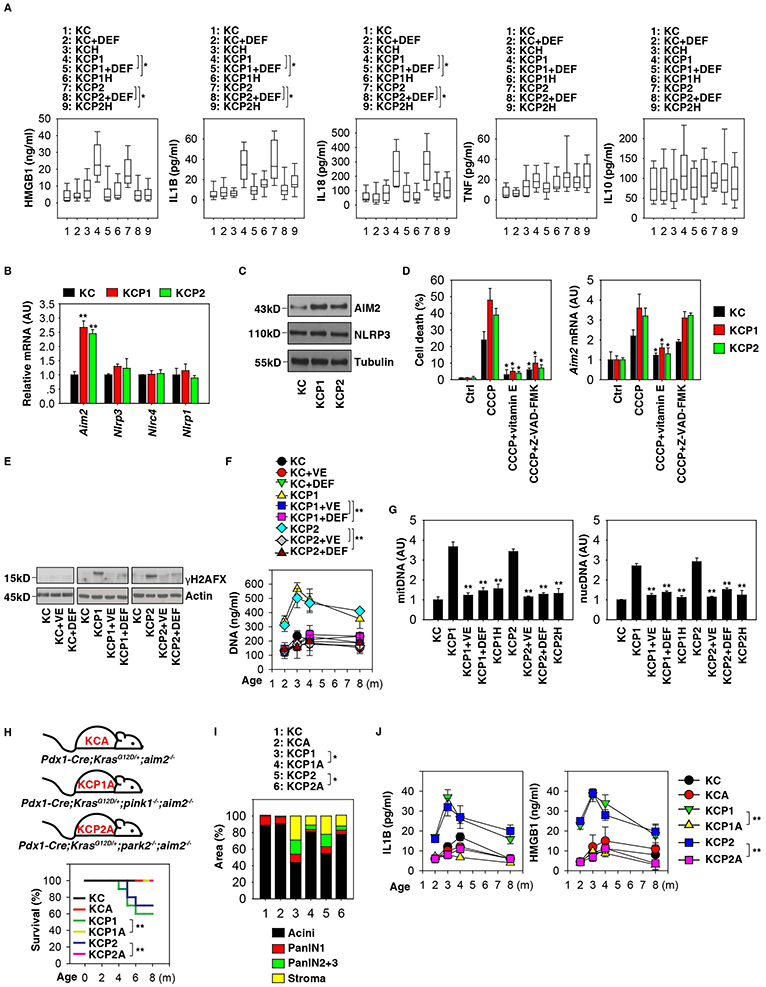
(A) Analysis of cytokines in serum in the indicated mice with or without deferiprone (“DEF”) treatment at three months of age (n=10 mice/group, * p < 0.05, unpaired t-test, data are expressed as median value [black line], interquartile range [box], and minimum and maximum of all data [black line]). (B) Analysis of expression of the indicated genes in pancreata from in KC, KCP1, and KCP2 mice at three months of age (n=3 mice/group, ** p< 0.01 versus KC group, unpaired t-test, data are expressed as means ± s.e.m., AU, arbitrary units.). (C) Analysis of the expression of indicated proteins in pancreata from in KC, KCP1, and KCP2 mice at three months of age. (D) PDAC cells from KC, KCP1, or KCP2 mice were treated with CCCP (10 μM) in the absence or presence of vitamin E (50 μM) or Z-VAD-FMK (20 μM) for 24 h, and the levels of cell death and Aim2 mRNA were assayed by CCK-8 kit and Q-PCR, respectively (n=3, * p < 0.05 versus CCCP group, unpaired t-test, data are expressed as means ± s.e.m., AU, arbitrary units.) (E) Analysis of pancreatic γH2AFX expression from KC, KCP1, and KCP2 mice with or without vitamin E (“VE”) or deferiprone (“DEF”) treatment at indicated ages. (F) Analysis of serum DNA levels from KC, KCP1, and KCP2 mice with or without vitamin E (“VE”) or deferiprone (“DEF”) treatment at indicated ages (n=3 mice/group, ** p < 0.01, unpaired t-test, data are expressed as means ± s.e.m.). (G) Analysis of indicated DNA levels in KC, KCP1, KCP2, KCP1H, and KCP2H mice with or without vitamin E (“VE”) or deferiprone (“DEF”) treatment at three months of age (n=5 mice/group, ** p < 0.01, unpaired t-test versus KCP1 or KCP2 group, data are expressed as means ± s.e.m.). (H) Kaplan-Meier survival analysis was performed with the indicated mice (n=10-20 mice/group, ** p < 0.01, log-rank test). (I) Histological evaluation of pancreata at three months of age (n=5 mice/group, * p < 0.05, unpaired t-test, data are expressed as percentage of positive area). (J) Analysis of the indicated serum cytokine levels in mice (n=3 mice/group, ** p < 0.01, ANOVA test, data are expressed as means ± s.e.m.). See also Figures S4 and S5.
To date, four major inflammasomes have been characterized to be structured around distinct core proteins, namely, NLRP1 (NLR family, pyrin domain containing 1), NLRP3 (NLR family, pyrin domain containing 3), NLRC4 (NLR family, CARD domain containing 4), and AIM2 (absent in melanoma 2). We previously demonstrated that, in bacterial infection, defective mitophagy due to PINK1 or PARK2 loss causes activation of the NLRP3 inflammasome (Kang et al., 2016b). Interestingly, major upregulation of Aim2 (but not Nlrp3, Nlrc4, or Nlrp1) mRNA (Fig. 5B) and protein (Fig. 5C) in the pancreas was observed in KCP1 and KCP2 mice, suggesting that, in the context of Kras-induced PDAC, another pathway may link Pink1 or Park2 deficiency to inflammasome activation.
We next addressed the impact of oxidative stress and cell death on the regulation of AIM2 expression. Loss of Pink1 or Park2 promoted CCCP-induced cell death and Aim2 mRNA expression in PDAC cells (Fig. 5D). The pan-caspase inhibitor Z-VAD-FMK inhibited CCCP-induced cell death, but not Aim2 mRNA expression (Fig. 5D). In contrast, vitamin E blocked CCCP-induced both cell death and Aim2 mRNA expression (Fig. 5D). These findings indicate that AIM2 expression is regulated by oxidative stress, but not cell death.
The AIM2 inflammasome is usually activated by free cytoplasmic DNA. Consistently, we observed that the expression of γH2AFX (a marker of DNA damage) is increased in the pancreas from KCP1 or KCP2 mice (Fig. 5E). Moreover, serum DNA levels (Fig. 5F) including mitDNA and nucDNA (Fig. 5G), were increased in KCP1 and KCP2 mice compared to KC mice. These processes were inhibited by treatment with deferiprone or vitamin E (Fig. 5E-5G). Circulating mitDNA and nucDNA was also reduced in KCP1A1 and KCP1A2 mice (Fig. 5G), supporting the idea that HIF1A regulates the DNA damage response in the hypoxic tumor microenvironment.
To determine the direct contribution of mitochondrial iron to AIM2 inflammasome activation, we treated PDAC cells in vitro with a classical AIM2 agonist, poly(dA:dT). Compared with KC cells, poly(dA:dT)-induced IL1B release was increased in KCP1 and KCP2 cells (Fig. S5A). This effect was inhibited by treatment with deferiprone, vitamin E, or the pan-caspase inhibitor Z-VAD-FMK (Fig. S5A). Knockdown of Slc25a37 and Slc25a28 or depletion of Hif1a inhibited poly(dA:dT)-induced IL1B release from KCP1 cells (Fig. S5B). These findings support the hypothesis that mitochondrial iron contributes to AIM2 inflammasome activation in PDAC cells.
To examine whether the AIM2 inflammasome contributes to pancreatic tumorigenesis, we next generated Pdx1-Cre;KrasG12D/+;aim2−/− (termed KCA), Pdx1-Cre;KrasG12D/+;pink1−/−;aim2−/− (termed KCP1A), and Pdx1-Cre;KrasG12D/+;park2−/−;aim2−/− (termed KCP2A) mice. Knockout of Aim2 in KCP1A and KCP2A mice avoided premature death of the animals (Fig. 5H) and reduced pancreatic neoplasia and stromal responses (Fig. 5I and S4B), as it favored the maintenance of normal acinar structures (Fig. 5I and S4B). Aim2 knockout also decreased serum IL1B and HMGB1 levels in KCP1A and KCP2A mice (Fig. 5J). In contrast, Aim2 knockout did not significantly change these phenotypes in KCA mice compared to KC mice (Fig. 5H-5J). Collectively, these data demonstrate that AIM2 inflammasome activation contributes to pancreatic tumorigenesis in KCP1 and KCP2 mice.
HMGB1 promotes upregulation of the immune checkpoint protein CD274 in pancreatic tumorigenesis
To further investigate the function of the AIM2 inflammasome in controlling pancreatic tumorigenesis, we treated KCP1 and KCP2 mice with specific antibodies to neutralize IL1B, IL18, or HMGB1. These in vivo studies revealed that blocking HMGB1 activity prolonged animal survival (Fig. 6A), reduced neoplastic lesions and the stromal response (Fig. 6B and S4C), and increased normal acinar structures in the pancreas (Fig. 6B and S4C). In contrast, blocking IL1B or IL18 activity did not affect the course of the disease in KCP1 and KCP2 mice (Fig. 6A, 6B, and S4C). Blocking HMGB1 or IL1B or IL18 activity did not affect the course of the disease in KC mice (Fig. 6A and 6B).
Figure 6. HMGB1 promotes immune checkpoint CD274 upregulation in pancreatic tumorigenesis.
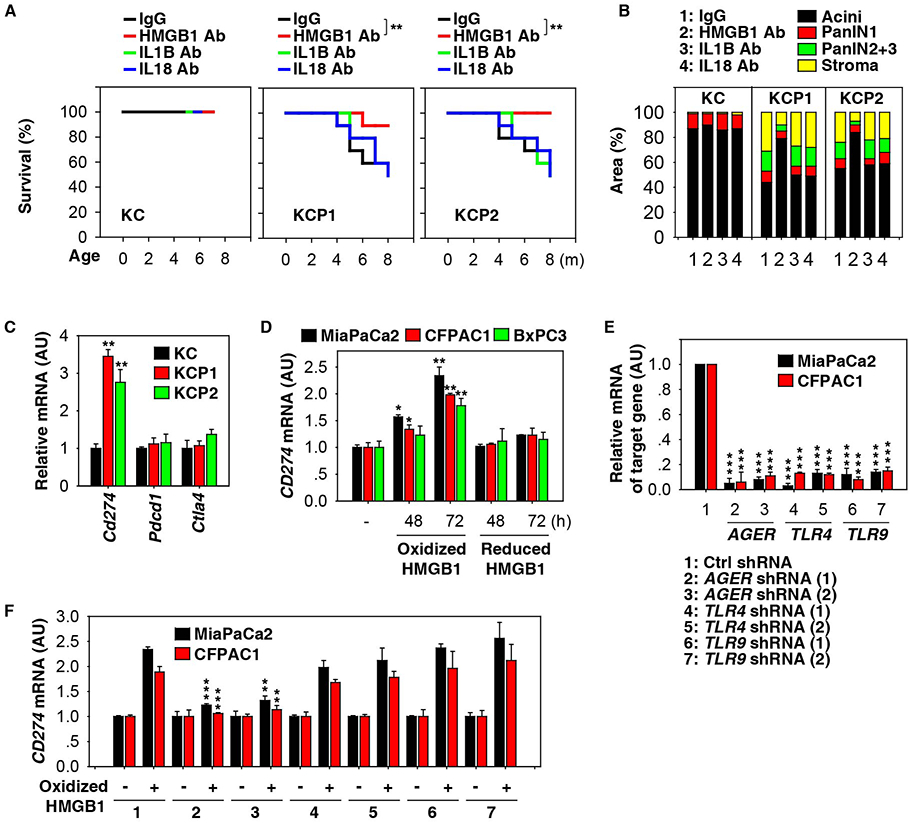
(A) Kaplan-Meier survival analysis was performed with the indicated mice (n=20 mice/group, ** p < 0.01, log-rank test). (B) Histological evaluation of pancreata at three months of age (n=5 mice/group, * p < 0.05, unpaired t-test, data are expressed as percentage of positive area). (C) Analysis of the indicated gene mRNA levels in pancreata from KC, KCP1, and KCP2 mice (n=3 mice/group, ** p < 0.01, unpaired t-test, data are expressed as means ± s.e.m., AU, arbitrary units). (D) Analysis of CD274 mRNA in the indicated human PDAC cell lines with or without oxidized HMGB1 (200 ng/ml) or reduced HMGB1 (200 ng/ml) treatment for 48-72 h (n=3, * p < 0.05, ** p < 0.01 versus untreated group, unpaired t-test, data are expressed as means ± s.e.m., AU, arbitrary units). (E) Q-PCR analysis of expression of indicated genes in indicated knockdown PDAC cells (n=3, *** p < 0.001 versus control shRNA group, unpaired t-test, data are expressed as means ± s.e.m., AU, arbitrary units). (F) Knockdown of AGER, but not TLR4 and TLR9, inhibited oxidized HMGB1 (200 ng/ml)-induced CD274 mRNA expression at 72 h in human PDAC cell lines (n=3/group, ** p < 0.01, *** p < 0.001 versus control shRNA group, unpaired t-test, data are expressed as means ± s.e.m., AU, arbitrary units). See also Figures S4, S6, and S7.
Malignant cells often subvert the anticancer immune response by activating immune checkpoints. We therefore questioned whether mitochondrial dysfunction would regulate the expression of genes that are known to participate in immune checkpoints (e.g., PDCD1/PD-1 [programmed cell death 1], CD274/PD-L1, and CTLA4 [cytotoxic T-lymphocyte-associated protein 4]) in the tumor microenvironment during pancreatic tumorigenesis. KCP1 and KCP2 mice exhibited increased mRNA expression of Cd274 (but not Pdcd1 and Ctla4) in the pancreas compared to KC mice (Fig. 6C). The upregulation of Cd274 mRNA in KCP1 and KCP2 mice was inhibited upon treatment with deferiprone, vitamin E, or anti-HMGB1 antibody (but not anti-IL1B or anti-IL18) or genetic depletion of Hif1a or Aim2 (Fig. S6A). Importantly, the proportion of tumor-infiltrating CD8+ T cells was increased after treatment with deferiprone, vitamin E, or anti-HMGB1 antibody or genetic depletion of Hif1a or Aim2 in KCP1 and KCP2 mice (Fig. S6A). These treatments also decreased apoptosis and increased ATP production in infiltrating CD8+ T cells from KCP1 and KCP2 mice (Fig. S6A).
Macrophages are essential components of the cancer microenvironment and play critical roles in the regulating pancreatic tumorigenesis and the immune checkpoint response. Moreover, the increased tumor-infiltrating macrophages (F4/80+) in KCP1 or KCP2 mice compared to KC mice were inhibited after treatment with deferiprone, vitamin E, or anti-HMGB1 antibody. In contrast, these treatments did not significantly change the number of tumor-infiltrating myeloid-derived suppressor cells (MDSC, Gr1+CD11b+), dendritic cells (CD11c+F4/80−), and B cells (CD19+) in KC, KCP1, and KCP2 mice (Fig. S6B).
To gain a better general understanding of the role of HMGB1 in promoting CD274 expression, we assessed whether the redox status of HMGB1 or any of its known receptors (e.g., AGER/RAGE [advanced glycosylation end-product specific receptor] or TLR4 [toll like receptor 4], TLR9) were involved in this process in vitro. Interestingly, oxidized-HMGB1 protein (but not reduced-HMGB1 protein) triggered CD274 mRNA expression in several human PDAC cell lines (MiaPaCa2, CFPAC1, and BxPC3) (Fig. 6D). Knockdown of AGER (but not TLR4 and TLR9) by two distinct, non-overlapping shRNAs (Fig. 6E) blocked oxidized HMGB1-induced CD274 mRNA expression in MiaPaCa2 and CFPAC1 cells (Fig. 6F), indicating that AGER is required for oxidized HMGB1-induced CD274 expression. Furthermore, the oxidized form of circulating HMGB1 was increased in KCP1 compared to KCP1H and KCP1A mice (Fig. S7A). However, mitochondrial iron levels were not so different between KCP1, KCP1H, and KCP1A mice (Fig. S7B), indicating that mitochondrial iron production is upstream of HIF1A and AIM2 activation.
Abnormal PRKN, SLC25A37, and AIM2 mRNA expression is associated with poor prognosis in human pancreatic cancer
We next investigated the association between gene expression (PINK1 [Fig. 7A], PRKN/PARK2 [Fig. 7B], SLC25A37 [Fig. 7C], SCL25A28 [Fig. 7D], HIF1A [Fig. 7E], and AIM2 [Fig. 7F]) and survival in human pancreatic cancer cohorts from the online R2 genomics analysis and visualization platform. High expression of the mRNA of PRKN (Fig. 7B) was associated with improved survival of pancreatic cancer patients, whereas high levels of SLC25A37 (Fig. 7C) and AIM2 mRNA (Fig. 7F) were associated with poor survival. In contrast, the mRNA expression of PINK1 (Fig. 7A), SCL25A28 (Fig. 7D), and HIF1A (Fig. 7E) did not have an impact on patient survival, suggesting that these genes may constitute mechanistic contributors to, but not potential biomarkers for pancreatic cancer.
Figure 7. Abnormal PRKN, SLC25A37, and AIM2 mRNA expression is associated with poor prognosis in human pancreatic cancer.
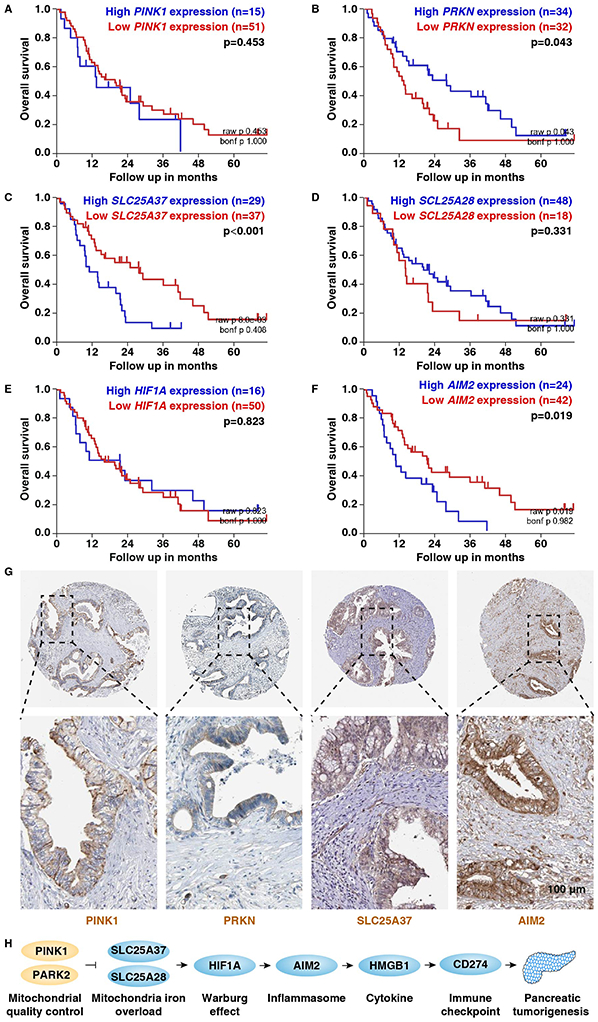
(A-F) Prognostic value of PINK1, PRKN, SLC25A37, SCL25A28, HIF1A, and AIM2 in human pancreatic cancer cohorts from the online R2 genomics analysis and visualization platform (https://hgserver1.amc.nl/cgi-bin/r2/main.cgi?&species=hs). (G) Immunohistochemistry stains of PINK1, PRKN, SLC25A37, and AIM2 in pancreatic cancer patients from The Human Protein Atlas platform (http://www.proteinatlas.org/). (H) Schematic depicting the role of mitochondrial quality control and mitochondrial iron in pancreatic tumorigenesis.
We next assayed the localization of PINK1, PRKN, SLC25A37, and AIM2 protein expression in PDAC from The Human Protein Atlas platform. Immunohistochemistry staining showed that the expressions of PINK1, PRKN, SLC25A37, and AIM2 were mainly confined to ductal cells in certain PDAC patients (Fig. 7G).
Discussion
PDAC remains one of the deadliest cancer types with limited treatment options; therefore, identification of targetable key players in tumor initiation and progression is urgently needed. Here, we characterize the functional role of PINK1 and PARK2 in the pathogenesis of PDAC. We demonstrate in mouse models that Pink1 and Park2 deficiency accelerate pancreatic tumorigenesis through mitochondrial iron-dependent immunometabolic dysfunction (Fig. 7H). These findings shed light on how the degradation pathway controls iron homeostasis and could have implications for the development of strategies to target mitochondrial iron metabolism in PDAC.
The role of autophagy in cancer is complex, with opposite effects on oncogenesis and tumor progression, depending on cancer type, stage, and context. Pancreatic cancers may require autophagy for tumor growth because chloroquine, a widely-used autophagy inhibitor, suppresses pancreatic tumor growth in vivo (Yang et al., 2011). However, the anticancer activity of chloroquine does not fully depend on autophagy inhibition (Maes et al., 2014). Reportedly, autophagy can support pancreatic cancer growth through activation of the lysosomal machinery (Perera et al., 2015) by shifting the usage of glucose from glycolysis to Ser/Gly biosynthesis (Viale et al., 2014), increasing fatty acid beta-oxidation (Viale et al., 2014), and favoring macropinocytotic uptake of amino acids (e.g., alanine) by stromal cells (Sousa et al., 2016). However, autophagy-deficient atg7−/− mice exhibit increased PanIN formation in mutant Kras-driven pancreatic tumorigenesis (Rosenfeldt et al., 2013). Depletion of the tumor suppressor Trp53/p53 further accelerates mutant Kras-driven PDAC formation in autophagy-deficient atg7−/− mice (Rosenfeldt et al., 2013). Thus, the role of autophagy in PDAC may depend on tumor suppressor status.
Our observation that PINK1 or PARK2 suppresses Kras-driven pancreatic tumorigenesis in mice is consistent with previous observations that PINK1 or PARK2 functions as tumor suppressor in the liver and glioblastoma (Agnihotri et al., 2016). Notably, the PINK1-PARK2 pathway regulates mitochondrial iron accumulation through affecting SLC25A37 and SCL25A28 degradation via a process that requires the ATG5-dependent autophagy pathway, but not mitophagy-associated proteasomal degradation, in human PDAC cell lines. Our findings are also consistent with those from a previous study showing that RB1CC1/FIP200 (RB1 inducible coiled-coil 1)-mediated autophagy (but not proteasome) is required for the PAKIN2-associated degradation of inner mitochondrial membrane proteins and matrix proteins in fibroblasts (Yoshii et al., 2011).
A key finding in our study is the contribution of mitochondrial iron to the abnormal metabolism that supports pancreatic tumor development. Excessive mitochondrial iron accumulation can accelerate mutant Kras-driven pancreatic tumor initiation by enhancing the formation of ROS, which in turn increase glycolysis and reduce oxygen consumption under aerobic conditions, hence provoking a marked Warburg effect. Pharmacological administration of mitochondrial iron chelators (e.g., deferiprone) or antioxidants (e.g., vitamin E) or genetic depletion of Hif1a reversed the Warburg effect and inhibited mutant Kras-driven pancreatic tumorigenesis in mitophagy-deficient mice. In contrast, knockout of Hif1a accelerates KrasG12D-driven pancreatic neoplasia in non-mitophagy-deficient mice (Lee et al., 2016). These studies indicate that the role of HIF1A in pancreatic tumorigenesis may depend on PINK1 or PARK2 status, although the detailed mechanism remains to be elucidated.
Our study highlights the oncogenic-like role of the AIM2 inflammasome in pancreatic tumorigenesis. Inflammasome components are not only expressed by immune cells (e.g., macrophages), but also by nonimmune cell types, including acinar and cancer cells. Previous studies indicated that activation of NLRP3 and AIM2 inflammasome contribute to pancreatitis (Hoque et al., 2011; Kang et al., 2016a) and that activation of the NLRP3 inflammasome within macrophages entails immune suppression in pancreatic cancer development (Daley et al., 2017). Here, we demonstrate that mitochondrial iron-mediated oxidative DNA injury results in AIM2 inflammasome activation in PDAC cells, which in turn induces HMGB1 release and subsequent CD274 expression. The inflammasome-independent function of AIM2 may result in the suppression of colon tumorigenesis (Wilson et al., 2015). Thus, the inflammasome-dependent and -independent functions of AIM2 in tumorigenesis may differ significantly by stimulus and tumor type.
Our findings raise the possibility that HMGB1 may serve previously unknown immunosuppressive functions by stimulating the expression of the immune checkpoint protein CD274. The activity of HMGB1, a prototypic damage-associated molecular pattern molecule, is regulated by its redox status and receptors (Kang et al., 2014a). HMGB1 is a mediator of immunogenic cell death in anticancer chemotherapy and radiotherapy and this process requires its receptor, TLR4 (Apetoh et al., 2007). Our study indicates that oxidized HMGB1 can trigger CD274 expression in PDAC cells in an AGER-dependent manner, which may enable the tumor to escape from anticancer immunosurveillance. Although intracellular HMGB1 may function as a tumor suppressor in PDAC (Kang et al., 2017b), blocking the extracellular HMGB1-AGER pathway could limit pancreatic cancer development (Kang et al., 2014b).
In summary, these studies provide mechanistic insights into the role of the PINK1-PARK2 pathway in pancreatic tumorigenesis. Therapeutic strategies that target selective autophagy rather than general autophagy may maximize clinical benefit by enhancing selectivity. Our results also suggest that mitochondrial iron is a druggable driver for metabolic programming and inflammation-associated immunosuppression in tumor development.
STAR METHODS
CONTACT FOR REAGENT AND RESOURCE SHARING
Further information and requests for reagents may be obtained from the lead contact, Daolin Tang (Email: tangd2@upmc.edu).
EXPERIMENTAL MODEL AND SUBJECT DETAILS
Cell culture
All human PDAC tumor cell lines (male) were obtained from American Type Culture Collection (ATCC, USA). These cell lines were grown in Dulbecco’s Modified Eagle’s Medium (DMEM) or RPMI-1640 medium with 10% fetal bovine serum [FBS], 2 mM L-glutamine, and 100 U/ml of penicillin and streptomycin. Primary pancreatic acinar cells (male or female) were isolated by collagenase digestion (Gout et al., 2013). In brief, pancreata were dissected, minced, and digested at 37°C in a collagenase IA solution (Hank’s balanced salt solution [HBSS] 1x containing 10 mM HEPES, 200 U/ml of collagenase IA, and 0.25 mg/ml of trypsin inhibitor) with agitation by a magnetic stir bar. After 20 minutes, collagen digestion was stopped by adding an ice-cold HBSS media containing 5% FBS and 10 mM HEPES, and then filtered through a 105 μm nylon mesh. After repetitive washing steps by stopping buffer, the supernatant of the cell suspension containing acinar cells was added dropwise to HBSS containing 30% FBS. The primary pancreatic ductal cells were isolated using ductal-specific Dolichos biflorus agglutinin lectin (#FL-1031, Vector Labs) labeling followed by magnetic bead (#130-048-701, Miltenyi Biotec) separation (Reichert et al., 2013). We confirmed that isolated acinar cells expressed amylase (acinar cell marker), but not CK-19 (ductal cell marker), whereas isolated ducal cells expressed KRT19, but not amylase (Fig. S1C). These primary cells were grown in DMEM with 15% FBS, 2 mM L-glutamine, and 100 U/ml of penicillin and streptomycin. All cells were mycoplasma-free and authenticated using Short Tandem Repeat DNA Profiling Analysis.
Animal study
We conducted all animal care and experiments in accordance with the Association for Assessment and Accreditation of Laboratory Animal Care guidelines (http://www.aaalac.org) and with approval from our Institutional Animal Care and Use Committee.
Pdx1-Cre, KrasG12D/+, pink1−/−, park2−/−, aim2−/−, and hif1aflox mice (male or female, four-week-old) on the C57BL/6 background were purchased from Jackson Laboratories. These mice were crossed to generate the indicated KC (Pdx1-Cre;KrasG12D/+), KCP1 (Pdx1-Cre;Kras G12D/+;pink1−/−), KCP2 (Pdx1-Cre;KrasG12D/+;park2−/−), KCP1A (Pdx1-Cre;Kras G12D/+;pink1−/−;aim2 −/−), KCP2A (Pdx1-Cre;KrasG12D/+;park2−/−;aim2 −/−), KCP1H (Pdx1-Cre;KrasG12D/+;pink1−/−;hif1a−/−), and KCP2H (Pdx1-Cre;KrasG12D/+;park2−/−;hif1a−/−) animals. PCR genotyping assays for these genetically modified mouse strains were performed per Jackson Laboratories’ protocol. All mice were housed under a 12-h light-dark diurnal cycle with controlled temperature (21°C to 23°C) and provided a standard rodent diet (#5001, LabDiet) and water ad libitum throughout all experiments.
To study the effects of oxidative stress and mitochondrial iron accumulation on pancreatic tumorigenesis, four-week-old KCP1 or KCP2 mice (female or male [1:1]) were randomly allocated into groups and injected by oral gavage with vitamin E (100 mg/kg), deferiprone (50 mg/kg), or vehicle twice per week for eight weeks.
To induce pancreatitis, four-week-old KCP1 or KCP2 mice (female or male [1:1]) were randomly allocated into groups and injected intraperitoneally (i.p.) with cerulein (50 μg/kg) with two sets of six injections hourly on alternating days separated by 24 h (Kang et al., 2017a). The final day of cerulein injection was considered day 0.
To study the effects of IL1B, IL18, and HMGB1 on pancreatic tumorigenesis, four-week-old KCP1 or KCP2 mice (female or male [1:1]) were randomly allocated into groups and injected i.p. with neutralizing antibodies (10 mg/kg) or control IgG (10 mg/kg) twice per week for eight weeks.
METHOD DETAILS
Cytotoxicity assays
Cells were seeded into 96-well plates and incubated with the indicated treatments. Subsequently, 100 μl fresh medium was added to cells containing 10 μl Cell Counting Kit-8 (CCK-8) solutions (Dojindo Laboratories, Tokyo, Japan) and incubated for 1 h (37℃, 5% CO2). Absorbance at 450 nm was measured using a microplate reader (Tecan, Morrisville, NC, USA).
Commercial kit analysis
The MDA (#ab118970, Abcam), 4-HNE (#STA-838, Cell Biolabs, San Diego, CA, USA), GSH (#CS0260, Sigma Aldrich), iron (#ab83366, Abcam), zinc (#ab176725, Abcam), copper (#MAK127, Sigma Aldrich), lactate (#ab65331, Abcam), insulin (#EZRMI-13K, Sigma Aldrich), glucagon (#EZGLU-30K, Sigma Aldrich), IL1B (#433404, BioLegend), TNF (#430907, BioLegend), IL18 (#BMS618-3TEN, Thermo Fisher Scientific), IL10 (#EM2IL10, Thermo Fisher Scientific), HMGB1 (#326054329, Shino-Test Corporation), caspase-3 (#5723, Cell Signaling Technology), and ATP (#A22066, Thermo Fisher Scientific) concentrations or activity in samples were measured using ELISA. Mitochondria/Cytosol Fractionation Kits (#89874, #89801, Thermo Fisher Scientific) were used to isolate mitochondrial fraction from cytosolic fraction of mammalian cells or tissues. Iron Assay Kit (#ab83366) provided a simple convenient means of measuring ferrous and/or ferric ions in samples. After reduction to the ferrous form, iron reacted with Ferene S to produce a stable colored complex and gave absorbance at 593 nm.
Measuring glucose
Glucose concentration measurements were obtained from whole-blood samples using hand-held whole-blood glucose monitors (#W-GLUCOSE-KIT, Bayer).
HIF1A DNA binding activity assay
HIF1A DNA binding activity was assayed using the HIF1A Transcription Factor Assay (#ab133104, Abcam). This assay is a non-radioactive, sensitive method for detecting specific transcription factor DNA-binding activity in nuclear extracts and whole cell lysate. A specific double-stranded DNA sequence containing the HIF1A response element (5’-ACGTG-3’) was immobilized to the wells of a 96-well plate. HIF1A contained in a nuclear extract binds specifically to the HIF1A response element. The HIF transcription factor complex was detected by the addition of a specific primary antibody directed against HIF1A. A secondary antibody conjugated to HRP was added to provide a sensitive colorimetric readout at 450 nm.
Measuring DNA
Whole blood was collected from each mouse. The plasma was separated by centrifugation at 800 g for 10 min and immediately frozen at −80°C. The amount of DNA in the plasma was quantified directly using the Quant-iT PicoGreen dsDNA Quantification Reagent Kit (#P11496, Thermo Fisher Scientific). PicoGreen specifically binds dsDNA, and after excitation at 485 nm, the dsDNA/PicoGreen fluorescence complex can be detected at 538 nm using Cytation™ 5 Cell Imaging Multi-Mode Reader (BioTek, USA).
Plasma DNA was isolated from plasma using the QIAamp DNA Blood Mini Kit (#51104; Qiagen, Valencia, California, USA) and total DNA was isolated from cells using the Gentra Puregene Cell Kit (#158745; Qiagen, Valencia, California, USA) following the manufacturer’s manual. mtDNA and nuclear DNA were quantified with real-time PCR using the CFX96 Touch™ Real-Time PCR Detection System (Bio-Rad) with the following primers as previously described (Malik et al., 2016; Rooney et al., 2015): mouse mitDNA: 5’-CTAGAAACCCCGAAACCAAA-3’ and 5’-CCAGCTATCACCAAGCTCGT-3’; mouse nucDNA: 5’-ATGGGAAGCCGAACATACTG-3’ and 5’-CAGTCTCAGTGGGGGTGAAT −3’; human mitDNA: 5’-CACCCAAGAACAGGGTTTGT-3’ and 5’-TGGCCATGGGTA TGTTGTTA-3’.
Preparation of reduced or oxidized HMGB1
Recombinant HMGB1 protein (#1690-HMB-050, R&D Systems) was exposed to either 1 mM H2O2 (#H1009, Sigma Aldrich) or 5 mM dithiothreitol (#R0861, Thermo Fisher Scientific) for 1 h and dialyzed before the addition to cells or other analyses.
Q-PCR analysis
Total RNA was extracted and purified from cultured cells using the RNeasy Plus Mini Kit (#74136, QIAGEN, Valencia, CA, USA). First-strand cDNA was synthesized from 1 μg of RNA using the iScript cDNA Synthesis Kit (#1708890, Bio-Rad, Hercules, CA, USA). Briefly, 20-μl reactions were prepared by combining 4 μl iScript Select reaction mix, 2 μl gene-specific enhancer solution, 1 μl reverse transcriptase, 1 μl gene-specific assay pool (20×, 2 μM), and 12 μl RNA diluted in RNase-free water. cDNA from various cell samples were then amplified by real-time quantitative real time polymerase chain reaction (Q-PCR) with specific primers using an CFX96 Touch™ Real-Time PCR Detection System (Bio-Rad).
Histological analysis
Pancreatic specimens were fixed with 10% buffered formalin, dehydrated in ethanol, embedded with paraffin, and stained with hematoxylin and eosin. The fraction of preserved acinar area was calculated as previously described (Song et al., 2018; Xie et al., 2017). In brief, the acinar cells showed a strongly basophilic cytoplasm that represents the area occupied by the rough endoplasmic reticulum. Pancreatic ductal dysplasia was graded according to established criteria (Hruban et al., 2001). In brief, PanIN 1 lesions showed the normal cuboidal pancreatic ductal epithelial cells transition to columnar architecture. PanIN2 lesions were associated with additional nuclear abnormalities such as loss of polarity. PanIN3 lesions showed cribriforming, budding off of cells, and luminal necrosis with marked cytological abnormalities, without invasion beyond the basement membrane. Tumor invasion or metastasis to the liver and lung were counted and measured using a combination of visual inspection and hematoxylin and eosin staining. Histological images were acquired using an EVOS FL Auto Cell Imaging System (Thermo Fisher Scientific Inc.).
Confocal microscope assays
Mitochondria were shown by anti-ATP synthase beta antibody staining. The percentage of cells with colocalization of MAP1LC3B and mitochondria was determined by quantifying the number of positively-stained cells from 50 randomly-chosen cells from 10 to 15 random fields. Images were collected using a laser-scanning confocal microscope (Fluoview FV-1000; Olympus) using a 60× Plan Apo/1.45 oil immersion objective at 25°C and Fluoview software (FV10-ASW 1.6; Olympus). Images were subsequently analyzed for fluorescent intensity levels and colocalization of various stains by Image-Pro Plus software (Media Cybernetics) (Tang et al., 2010).
RNAi
Human NCOA4 shRNA (#TRCN0000236186), human SQSTM1 shRNA (#TRCN0000007237), human SLC25A37 shRNA (#TRCN0000245150), human SLC25A28 shRNA (#TRCN0000043927), mouse Slc25a37 shRNA (#TRCN0000068412), mouse Slc25a28 shRNA (#TRCN0000069608), human BNIP3L shRNA (#TRCN0000007847), human ATG5 shRNA (#TRCN0000151963), human AGER shRNA (#TRCN0000062658 and #TRCN0000062662), human TLR4 shRNA (#TRCN0000056893 and #TRCN0000056897), and human TLR9 shRNA (#TRCN0000358885 and #TRCN0000358888) were obtained from Sigma Aldrich. Transfection was performed using lentiviral shRNA vector or Lipofectamine 3000 (#L3000-015, Invitrogen, Grand Island, NY, USA,). Puromycin (#ant-pr-1; InvivoGen) was used to generate stable knockdown cell lines.
Western blot analysis
Cells were lysed with 1X cell lysis buffer (#9803, Cell Signaling Technology) containing protease inhibitor on ice for 10 min, homogenized by passing through a 21-gauge needle, and centrifuged at 14,000 x g for 15 min at 4°C to pellet the cell debris. Protein was quantified using the BCA assay (#23225, Thermo Fisher Scientific) and 20 μg of each sample was resolved on 4-12% Criterion XT Bis-Tris gels (#3450124, Bio-Rad) in XT MES running buffer (#1610789, Bio-Rad) and transferred to PVDF membranes (#1620233, Bio-Rad) using the Trans-Blot® Turbo™ Transfer Pack and System (Bio-Rad). Membranes were blocked with TBST containing 5% skim milk for 1 h and incubated overnight at 4°C with various primary antibodies. Following three washes in TBST, membranes were incubated with goat anti-rabbit or anti-mouse IgG HRP secondary antibody (1:3000, #7074 or #7076, Cell Signaling Technology) at room temperature for 1 h and washed. Chemiluminescence substrate was applied using SuperSignal™ West Pico Chemiluminescent Substrate (#34080, Thermo Fisher Scientific) or SuperSignal™ West Femto Maximum Sensitivity Substrate (#34095, Thermo Fisher Scientific) and blots were analyzed using the ChemiDoc™ Touch Imaging System (#1708370, Bio-Rad). Image Lab™ Software (#1709691, Bio-Rad) was used for relative quantification of bands, normalized to total protein loaded in each lane (Zhu et al., 2017).
Immunoprecipitation analysis
Cells were lysed at 4°C in ice-cold RIPA lysis buffer and cell lysates were cleared by brief centrifugation (12,000 g, 10 min). Concentrations of proteins in the supernatant were determined by BCA assay. Prior to immunoprecipitation, samples containing equal amounts of proteins were pre-cleared with protein A or protein G agarose/sepharose (4°C, 3 h) and subsequently incubated with various irrelevant IgG or specific antibodies (2-5 μg/mL) in the presence of protein A or G agarose/sepharose beads for 2 h or overnight at 4°C with gently shaking. Following incubation, agarose/sepharose beads were washed extensively with phosphate buffered saline and proteins eluted by boiling in 2 × SDS sample buffer before SDS-PAGE electrophoresis (Sun et al., 2016).
OXPHOS and glycolysis assay
Cellular oxidative phosphorylation (OXPHOS) and glycolysis were monitored using the Seahorse Bioscience Extracellular Flux Analyzer (XF24, Seahorse Bioscience Inc., North Billerica, MA, USA) by measuring OCR, indicative of respiration, and ECAR, indicative of glycolysis in real time (Tang et al., 2011). Briefly, 30,000-50,000 cells were seeded in 24-well plates designed for XF24 in 150 μl of appropriate growth media and incubated overnight. Prior to measurements, cells were washed with unbuffered media once and then immersed in 675 μl unbuffered media and incubated in the absence of CO2 for 1 h. Cells were sequentially treated as indicated with oligomycin (“Olig”, 1 μM), carbonyl cyanide-4-(trifluoromethoxy)phenylhydrazone (“FCCP”, 0.3 μM), 2-deoxy-D-glucose (“2DG”, 100 mM), and rotenone (“Rote”, 1 μM). OCR and ECAR were then measured in a typical eight-minute cycle of mix (two to four min), dwell (two min), and measure (two to four min) as recommended by Seahorse Bioscience. Basal levels of OCR and ECR were recorded first, followed by OCR and ECAR levels following injection of compounds that inhibit the respiratory mitochondrial electron transport chain, ATP synthesis, or glycolysis.
Immune cell assay
Pancreata were minced into small fragments and incubated in collagenase solution (1 mg/ml collagenase V in RPMI-1640) at 37°C for 40 min. Dissociated cells were passed through a 70μm cell strainer and washed twice in FACS media. The proportions of tumor-infiltrating CD8+ T cells were assayed using EasySep™ Mouse CD8+ T Cell Isolation Kit (STEMCELL Technologies Inc., #19853). The proportions of tumor-infiltrating macrophages (F4/80+), myeloid-derived suppressor cells (Gr1+CD11b+), dendritic cells (CD11c+F4/80-), and B cells (CD19+) were assayed by flow cytometry (Lee et al., 2016).
QUANTIFICATION AND STATISTICAL ANALYSIS
Bioinformatics analysis
Kaplan-Meier analysis of the prognosis of pancreatic cancer patients was performed on the R2 website (http://r2.amc.nl). This online tool can be used to analyze a large collection of public genomic data. The dataset was from the AMC cohort study of 130 pancreatic cancer patients. The analysis of protein expression in human pancreatic cancer was based on The Human Protein Atlas online platform (http://www.proteinatlas.org/). In brief, the immunohistochemical staining of indicate protein was used to yield a protein expression profile by the Human Protein Atlas consortium.
Statistical analysis
Data are presented as mean ± s.e.m. of three independent experiments except where otherwise indicated. Unpaired Student’s t tests were used to compare the means of two groups. One-way Analysis of Variance (ANOVA) was used for comparison among the different groups. When ANOVA was significant, post hoc testing of differences between groups was performed using the Least Significant Difference (LSD) test. The Kaplan-Meier method was used to compare differences in mortality rates between groups. A p-value < 0.05 was considered statistically significant. We did not exclude samples or animals. For every figure, statistical tests are justified as appropriate. All data meet the assumptions of the tests (e.g., normal distribution). No statistical methods were used to pre-determine sample sizes, but our sample sizes are similar to those generally employed in the field.
Supplementary Material
KEY RESOURCES TABLE
| REAGENT or RESOURCE | SOURCE | IDENTIFIER |
|---|---|---|
| Antibodies | ||
| Rabbit monoclonal [EPR14335] to SOX9 | Abcam | ab185230, RRID:AB_2715497 |
| Rabbit monoclonal [EP1580Y] to KRT19/Cytokeratin 19 | Abcam | ab52625, RRID:AB_2281020 |
| Rabbit polyclonal to pancreatic alpha amylase | Abcam | ab21156, RRID:AB_446061 |
| Mouse monoclonal [Vim 3B4] to VIM/Vimentin | Abcam | ab28028, RRID:AB_778826 |
| Rat monoclonal [RM0478-17Q1] to MMP7 | Abcam | ab205672, PRID: AB_2732806 |
| Rabbit polyclonal to PINK1 | Abcam | ab23707, RRID:AB_447627 |
| Mouse monoclonal [PRK8] to PRKN/PARK2 | Abcam | ab77924, RRID:AB_1566559 |
| Rabbit polyclonal to NCOA4 | Abcam | ab86707, RRID:AB_1925236 |
| Rabbit polyclonal to SLC25A37/ Mitoferrin1 | Abcam | ab102959, RRID:AB_10710726 |
| Rabbit polyclonal to SLC25A28 | Abcam | ab90170, RRID:AB_2190051 |
| Rabbit polyclonal to beta Tubulin | Abcam | ab6046, RRID:AB_2210370 |
| Rabbit monoclonal [EPR16897] to HIF1A | Abcam | ab179483, RRID: AB_2732807 |
| Rabbit polyclonal to γH2AFX/γH2AX | Abcam | ab11175, RRID:AB_297814 |
| Rabbit polyclonal to TOMM20 | Abcam | ab78547, RRID:AB_2043078 |
| Rabbit polyclonal to HMGB1 | Abcam | ab18256, RRID:AB_444360 |
| Rabbit polyclonal to αSMA | Abcam | ab5694, RRID:AB_2223021 |
| Rabbit polyclonal to HSPD1/mitHSP60 | Abcam | ab46798, RRID:AB_881444 |
| Mouse monoclonal [JG1] to HSPA9/mitHSP70 | Abcam | ab2799, RRID:AB_303311 |
| Rabbit monoclonal [D4H5] to MMP7 | Cell Signaling Technology | 3801, RRID:AB_2144465 |
| Rabbit polyclonal to SQSTM1/p62 | Cell Signaling Technology | 5114, RRID:AB_10624872 |
| Rabbit polyclonal to VDAC | Cell Signaling Technology | 4866, RRID:AB_10694691 |
| Rabbit polyclonal to AIM2 | Cell Signaling Technology | 13095, RRID: AB_2732808 |
| Rabbit monoclonal [D4D8T] to NLRP3 | Cell Signaling Technology | 15101, RRID:AB_2722591 |
| Rabbit monoclonal [D5F5U] to ATG5 | Cell Signaling Technology | 12994, RRID:AB_2630393 |
| Rabbit monoclonal [D4R4B] to BNIP3L/NIX | Cell Signaling Technology | 12396, RRID:AB_2688036 |
| Rabbit monoclonal [3E11] to COXIV | Cell Signaling Technology | 4850, RRID:AB_10694213 |
| Rabbit monoclonal [D2L8S] to OTPN/optineurin | Cell Signaling Technology | 58981, RRID:AB_2732809 |
| Rabbit monoclonal [D1E4A] to CALCOCO2/NDP52 | Cell Signaling Technology | 60732, RRID:AB_2732810 |
| Rabbit polyclonal to SLC25A37/ Mitoferrin1 | Sigma Aldrich | ABS1051, RRID: AB_2732811 |
| Mouse monoclonal [AC-15] to ACTB/β-actin | Sigma Aldrich | A5441, RRID:AB_476744 |
| Rabbit polyclonal to SLC25A28 | Thermo Fisher Scientific | PA5-42498, RRID:AB_2606193 |
| Mouse monoclonal [3E8] to HMGB1 | BioLegend | 651402, RRID:AB_10916522 |
| Mouse monoclonal [B122] to IL1B | R&D Systems | MAB4012, RRID:AB_2124619 |
| Mouse monoclonal [74] to IL18 | R&D Systems | D047-3, RRID:AB_2123797 |
| Rabbit polyclonal to MAP1LC3B/LC3B | NOVUS | NB100-2220, RRID:AB_10003146 |
| Mouse monoclonal [3D5AB1] to ATP synthase beta | Thermo Fisher Scientific | A-21351, RRID:AB_221512 |
| Rat monoclonal [BM8] to F4/80 | eBioscience | 12-4801-80, RRID:AB_465922 |
| Rat monoclonal [M1/70] to CD11b | BD | 561039, RRID:AB_2033993 |
| Hamaster monoclonal [HL3] to CD11c | BD | 560521, RRID:AB_1727423 |
| Rat monoclonal [RB6-8C5] to Gr1 | BD | 557661, RRID:AB_396775 |
| Rat monoclonal [1D3] to CD19 | BD | 550992, RRID:AB_398483 |
| Chemicals, Peptides, and Recombinant Proteins | ||
| Vitamin E | Selleck Chemicals | S4686 |
| Deferiprone | Selleck Chemicals | S4067 |
| Bafilomycin A1 | Selleck Chemicals | S1413 |
| CCCP | Sigma Aldrich | 857815 |
| FCCP | Sigma Aldrich | C2920 |
| Rotenone | Sigma Aldrich | R8875 |
| 2-deoxy-D-glucose | Sigma Aldrich | D8375 |
| Oligomycin | Sigma Aldrich | 1404-19-9 |
| CoCl2 | Sigma Aldrich | 60818 |
| Cerulein | Sigma Aldrich | C9026 |
| Epoxomicin | Sigma Aldrich | E3652 |
| Z-VAD-FMK | Sigma Aldrich | 219007 |
| Ferric ammonium citrate | Sigma Aldrich | F5879 |
| Poly(dA:dT)/LyoVec™ | InvivoGen | tlrl-patc |
| Recombinant HMGB1 protein | R&D Systems | 1690-HMB-050 |
| Lipofectamine 3000 | Invitrogen | L3000-015 |
| Puromycin | InvivoGen | ant-pr-1 |
| Ductal-specific Dolichos biflorus agglutinin lectin | Vector Labs | FL-1031 |
| SuperSignal™ West Pico Chemiluminescent Substrate | Thermo Fisher Scientific | 34080 |
| SuperSignal™ West Femto Maximum Sensitivity Substrate | Thermo Fisher Scientific | 34095 |
| Critical Commercial Assays | ||
| Cell Counting Kit-8 (CCK-8) | Dojindo Laboratories | CK04 |
| Lipid Peroxidation (MDA) Assay Kit | Abcam | ab118970 |
| OxiSelect™ HNE Adduct Competitive ELISA Kit | Cell Biolabs | STA-838 |
| GSH Assay Kit | Sigma Aldrich | CS0260 |
| Iron Assay Kit | Abcam | ab83366 |
| Zinc Assay Kit | Abcam | ab176725 |
| Copper Assay Kit | Sigma Aldrich | MAK127 |
| L-Lactate Assay Kit | Abcam | ab65331 |
| Insulin ELISA Kit | Sigma Aldrich | EZRMI-13K |
| Glucagon ELISA Kit | Sigma Aldrich | EZGLU-30K |
| IL1B ELISA Kit | BioLegend | 433404 |
| TNF ELISA Kit | BioLegend | 430907 |
| IL18 ELISA Kit | Thermo Fisher Scientific | BMS618-3TEN |
| IL10 ELISA Kit | Thermo Fisher Scientific | EM2IL10 |
| HMGB1 ELISA Kit | Shino-Test Corporation | 326054329 |
| Mitochondria/Cytosol Fractionation Kits | Thermo Fisher Scientific | 89874, 89801 |
| HIF1A Transcription Factor Assay | Abcam | ab133104 |
| Quant-iT PicoGreen dsDNA Quantification Reagent Kit | Thermo Fisher Scientific | P11496 |
| RNeasy Plus Mini Kit | QIAGEN | 74136 |
| QIAamp DNA Blood Mini Kit | QIAGEN | 51104 |
| Gentra Puregene Cell Kit | QIAGEN | 158745 |
| iScript cDNA Synthesis Kit | Bio-Rad | 1708890 |
| BCA Assay Kit | Thermo Fisher Scientific | 23225 |
| 4-12% Criterion XT Bis-Tris gels | Bio-Rad | 3450124 |
| XT MES running buffer | Bio-Rad | 1610789 |
| PVDF membranes | Bio-Rad | 1620233 |
| Magnetic bead | Miltenyi Biotec | 130-048-701 |
| Caspase-3 Activity Assay Kit | Cell Signaling Technology | 5723 |
| ATP Determination Kit | Thermo Fisher Scientific | A22066 |
| Mouse CD8+ T Cell Isolation Kit | STEMCELL Technologies Inc. | 19853 |
| Experimental Models: Cell Lines | ||
| PANC1 | ATCC | CRL-1469 |
| MiaPaCa2 | ATCC | CRL-1420 |
| CFPAC1 | ATCC | CRL-1918 |
| BxPC3 | ATCC | CRL-1687 |
| Experimental Models: Organisms/Strains | ||
| KrasG12D/+ mice (B6.129S4-Krastm4Tyj/J) | The Jackson Laboratory | 008179 |
| Pdx1-Cre mice (B6.FVB-Tg(Pdx1-cre)6Tuv/J) | The Jackson Laboratory | 014647 |
| pink1−/− mice (B6.129S4-Pink1tm1Shn/J) | The Jackson Laboratory | 017946 |
| park2−/− mice (B6.129S4-Park2tm1Shn/J) | The Jackson Laboratory | 006582 |
| aim2−/− mice (B6.129P2-Aim2Gt(CSG445)Byg/J) | The Jackson Laboratory | 013144 |
| hif1aflox mice (B6.129-Hif1atm3Rsjo/J) | The Jackson Laboratory | 007561 |
| C57BL/6J wild type mice | The Jackson Laboratory | 000664 |
| Oligonucleotides | ||
| Human NCOA4 shRNA (Sequence: CCGGTCAGCAGCTCTACTCGTTATTCTCGAGAATAACGAGTAGAGCTGCTGATTTTTG) | Sigma Aldrich | TRCN0000236186 |
| Human SQSTM1 shRNA (Sequence:CCGGCCTCTGGGCATTGAAGTTGATCTCGAGATCAACTTCAATGCCCAGAGGTTTTT) | Sigma Aldrich | TRCN0000007237 |
| Human SLC25A37 shRNA (Sequence:CCGGAGGCGTCAACGTCATGATCATCTCGAGATGATCATGACGTTGACGCCTTTTTTG), | Sigma Aldrich | TRCN0000245150 |
| Human SLC25A28 shRNA (Sequence:CCGGCTTGGCTTTGAACTCACACATCTCGAGATGTGTGAGTTCAAAGCCAAGTTTTTG), | Sigma Aldrich | TRCN0000043927 |
| Mouse Slc25a37 shRNA (Sequence:CCGGCTTCCAGTCAATTCACTTCATCTCGAGATGAAGTGAATTGACTGGAAGTTTTTG) | Sigma Aldrich | TRCN0000068412 |
| Mouse Slc25a28 shRNA (Sequence:CCGGGCATGGTCTGTGTATGAATTTCTCGAGAAATTCATACACAGACCATGCTTTTTG) | Sigma Aldrich | TRCN0000069608 |
| Human BNIP3L shRNA (Sequence:CCGGCAGTCAGAAGAAGAAGTTGTACTCGAGTACAACTTCTTCTTCTGACTGTTTTT) | Sigma Aldrich | TRCN0000007847 |
| Human ATG5 shRNA (Sequence:CCGGCCTGAACAGAATCATCCTTAACTCGAGTTAAGGATGATTCTGTTCAGGTTTTTTG) | Sigma Aldrich | TRCN0000151963 |
| Human PARK2 shRNA (Sequence: CCGGCGCAACAAATAGTCGGAACATCTCGAGATGTTCCGACTATTTGTTGCGTTTTT) | Sigma Aldrich | TRCN0000000282 |
| Human AGER shRNA-1 (Sequence:CCGGCGAGTCCGTGTCTACCAGATTCTCGAGAATCTGGTAGACACGGACTCGTTTTTG) | Sigma Aldrich | TRCN0000062658 |
| Human AGER shRNA-2 (Sequence:CCGGGAAGGGAGTATCTGTGAAGGACTCGAGTCCTTCACAGATACTCCCTTCTTTTTG) | Sigma Aldrich | TRCN0000062662 |
| Human TLR4 shRNA-1 (Sequence:CCGGCCGCTGGTGTATCTTTGAATACTCGAGTATTCAAAGATACACCAGCGGTTTTTG) | Sigma Aldrich | TRCN0000056893 |
| Human TLR4 shRNA-2 (Sequence:CCGGCCAAGTAGTCTAGCTTTCTTACTCGAGTAAGAAAGCTAGACTACTTGGTTTTTG) | Sigma Aldrich | TRCN0000056897 |
| Human TLR9 shRNA-1 (Sequence:CCGGCATGGACGGCAACTGTTATTACTCGAGTAATAACAGTTGCCGTCCATGTTTTTG) | Sigma Aldrich | TRCN0000358885 |
| Human TLR9 shRNA-2 (Sequence:CCGGCGGCAACTGTTATTACAAGAACTCGAGTTCTTGTAATAACAGTTGCCGTTTTTG) | Sigma Aldrich | TRCN0000358888 |
| Mouse Sox9 primers: 5’-CACACGTCAAGCGACCCATGAA-3’ and 5’-TCTTCTCGCTCTCGTTCAGCAG-3’ | This paper | N/A |
| Mouse Krt19 primers: 5’-AATGGCGAGCTGGAGGTGAAGA-3’ and 5’-CTTGGAGTTGTCAATGGTGGCAC-3’ | This paper | N/A |
| Mouse Vim primers: 5’-CGGAAAGTGGAATCCTTGCAGG-3’ and 5’-AGCAGTGAGGTCAGGCTTGGAA-3’ | This paper | N/A |
| Mouse Mmp7 primers: 5’-AGGTGTGGAGTGCCAGATGTTG-3’ and 5’-CCACTACGATCCGAGGTAAGTC-3’ | This paper | N/A |
| Mouse Slc2a1 primers: 5’-GCTTCTCCAACTGGACCTCAAAC-3’ and 5’-ACGAGGAGCACCGTGAAGATGA-3’ | This paper | N/A |
| Mouse Hk2 primers: 5’-CCCTGTGAAGATGTTGCCCACT-3’ and 5’-CCTTCGCTTGCCATTACGCACG-3’ | This paper | N/A |
| Mouse Aldoa primers: 5’-CACGAGACACTGTACCAGAAGG-3’ and 5’-TTGTCTCGCCATTGGTTCCTGC-3’ | This paper | N/A |
| Mouse Ldha primers: 5’-ACGCAGACAAGGAGCAGTGGAA-3’ and 5’-ATGCTCTCAGCCAAGTCTGCCA-3’ | This paper | N/A |
| Mouse Slc25a28 primers: 5’-TGATGCAGCCATGAATCCAGCG-3’ and 5’-GTCGTGTAGCTGCGGTAAAAGG-3’ | This paper | N/A |
| Mouse Slc25a37 primers: 5’-GCCACCCTACTCCACGATGCA-3’ and 5’-CAACTGAAGGCTGACTGGTGCT-3’ | This paper | N/A |
| Mouse Aim2 primers: 5’-AGGCTGCTACAGAAGTCTGTCC-3’ and 5’-TCAGCACCGTGACAACAAGTGG-3’ | This paper | N/A |
| Mouse Nlrp3 primers: 5’-TCACAACTCGCCCAAGGAGGAA-3’ and 5’-AAGAGACCACGGCAGAAGCTAG-3’ | This paper | N/A |
| Mouse Nlrc4 primers: 5’-CTCACCACGGATGACGAACAGT-3’ and 5’-TGTCATCCAGTATGAGTCTCTCG-3’ | This paper | N/A |
| Mouse Nlrp1 primers: 5’-GCTGAATGACCTGGGTGATGGT-3’ and 5’-CTTGGTCACTGAGAGATGCCTG-3’ | This paper | N/A |
| Human AGER primers: 5’-CACCTTCTCCTGTAGCTTCAGC-3’ and 5’-AGGAGCTACTGCTCCACCTTCT-3’ | This paper | N/A |
| Human TLR4 primers: 5’-CCCTGAGGCATTTAGGCAGCTA-3’ and 5’-AGGTAGAGAGGTGGCTTAGGCT-3’ | This paper | N/A |
| Human TLR9 primers: 5’-TGAGCCACAACTGCATCTCGCA-3’ and 5’-CAGTCGTGGTAGCTCCGTGAAT-3’ | This paper | N/A |
| Mouse 18S rna primers: 5’-GCAATTATTCCCCATGAACG-3’ and 5’-GGCCTCACTAAACCATCCAA-3’ | This paper | N/A |
| Human 18S RNA primers: 5’-CTACCACATCCAAGGAAGCA-3’ and 5’-TTTTTCGTCACTACCTCCCCG-3’ | This paper | N/A |
| Mouse mitDNA primers: 5’-CTAGAAACCCCGAAACCAAA-3’ and 5’-CCAGCTATCACCAAGCTCGT-3’ | (Malik et al., 2016) | N/A |
| Mouse nucDNA primers:: 5’-ATGGGAAGCCGAACATACTG-3’ and 5’-CAGTCTCAGTGGGGGTGAAT -3’ | (Malik et al., 2016) | N/A |
| Human mitDNA primers: 5’-CACCCAAGAACAGGGTTTGT-3’ and 5’-TGGCCATGGGTA TGTTGTTA-3’ | (Rooney et al., 2015) | N/A |
| Software and Algorithms | ||
| Image Lab™ software | Bio-Rad | 1709691 |
| Image-Pro Plus software | Media Cybernetics | http://www.mediacy.com/imageproplus |
Acknowledgments
We thank Christine Heiner (Department of Surgery, University of Pittsburgh) for her critical reading of the manuscript. This work was supported by grants from the US National Institutes of Health (R01GM053396), the American Cancer Society (Research Scholar Grant RSG-16-014-01-CDD). G.K. is supported by the Ligue contre le Cancer (équipe labelisée); Agence National de la Recherche (ANR)- Projets blancs; ANR under the frame of E-Rare-2, the ERA-Net for Research on Rare Diseases; Association pour la recherche sur le cancer (ARC); Cancéropôle Ile-de-France; Institut National du Cancer (INCa); Institut Universitaire de France; Fondation pour la Recherche Médicale (FRM); the European Commission (ArtForce); the European Research Council (ERC); the LeDucq Foundation; the LabEx Immuno-Oncology; the RHU Torino Lumière, the SIRIC Stratified Oncology Cell DNA Repair and Tumor Immune Elimination (SOCRATE); the SIRIC Cancer Research and Personalized Medicine (CARPEM); and the Paris Alliance of Cancer Research Institutes (PACRI).
Footnotes
Declaration of Interests
The authors declare no conflicts of interest or financial interests.
References
- Agnihotri S, Golbourn B, Huang X, Remke M, Younger S, Cairns RA, Chalil A, Smith CA, Krumholtz SL, Mackenzie D, et al. (2016). PINK1 Is a Negative Regulator of Growth and the Warburg Effect in Glioblastoma. Cancer research 76, 4708–4719. [DOI] [PubMed] [Google Scholar]
- Apetoh L, Ghiringhelli F, Tesniere A, Obeid M, Ortiz C, Criollo A, Mignot G, Maiuri MC, Ullrich E, Saulnier P, et al. (2007). Toll-like receptor 4-dependent contribution of the immune system to anticancer chemotherapy and radiotherapy. Nature medicine 13, 1050–1059. [DOI] [PubMed] [Google Scholar]
- Chan NC, Salazar AM, Pham AH, Sweredoski MJ, Kolawa NJ, Graham RL, Hess S, and Chan DC (2011). Broad activation of the ubiquitin-proteasome system by Parkin is critical for mitophagy. Hum Mol Genet 20, 1726–1737. [DOI] [PMC free article] [PubMed] [Google Scholar]
- Daley D, Mani VR, Mohan N, Akkad N, Pandian G, Savadkar S, Lee KB, Torres-Hernandez A, Aykut B, Diskin B, et al. (2017). NLRP3 signaling drives macrophage-induced adaptive immune suppression in pancreatic carcinoma. The Journal of experimental medicine. [DOI] [PMC free article] [PubMed] [Google Scholar]
- Geisler S, Holmstrom KM, Skujat D, Fiesel FC, Rothfuss OC, Kahle PJ, and Springer W (2010). PINK1/Parkin-mediated mitophagy is dependent on VDAC1 and p62/SQSTM1. Nat Cell Biol 12, 119–131. [DOI] [PubMed] [Google Scholar]
- Gout J, Pommier RM, Vincent DF, Kaniewski B, Martel S, Valcourt U, and Bartholin L (2013). Isolation and culture of mouse primary pancreatic acinar cells. Journal of visualized experiments : JoVE. [DOI] [PMC free article] [PubMed] [Google Scholar]
- Hay N (2016). Reprogramming glucose metabolism in cancer: can it be exploited for cancer therapy? Nature reviews. Cancer 16, 635–649. [DOI] [PMC free article] [PubMed] [Google Scholar]
- Hingorani SR, Petricoin EF, Maitra A, Rajapakse V, King C, Jacobetz MA, Ross S, Conrads TP, Veenstra TD, Hitt BA, et al. (2003). Preinvasive and invasive ductal pancreatic cancer and its early detection in the mouse. Cancer Cell 4, 437–450. [DOI] [PubMed] [Google Scholar]
- Hoque R, Sohail M, Malik A, Sarwar S, Luo Y, Shah A, Barrat F, Flavell R, Gorelick F, Husain S, and Mehal W (2011). TLR9 and the NLRP3 inflammasome link acinar cell death with inflammation in acute pancreatitis. Gastroenterology 141, 358–369. [DOI] [PMC free article] [PubMed] [Google Scholar]
- Hruban RH, Adsay NV, Albores-Saavedra J, Compton C, Garrett ES, Goodman SN, Kern SE, Klimstra DS, Kloppel G, Longnecker DS, et al. (2001). Pancreatic intraepithelial neoplasia: a new nomenclature and classification system for pancreatic duct lesions. The American journal of surgical pathology 25, 579–586. [DOI] [PubMed] [Google Scholar]
- Kang R, Chen R, Xie M, Cao L, Lotze MT, Tang D, and Zeh HJ 3rd (2016a). The Receptor for Advanced Glycation End Products Activates the AIM2 Inflammasome in Acute Pancreatitis. J Immunol 196, 4331–4337. [DOI] [PMC free article] [PubMed] [Google Scholar]
- Kang R, Chen R, Zhang Q, Hou W, Wu S, Cao L, Huang J, Yu Y, Fan XG, Yan Z, et al. (2014a). HMGB1 in health and disease. Molecular aspects of medicine 40, 1–116. [DOI] [PMC free article] [PubMed] [Google Scholar]
- Kang R, Tang D, Schapiro NE, Loux T, Livesey KM, Billiar TR, Wang H, Van Houten B, Lotze MT, and Zeh HJ (2014b). The HMGB1/RAGE inflammatory pathway promotes pancreatic tumor growth by regulating mitochondrial bioenergetics. Oncogene 33, 567–577. [DOI] [PMC free article] [PubMed] [Google Scholar]
- Kang R, Xie Y, Zhang Q, Hou W, Jiang Q, Zhu S, Liu J, Zeng D, Wang H, Bartlett DL, et al. (2017a). Intracellular HMGB1 as a novel tumor suppressor of pancreatic cancer. Cell Res 27, 916–932. [DOI] [PMC free article] [PubMed] [Google Scholar]
- Kang R, Xie Y, Zhang Q, Hou W, Jiang Q, Zhu S, Liu J, Zeng D, Wang H, Bartlett DL, et al. (2017b). Intracellular HMGB1 as a novel tumor suppressor of pancreatic cancer. Cell research. [DOI] [PMC free article] [PubMed] [Google Scholar]
- Kang R, Zeng L, Xie Y, Yan Z, Zhou B, Cao L, Klionsky DJ, Tracey KJ, Li J, Wang H, et al. (2016b). A novel PINK1- and PARK2-dependent protective neuroimmune pathway in lethal sepsis. Autophagy 12, 2374–2385. [DOI] [PMC free article] [PubMed] [Google Scholar]
- Klionsky DJ (2007). Autophagy: from phenomenology to molecular understanding in less than a decade. Nature reviews. Molecular cell biology 8, 931–937. [DOI] [PubMed] [Google Scholar]
- Lee KE, Spata M, Bayne LJ, Buza EL, Durham AC, Allman D, Vonderheide RH, and Simon MC (2016). Hif1a Deletion Reveals Pro-Neoplastic Function of B Cells in Pancreatic Neoplasia. Cancer discovery 6, 256–269. [DOI] [PMC free article] [PubMed] [Google Scholar]
- Maes H, Kuchnio A, Peric A, Moens S, Nys K, De Bock K, Quaegebeur A, Schoors S, Georgiadou M, Wouters J, et al. (2014). Tumor vessel normalization by chloroquine independent of autophagy. Cancer cell 26, 190–206. [DOI] [PubMed] [Google Scholar]
- Malik AN, Czajka A, and Cunningham P (2016). Accurate quantification of mouse mitochondrial DNA without co-amplification of nuclear mitochondrial insertion sequences. Mitochondrion 29, 59–64. [DOI] [PubMed] [Google Scholar]
- Mancias JD, Wang X, Gygi SP, Harper JW, and Kimmelman AC (2014). Quantitative proteomics identifies NCOA4 as the cargo receptor mediating ferritinophagy. Nature 509, 105–109. [DOI] [PMC free article] [PubMed] [Google Scholar]
- Paradkar PN, Zumbrennen KB, Paw BH, Ward DM, and Kaplan J (2009). Regulation of mitochondrial iron import through differential turnover of mitoferrin 1 and mitoferrin 2. Molecular and cellular biology 29, 1007–1016. [DOI] [PMC free article] [PubMed] [Google Scholar]
- Perera RM, Stoykova S, Nicolay BN, Ross KN, Fitamant J, Boukhali M, Lengrand J, Deshpande V, Selig MK, Ferrone CR, et al. (2015). Transcriptional control of autophagy-lysosome function drives pancreatic cancer metabolism. Nature 524, 361–365. [DOI] [PMC free article] [PubMed] [Google Scholar]
- Peyssonnaux C, Nizet V, and Johnson RS (2008). Role of the hypoxia inducible factors HIF in iron metabolism. Cell Cycle 7, 28–32. [DOI] [PubMed] [Google Scholar]
- Reichert M, Takano S, Heeg S, Bakir B, Botta GP, and Rustgi AK (2013). Isolation, culture and genetic manipulation of mouse pancreatic ductal cells. Nature protocols 8, 1354–1365. [DOI] [PMC free article] [PubMed] [Google Scholar]
- Rooney JP, Ryde IT, Sanders LH, Howlett EH, Colton MD, Germ KE, Mayer GD, Greenamyre JT, and Meyer JN (2015). PCR based determination of mitochondrial DNA copy number in multiple species. Methods Mol Biol 1241, 23–38. [DOI] [PMC free article] [PubMed] [Google Scholar]
- Rosenfeldt MT, O’Prey J, Morton JP, Nixon C, MacKay G, Mrowinska A, Au A, Rai TS, Zheng L, Ridgway R, et al. (2013). p53 status determines the role of autophagy in pancreatic tumour development. Nature 504, 296–300. [DOI] [PubMed] [Google Scholar]
- Semenza GL (2013). HIF-1 mediates metabolic responses to intratumoral hypoxia and oncogenic mutations. J Clin Invest 123, 3664–3671. [DOI] [PMC free article] [PubMed] [Google Scholar]
- Shaw GC, Cope JJ, Li L, Corson K, Hersey C, Ackermann GE, Gwynn B, Lambert AJ, Wingert RA, Traver D, et al. (2006). Mitoferrin is essential for erythroid iron assimilation. Nature 440, 96–100. [DOI] [PubMed] [Google Scholar]
- Song X, Zhu S, Xie Y, Liu J, Sun L, Zeng D, Wang P, Ma X, Kroemer G, Bartlett DL, et al. (2018). JTC801 Induces pH-dependent Death Specifically in Cancer Cells and Slows Growth of Tumors in Mice. Gastroenterology 154, 1480–1493. [DOI] [PMC free article] [PubMed] [Google Scholar]
- Sousa CM, Biancur DE, Wang X, Halbrook CJ, Sherman MH, Zhang L, Kremer D, Hwang RF, Witkiewicz AK, Ying H, et al. (2016). Pancreatic stellate cells support tumour metabolism through autophagic alanine secretion. Nature 536, 479–483. [DOI] [PMC free article] [PubMed] [Google Scholar]
- Sun X, Ou Z, Chen R, Niu X, Chen D, Kang R, and Tang D (2016). Activation of the p62-Keap1-NRF2 pathway protects against ferroptosis in hepatocellular carcinoma cells. Hepatology 63, 173–184. [DOI] [PMC free article] [PubMed] [Google Scholar]
- Tang D, Kang R, Livesey KM, Cheh CW, Farkas A, Loughran P, Hoppe G, Bianchi ME, Tracey KJ, Zeh HJ 3rd, and Lotze MT (2010). Endogenous HMGB1 regulates autophagy. J Cell Biol 190, 881–892. [DOI] [PMC free article] [PubMed] [Google Scholar]
- Tang D, Kang R, Livesey KM, Kroemer G, Billiar TR, Van Houten B, Zeh HJ 3rd, and Lotze MT (2011). High-mobility group box 1 is essential for mitochondrial quality control. Cell Metab 13, 701–711. [DOI] [PMC free article] [PubMed] [Google Scholar]
- Viale A, Pettazzoni P, Lyssiotis CA, Ying H, Sanchez N, Marchesini M, Carugo A, Green T, Seth S, Giuliani V, et al. (2014). Oncogene ablation-resistant pancreatic cancer cells depend on mitochondrial function. Nature 514, 628–632. [DOI] [PMC free article] [PubMed] [Google Scholar]
- Voigt A, Berlemann LA, and Winklhofer KF (2016). The mitochondrial kinase PINK1: functions beyond mitophagy. J Neurochem 139 Suppl 1, 232–239. [DOI] [PubMed] [Google Scholar]
- Watada H, and Fujitani Y (2015). Minireview: Autophagy in pancreatic beta-cells and its implication in diabetes. Mol Endocrinol 29, 338–348. [DOI] [PMC free article] [PubMed] [Google Scholar]
- Wilson JE, Petrucelli AS, Chen L, Koblansky AA, Truax AD, Oyama Y, Rogers AB, Brickey WJ, Wang Y, Schneider M, et al. (2015). Inflammasome-independent role of AIM2 in suppressing colon tumorigenesis via DNA-PK and Akt. Nature medicine 21, 906–913. [DOI] [PMC free article] [PubMed] [Google Scholar]
- Xie Y, Zhu S, Zhong M, Yang M, Sun X, Liu J, Kroemer G, Lotze M, Zeh HJ 3rd, Kang R, and Tang D (2017). Inhibition of Aurora Kinase A Induces Necroptosis in Pancreatic Carcinoma. Gastroenterology 153, 1429–1443 e1425. [DOI] [PMC free article] [PubMed] [Google Scholar]
- Yang S, Wang X, Contino G, Liesa M, Sahin E, Ying H, Bause A, Li Y, Stommel JM, Dell’antonio G, et al. (2011). Pancreatic cancers require autophagy for tumor growth. Genes & development 25, 717–729. [DOI] [PMC free article] [PubMed] [Google Scholar]
- Yoshii SR, Kishi C, Ishihara N, and Mizushima N (2011). Parkin mediates proteasome-dependent protein degradation and rupture of the outer mitochondrial membrane. J Biol Chem 286, 19630–19640. [DOI] [PMC free article] [PubMed] [Google Scholar]
- Youle RJ, and Narendra DP (2011). Mechanisms of mitophagy. Nature reviews. Molecular cell biology 12, 9–14. [DOI] [PMC free article] [PubMed] [Google Scholar]
- Zhu S, Zhang Q, Sun X, Zeh HJ 3rd, Lotze MT, Kang R, and Tang D (2017). HSPA5 Regulates Ferroptotic Cell Death in Cancer Cells. Cancer Res 77, 2064–2077. [DOI] [PMC free article] [PubMed] [Google Scholar]
Associated Data
This section collects any data citations, data availability statements, or supplementary materials included in this article.