Abstract
Multiple myeloma (MM) is a currently incurable blood cancer. Here we tested the effects of a small compound bigelovin on MM cells, and reported that it caused cell cycle arrest and subsequently induced apoptosis. Bigelovin triggered proteolysis of E2F1, which could be inhibited by caspase inhibitor. To investigate the clinical relevance, the expression of E2F1 in MM specimens was tested, and the results showed that E2F1 was overexpressed in 25–57% of MM patients and was associated with higher International Staging System (ISS) stage. These results suggest that E2F1 may be important for MM pathogenesis, and bigelovin could serve as a lead compound for the development of E2F1 inhibitor.
A natural compound bigelovin arrests cell cycle at S phase by triggering proteolysis of oncoprotein E2F1, which is overexpressed in multiple myeloma cells.

Multiple myeloma (MM) is a type of blood cancer formed by malignant plasma cells and characterized by monoclonal protein in the blood or urine and associated organ dysfunction. It can be stratified into three stages by an International Staging System (ISS) based on the serum β2‐microglobulin (β2M) and albumin, which is helpful for predicting treatment response and outcome.1 High morbidity, difficulty to diagnose at an early stage, and palindromia, are the major features of this currently incurable disease.
Aberration in cell cycle has been shown to be one of the major features of human cancers. Normally in late G1 phase and prior to entering S phase, cells pass through the restriction point, which is mainly controlled by the retinoblastoma (Rb) and E2F family proteins.2, 3 When Rb is inactivated by cyclin D1/CDK4/6‐mediated phosphorylation and subsequent degradation, E2F transcription factors are released, resulting in transcription of a range of targets including cyclin E, cyclin A, proliferating cell nuclear antigen (PCNA), dihydrofolate reductase (DHFR), thymidylate synthase (TS), DNA polymerase α and others, and progression into S phase.3, 4, 5 In MM cells, Rb protein is expressed mostly in its phosphorylated form,6 and its deletion does not result in a shortening in the survival of MM patients,7 suggesting that its target proteins, the E2Fs, may be de‐regulated and thus promoting MM progression. Abnormal E2F1 gene expression and/or E2F1 amplification are seen in many types of human cancers,4, 5 and a few studies showed that in the bone marrow (BM) biopsy specimens of MM cases, E2F‐1 was concurrently expressed with cyclin D1.8, 9 However, the role of E2F1 in MM pathogenesis remains unclear, and whether E2F1 inactivation could lead to MM recession or not warrants further investigation.
Bigelovin is a sesquiterpene lactone (Fig. 1a) isolated from Inula helianthus‐aquatica C. Y. Wu or Inula britannica L. var. chinensis (Rupr.) Reg. (Compositae) which are used in traditional medicine to treat asthma, chronic bronchitis, and acute pleurisy in China and Korea.10 Bigelovin was identified as a selective RXRα agonist,11 and was shown to be able to inhibit inflammatory monocyte adhesion to endothelial cells,12 and have anti‐emetic activity.13 Bigelovin exhibits cytotoxic effects against human cancer cells including COLO 205, HT 29, HL‐60, K562 and U937 cells.14, 15, 16 In this study we test the effects of bigelovin on MM cells and investigate the underlying mechanisms of action.
Figure 1.
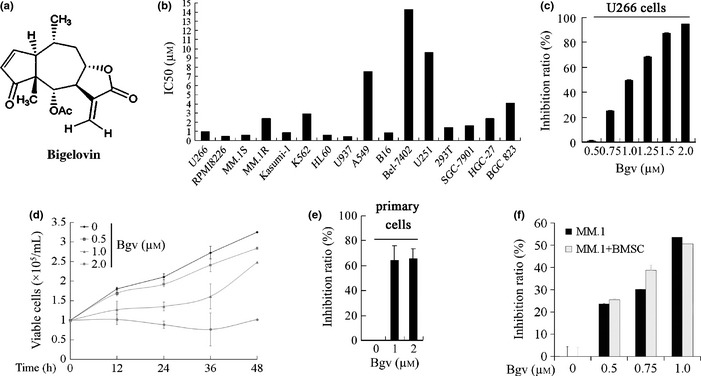
Inhibitory effects on Bigelovin on multiple myeloma (MM) cells. (a) Chemical structure of bigelovin. (b) The concentration of bigelovin required to inhibits 50% of cell growth (IC 50) in various cell lines. (c) U266 cells were treated with bigelovin (Bgv) for 24 h and assessed by MTT assay, and inhibition rate was calculated. (d) U266 cells were treated with Bgv and cell viability was assayed by trypan blue exclusion analysis. (e) The CD138+ primary cells were treated with Bgv for 24 h and assessed by MTT assay, and inhibition rate was calculated. (f) MM.1S cells were co‐cultured with bone marrow stromal cells (BMSCs) from one MM patient, treated with Bgv for 24 h, and evaluated by MTT assay.
Materials and Methods
Reagents
Bigelovin was prepared and provided by Professor Ning‐Hua Tan and was dissolved in dimethyl sulfoxide at a concentration of 1×10⁻² M and stored at −20°C.16 Cycloheximide (Chx), MG132, phenylmethylsulfonyl fluoride (PMSF), pepstatin A and 1,10 – phenanthroline (Phe) were purchased from Sigma (St. Louis, MO, USA). PS341, chloroquine (Chl) and ammonium chloride (NH4Cl) were attained from Millennium Pharmaceutical (Cambridge, MA, USA), Shanghai Yuanji Chemical (Shanghai, China) and Qianhui (Guagnzhou, China), respectively. Iodoacetamide (IAA) was purchased from Amresco (Solon, OH, USA), Z‐VAD‐fmk was purchased from Promega (Southampton, UK), and Calpeptin was purchased from Tocris Bioscience (Minneapolis, MO, USA).
Patient samples
Use of patient samples was approved by the Institutional Review Board of the Nanfang Hospital Affiliated to Nanfang Medical University and Institute of Zoology, Chinese Academy of Sciences. All BM and peripheral blood samples were obtained with written informed consent from patients or healthy donors at the Department of Hematology, Nanfang Hospital. These BM samples included nine from healthy donors, four from Non‐Hodgkin lymphoma (NHL) and 27 from MM patients. The mononuclear cells were separated by Ficoll‐Hipaque density sedimentation, and CD138+ cells were isolated using positive immunomagnetic column separation (Miltenyi Biotech, Auburn, CA, USA) from BM mononuclear cells (BMMCs) from 13 patients with MM, four patients with non‐Hodgkin's Lymphoma (NHL), and three healthy donors. Bone marrow stromal cells (BMSCs) were obtained from a MM patient‐derived CD138‐negative BM mononuclear cells cultured for 5 weeks.17
Immunohistochemical analysis as well as the scoring of immunoreactivity was performed using the rabbit polyclonal anti‐E2F1 or anti‐cyclin D1 antibody.18 The immunofluorescence assay was conducted using anti‐E2F1 and a FITC‐conjugated secondary antibody (Santa Cruz Biotechnology, Dallas, TX, USA).19
Cell culture, cell viability, apoptosis and cell cycle analysis
Human MM cell lines U266, RPMI8226 and MM.1S were cultured as described.19 Cell viability was assessed by 3‐(4,5‐dimethylthiahiazozy1)‐3,5‐di‐phenytetrazoliumromide (MTT) assay and trypan blue dye exclusion analysis. Cell apoptosis was evaluated using an Annexin V‐PE/7‐AAD detection kit (Becton Dickinson, Franklin Lakes, NJ, USA) according to the manufacturer's instructions, and DNA fragmentation was assayed as described. For cell cycle analysis, the cells were synchronized by double blockage with deoxythymidine (TdR; Sigma), exposed to bigelovin at indicated concentrations for 24 h. Cell cycle analysis was performed on a Becton Dickinson FACS Canto.19
Transfection of siRNAs
Three siRNAs targeting E2F1 were designed and synthesized by Shanghai GenePharma (Shanghai, China). The candidate E2F1 targeted siRNA sequences were as follows: siRNA‐1: 5′‐GCUAUGAGACCUCACUGAATT‐3′; siRNA‐2: 5′‐GGACCUUCGUAGCAUUGCATT ‐3′; siRNA‐3: 5′‐CUCCCUUAAGAGCAAACAATT‐3′. Non‐specific siRNA was also purchased from GenePharma. U266 cells were transfected with siRNAs (100 nM) by HiPerFect transfection reagent, according to the manufacturer's instructions (Qiagen, Hilden, Germany). Forty‐eight hours later, the cells were harvested for cell cycle and Western blot analyses.
Semiquantitative RT‐PCR
Total RNA was prepared; first‐strand cDNA was synthesized from 1 μg total RNA using an Oligo‐(dT) primer and SuperScript II reverse transcriptase (Invitrogen, Frederick, MD, USA). Primers used in this study were as follows: β‐actin (sense primer: 5′‐CCTGGCACCCAGCACAAT‐3′; antisense primer: 5′‐GGGCCGGACTCGTCATACT‐3′), E2F1 (sense primer: 5′‐ACCAGGGTTTCCAGAGATGC‐3′; antisense primer: 5′‐CACCACACAGACTCCTTCCC‐3′), Cyclin E (sense primer: 5′‐CACTTTCTTGAGCAACACCCT‐3′; antisense primer: 5′‐TCTGTCACATACGCAAACTGG‐3′), DHFR (sense primer: 5′‐TGGTTCGCTAAACTGCATCGT‐3′; antisense primer: 5′‐AACAGAACTGCCACCAACTATC‐3′), PCNA (sense primer: 5′‐AGGCACTCAAGGACCTCATC‐3′; antisense primer: 5′‐GAAACTTTCTCCTGGTTTGG‐3′), Apaf‐1 (sense primer: 5′‐AGTTGGACACTATTCCTGCTC‐3′; antisense primer: 5′‐AAATAGGTTGGCTGGAAGGT‐3′), and P21WAF (sense primer: 5′‐GCAGACCAGCATGACAGATTT‐3′; antisense primer: 5′‐AAGATGTAGAGCGGGCCTTT‐3′). Products of RT‐PCR was separated by 1% agarose gel electrophoresis and detected in gel imaging system.
Western blot
Cell pellets were lysed, protein samples were quantitated and electrophoresed, transferred to a nitrocellulose membrane (Whatman, Maidstone, UK), and the reaction was performed as described.19 Antibodies used were as follows: anti‐PARP, anti‐Casp‐9 (C9), anti‐Casp‐3, anti‐cleaved Casp‐3, anti‐pRb, anti‐E2F1, anti‐cyclin D1, anti‐cyclin E (Cell Signaling Technology, Beverly, MA, USA), anti‐PCNA, anti‐CDK4 (Santa Cruz), anti‐cyclin A, anti‐IκBα (Abcam, Cambridge, MA, USA), and anti‐β‐actin (Sigma).
Statistical analysis
Differences between groups were evaluated for significance using one‐way analysis of covariance and Bonferroni post‐test. P‐value was derived by two‐sided statistical tests. P‐value < 0.05 was considered statistically significant. All experiments were repeated at least three times independently and data were presented as the mean ± SD unless noted otherwise.
Results
Bigelovin inhibits proliferation of MM cells
By MTT assay, we showed that bigelovin inhibited the proliferation of human MM (U266, RPMI 8226, MM.1S and MM.1R), leukemia (Kasumi‐1, K562, HL60, U937), gastric (SGC7901, HGC‐27, BGC‐823), lung (A549), hepatic cancer (BEL7402), glioma (U251) and mouse melanoma (B16) cell lines, with the IC50 values for MM cells ranging from 0.5 to 0.99 μM (Fig. 1b). We showed that bigelovin inhibited cell proliferation (Fig. 1c) and growth (Fig. 1d) of U266 cells in a dose‐ and time‐dependent fashion. Bigelovin also suppressed proliferation of CD138+ primary MM cells isolated from two MM patients (Fig. 1e). By MTT assay, we found that bigelovin could also inhibit proliferation of MM.1S cells co‐cultured with MM patient‐derived BMSCs (Fig. 1f).
Bigelovin induces S phase arrest and apoptosis in MM cells
To test the effects of bigelovin on cell cycle, U266 cells were synchronized at G1 phase by TdR double blockage, followed by treatment with bigelovin for 24 h. We found that treatment with bigelovin at 1.0–2.0 μM led to accumulation of cells in S phase in a dose‐dependent fashion (Fig. 2a). To confirm these results, we used a widely used microtubule inhibitor nocodazole, which arrests cells in G2/M phase, as a control, and found that while nocodazole accumulated cells in G2/M phase, bigelovin attenuated this effect and caused S phase arrest (Fig. 2a).
Figure 2.
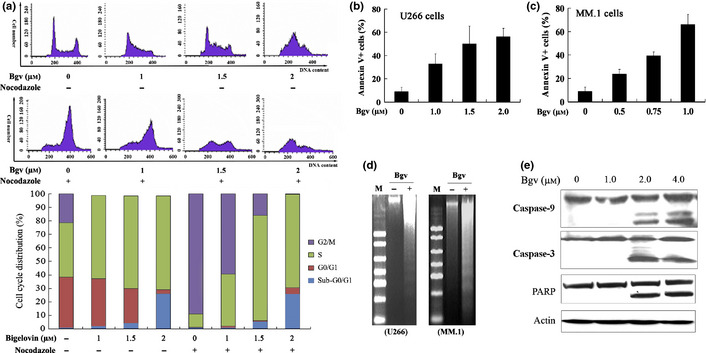
Bigelovin arrests cell cycle and induces apoptosis in multiple myeloma (MM) cells. (a) U266 cells were synchronized, treated with bigelovin and/or nocodazole (20 μM) for 24 h, analyzed by propidium iodide staining and flow cytometry to determine cell cycle distribution. (b, c) The cells were treated with bigelovin for 24 h and analyzed by Annexin V/7‐AAD staining and flow cytometry. (d) DNA fragmentation analysis in U266 and MM.1 cells treated with or without bigelovin. M, DNA marker 2000. (e) The U266 cells upon bigelovin for 12 h were lysed and assayed by Western blot analysis.
To investigate the eventual effect of bigelovin on U266 cells, Annexin V/7‐AAD staining and flow cytometry analysis were performed and the results showed that treatment with bigelovin at 1.0–1.5 μM for 24 h induced apoptosis in U266 cells (Fig. 2b). Bigelovin also induced apoptosis in MM.1 cells (Fig. 2c). These observations were confirmed by DNA fragmentation seen in the cells (Fig. 2d). By Western blot assay, we showed that bigelovin treatment activated casp‐9 and ‐3 with cleavage of PARP in U266 cells (Fig. 2e).
Bigelovin downregulates the expression of E2F1 in MM cells
We investigated the mechanisms underlying bigelovin‐induced S phase arrest by detecting the expression of some important cell cycle regulators in TdR‐synchronized, bigelovin‐treated U266 cells. We found that in cells treated with bigelovin at 1, 2 and 4 μM for 24 h, the expression of pRb, E2F1, CDK4 and Cyclin E was markedly downregulated, while the expression of total Rb, cyclin D1, cyclin A and PCNA was not drastically affected (Fig. 3a). Treatment of U266 cells with bigelovin at 1.5 μM for 8 h led to a decrease of E2F1, which was undetectable at 12 h of treatment time course (Fig. 3b). Moreover, by Western blot (Fig. 3c) and immunofluorescence (Fig. 3d) assays, we found that the expression of E2F1 was downregulated in both the cytoplasmic and nuclear fractions. We then conducted siRNA‐mediated silencing of E2F1 (Fig. 3e), and reported that E2F1 silencing could reduce the cells in G1 phase and increase those in S phase (Fig. 3f), confirming E2F1's role in S phase entry.20
Figure 3.
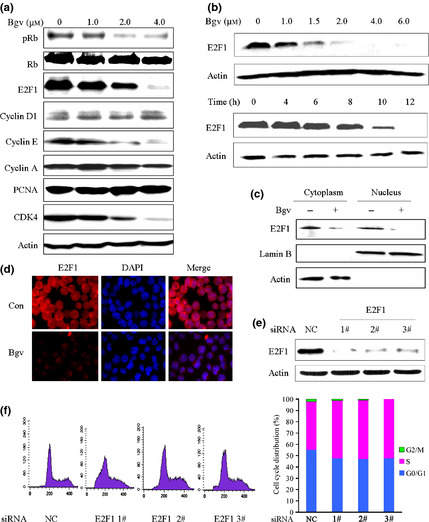
Effects of bigelovin on cell cycle regulators. (a) Synchronized U266 cells were treated with bigelovin for 24 h, lysed, and Western blot assay was performed using the lysates and indicated antibodies. (b) Synchronized U266 cells were treated with bigelovin for 24 h (upper panel) or at 1.5 μM for indicated time points (lower panel), lysed, and Western blot assay was performed. (c) U266 cells were treated with or without bigelovin at 1.5 μM for 24 h, lysed, the cytoplasm and nucleus fractions were isolated and subjected to Western blot assay. (d) U266 cells treated with or without bigelovin at 1.5 μM for 24 h were analyzed by immunofluorescence and confocal microscopy as described in Materials and Methods. (e, f) U266 cells were transfected with indicated siRNA, lysed and subjected to Western blotting (e) or analyzed by propidium iodide staining and flow cytometry to determine cell cycle distribution (f).
Bigelovin triggers proteolysis of E2F1 in MM cells
We investigated the mechanisms underlying bigelovin‐induced E2F1 degradation, and showed that bigelovin treatment did not downregulate E2F1 at mRNA level, while the expression of cyclin E, DHFR and PCNA was decreased (Fig. 4a). In U266 cells upon protein synthesis inhibitor Chx, E2F1 was not decreased at 8 h (Fig. 4b), demonstrating that this protein is stable within MM cells. However, in cells co‐incubated with Chx and bigelovin, E2F1 was downregulated at 2 h and was undetectable in 6 h (Fig. 4b), indicating that bigelovin can cause its proteolytic degradation.
Figure 4.
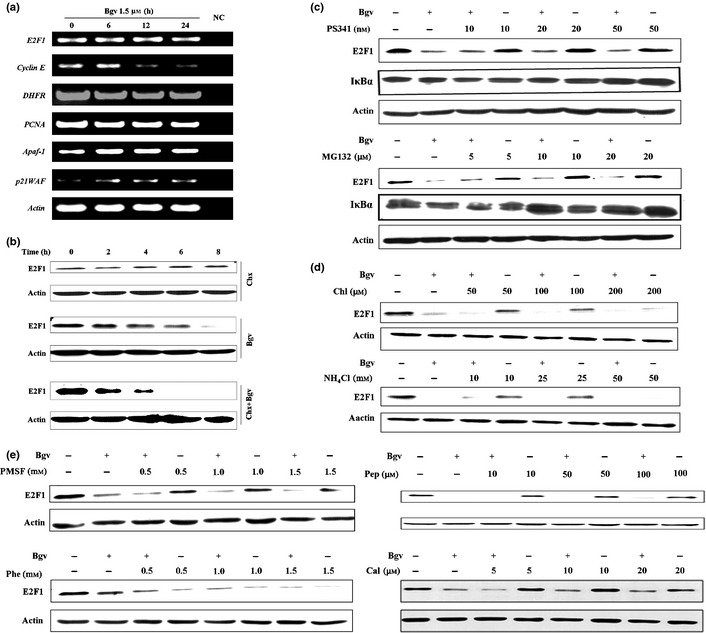
Bigelovin causes degradation of E2F1. (a) U266 cells were treated with bigelovin, RNA was isolated, and reverse transcription‐polymerase chain reaction (RT‐PCR) was conducted to evaluate the expression of indicated genes. (b) The cells were treated with Chx (20 μg/mL) and/or bigelovin (1.5 μM) for indicated time points, lysed, and subjected to Western blotting using indicated antibodies. (c–e) The cells were pre‐treated with indicated inhibitors for 2 h, co‐incubated with bigelovin for additional 24 h, lysed and subjected to Western blot assays.
E2F1 can be degraded by the ubiquitin‐proteasome system.21 We found that I‐κBα was increased in cells treated with PS341 or MG132 (Fig. 4c). However, in U266 cells pre‐treated with PS341 or MG132 for 2 h followed by bigelovin treatment for 24 h, proteolysis of E2F1 was not inhibited (Fig. 4c). Lysosome is an organelle containing a broad array of secluded proteases that can mediate intracellular proteolysis, but its inhibitors Chl and NH4Cl failed to prevent bigelovin‐triggered degradation of E2F1 (Fig. 4d). In addition, serine protease inhibitor PMSF, aspartic protease inhibitor pepstatin A (Pep) and metalloproteinase inhibitor Phe were unable to block E2F1 degradation (Fig. 4e).
Bigelovin causes caspase‐dependent degradation of E2F1
We further dissected the mechanisms underlying bigelovin‐induced E2F1 catabolism and reported that cysteine protease inhibitor IAA markedly inhibited bigelovin‐caused E2F1 degradation in U266 cells (Fig. 5a). Calpain is one type of cysteine protease, but its inhibitor calpeptin failed to suppress E2F1 turnover (Fig. 4e). The apoptosis executioners, caspases, are also cysteine proteases. To investigate whether caspases mediate E2F1 degradation, U266 cells were pre‐treated with pan‐caspase inhibitor z‐VAD.fmk at 50 μM for 1 h, followed by treatment with bigelovin at 2 μM for 24 h. Our results showed that z‐VAD drastically inhibited bigelovin‐triggered E2F1 degradation (Fig. 5b), indicating that E2F1 turnover is mediated by caspases in MM cells.
Figure 5.
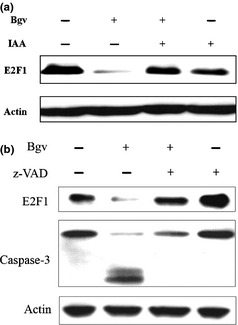
E2F1 degradation is mediated by caspases. (a) U266 cells were pre‐treated with iodoacetamide (IAA) (1 μM) for 2 h, co‐incubated with bigelovin for additional 24 h, lysed and subjected to Western blotting. (b) The cells were pre‐treated with z‐VAD.fmk (50 μM) for 2 h, co‐incubated with bigelovin for additional 24 h, lysed and subjected to Western blotting.
Overexpression of E2F1 in MM samples
We analyzed the expression of E2F1 in 55 samples from MM patients whose baseline characteristics were listed in Table 1. First, the expression of E2F1 in BMMCs isolated from 14 MM patients was tested by semi‐quantitative RT‐PCR, and the BMMCs from six healthy donors were used as controls. To gain a quantitative view, the densitometry analysis was performed and the E2F1 band was normalized against that of β‐Actin, and the E2F1/Actin ratio greater than mean + SD of that of healthy donors was considered as E2F1 overexpression. We found that E2F1 was detected in BMMCs from the six healthy donors and BMMCs from all these 14 patients, and was elevated in 4 (28.6%) cases with MM (Fig. 6a).
Table 1.
Available baseline demographic characteristics of multiple myeloma (MM) patients whose samples were analyzed in this study
| Characteristics | Cases, n | E2F1‐high, n (%) | P ‡ |
|---|---|---|---|
| All | 59 | 21 (35.6) | |
| Gender† | |||
| Male | 22 | 5 (22.7) | 0.23 |
| Female | 23 | 9 (39.1) | |
| Age† | |||
| <65 | 27 | 11 (40.7) | 0.17 |
| ≥65 | 15 | 3 (20.0) | |
| Type of myeloma† | |||
| IgG | 17 | 6 (35.3) | 0.44 |
| IgA | 13 | 4 (30.8) | |
| IgD | 0 | ||
| IgM | 0 | ||
| Light chain | 13 | 7 (53.8) | |
| Nonsecretory | 0 | ||
| ISS stage† | |||
| I | 3 | 0 (0.0) | 0.02 |
| II | 16 | 4 (25.0) | |
| III | 20 | 13 (65.0) | |
| Patients for immunofluorescence analysis | |||
| Gender | |||
| Male | 5 | 1 (20.0) | 0.14 |
| Female | 8 | 5 (62.5) | |
| Age | |||
| <65 | 9 | 5 (55.6) | 0.51 |
| ≥65 | 3 | 1 (33.3) | |
| Type of myeloma | |||
| IgG | 6 | 3 (50.0) | 0.51 |
| IgA | 5 | 1 (20.0) | |
| IgD | 0 | ||
| IgM | 0 | ||
| Light chain | 2 | 2 (100) | |
| Nonsecretory | 0 | ||
| ISS stage | |||
| I | 1 | 0 (0.0) | 0.02 |
| II | 6 | 1 (16.7) | |
| III | 6 | 5 (83.3) | |
†Information of some patients was not available. ‡Chi‐sqaure test.
Figure 6.
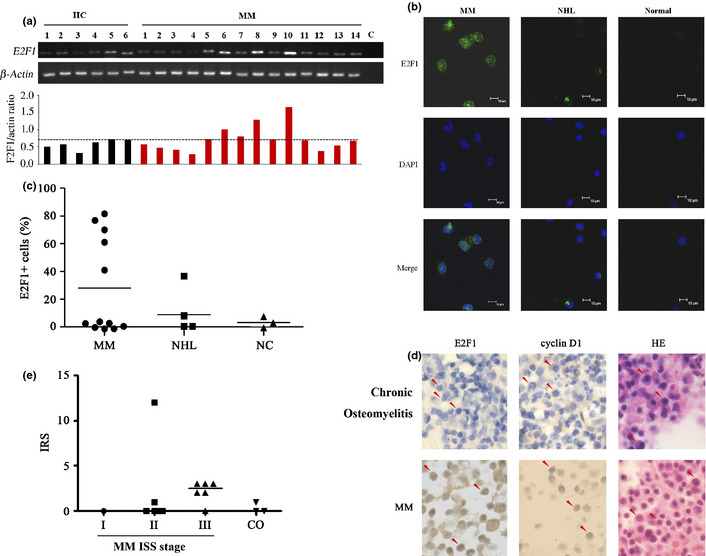
E2F1 is overexpressed in multiple myeloma (MM) cells. (a) Reverse transcription‐polymerase chain reaction (RT‐PCR) analysis of E2F1 in peripheral blood mononuclear cells harvested from healthy donors (HC) or MM patients. (b, c) CD138+ primary MM cells were analyzed by immunofluorescence staining/confocal microscopy as described in Materials and Methods (b) and E2F1 positive cells were calculated in at least 300 cells in continuous field of view (c). Stainings were analyzed using an Olympus BX51 research microscope equipped with a 100×/1.30 numerical aperture (NA) oil objective (Olympus, Tokyo, Japan). Images were processed using Adobe Photoshop CS6 (Adobe Systems, San Jose, CA, USA). Original magnification, ×1000. (d, e) Immunohistochemical analysis of bone marrow specimens of MM patients (d) and related IRS (e).
We performed immunofluorescence analysis to evaluate the expression of E2F1 at protein level in CD138+ cells from 12 MM cases as well as from patients with non‐Hodgkin's Lymphoma (NHL) and three samples from healthy donors. We found that in five of 12 (41.7%) patients the percentage of E2F1+ cells was above 40%, while none of the samples from NHL cases or healthy controls had E2F1+ cells more than 40% (Fig. 6b,c). We further performed immunohistochemical analysis to assess E2F1 level in MM samples, and the results showed that E2F1 signal was stronger in plasma cells from MM patients than from chronic osteomyelitis (CO) patients, whose plasma cells are relatively normal (Fig. 6d). The immunoreactivity score (IRS) was calculated,18 and the results showed that the IRS of plasma cells from MM patients is significantly higher than that of plasma cells from CO patients (Fig. 6e). We also showed that cyclin D1 was overexpressed in 13 of 32 (40.6%) MM cases (Fig. 6d).
Overexpression of E2F1 is associated with higher ISS stage
We analyzed the relationship between E2F1 expression and the ISS stage, and showed that among the 39 patients evaluated, E2F1 overexpression was found in 0/3 (0%) of patients in ISS stage I, 4/16 (25%) of cases in ISS stage II, and 13/20 (65%) of those in ISS stage III (P = 0.02; Table 1). In patients whose samples were subjected to immunofluorescence analysis, the expression of E2F1 was high in 0/1 (%) of cases in ISS stage I, 1/6 (16.7%) cases in ISS stage II and 5/6 (83.3%) of patients in ISS stage III (Table 1). Similarly, in patients whose samples were detected by immunohistochemical assay, the expression of E2F1 was high in 2/6 (33.3%) cases in ISS stage I and II, and 3/6 (50%) patients in ISS stage III (Fig. 6e). These results demonstrate that E2F1 is overexpressed in higher ISS stages. We further showed that the expression of E2F1 was high in 4/17 (23.5%) de novo patients, and in 9/17 (53.9%) relapsed case (P = 0.07; Table 2).
Table 2.
E2F1 overexpression is associated with relapsed multiple myeloma (MM)
| Characteristics | Cases, n | E2F1‐high, n (%) | P‐valuea |
|---|---|---|---|
| All | |||
| De novo | 17 | 4 (23.5) | 0.07 |
| Relapse | 17 | 9 (52.9) | |
| Patients for immunohistochemical analysis | |||
| De novo | 10 | 2 (20.0) | 0.22 |
| Relapse | 11 | 5 (45.5) | |
| Patients for immunofluorescence analysis | |||
| De novo | 7 | 2 (28.6) | 0.17 |
| Relapse | 6 | 4 (66.7) | |
Chi‐square test.
Discussion
By using small molecules including medicinal compounds as probes, chemical biology can not only reveal key factors/pathways involved in physiology and human diseases, but also provide new drug leads or novel utilities of existing drugs. In this study, we tested the effects of bigelovin on MM cells and investigated its mechanisms of action, and reported that this natural compound induced S phase arrest followed by apoptosis in cell lines and CD138+ primary MM cells (Figs 1, 2). While bigelovin could not perturb the expression of cyclin D1, it triggered a caspase‐mediated E2F1 degradation (Figs 3, 4). E2F1 silencing by specific siRNA also resulted in S phase arrest (Fig. 3e,f), suggesting that bigelovin‐caused cell cycle arrest might at least partially due to its effect to E2F1, and the role of this transcription factor in MM pathogenesis warrants further investigation.
E2F1 has been identified as a tumor suppressor regulating the activities of p53, and promoting apoptosis by the activation of a plethora of death pathways including caspases and Apaf‐1.22, 23 However, E2F1 is also shown to be able to inhibit c‐Myc‐driven apoptosis in human and in rodent liver cancer through its ability to counteract c‐Myc‐driven apoptosis via activation of PIK3CA/Akt/mTOR and c‐Myb/COX‐2 pathways.24 Recent studies in knockout and transgenic mouse models indicated that E2F1‐3 bear an unexpected pro‐survival role in development and cell survival.25, 26 As the founding member of the E2F family, which plays a critical role in cell‐cycle progression and induction of apoptosis in response to DNA damage, E2F1 was reported to be overexpressed and inversely associated with prognosis in many types of human cancer, that is, bladder tumors,27 melanoma,28 breast and ovarian cancers.4, 29 E2F1 is also highly expressed in stomach cancer,30 B‐cell chronic lymphocytic leukemia,31 non‐small cell lung cancer,32 metastatic colorectal cancer,33 and sporadic Burkitt's lymphoma.34 E2F1 was shown to be expressed in 25 of 72 (35%) MM cases and was concurrently expressed with cyclin D1.8 In this study, we showed that E2F1 was increased in 25–57% of MM patients evaluated by RT‐PCR, immunofluorescence, and immunohistochemical analyses, and was associated with higher ISS stage. Though the sample size of our setting was relatively small and the P‐values do not reach a significant level (<0.05), our results suggest an increased level of E2F1 in relapsed patients than in de novo cases (Table 2). These results indicate that the role for E2F1 to play in the pathogenesis of MM, for example, promoting proliferation and/or cell survival, needs to be determined.
E2F1 protein abundance can be regulated by the ubiquitin proteasome‐dependent degradation pathway.21, 35, 36, 37 We tested whether bigelovin‐induced E2F1 turnover was mediated by proteasome or not, and found that proteasome inhibitors PS341 and MG132 failed to protect E2F1 from bigelovin‐triggered catabolism (Fig. 4), excluding proteasome's role in this process. Similarly, lysosome inhibitors Chl and NH4Cl could not inhibit E2F1 catabolism (Fig. 4). We further investigated the mechanisms underlying E2F1 turnover. Generally, there are four classes of proteolytic enzymes: serine proteases, metalloproteinase, aspartic protease and cysteine protease.38 We showed that serine protease inhibitor PMSF, metalloproteinase inhibitor Phe, or aspartic protease inhibitor pepstatin A could not inhibit bigelovin‐caused E2F1 catabolism (Fig. 4). Intriguingly, cysteine protease inhibitor IAA was able to reverse E2F1 proteolysis by bigelovin treatment (Fig. 5). There are three kinds of cysteine proteases in cells: gathepsin, caspase and calpain. Given that gathepsin, which is mainly located in lysosome and calpain did not mediate E2F1 turnover (Fig. 4), we tested caspases' role by using z‐VAD‐fmk and found that this inhibitor markedly blocked bigelovin‐triggered E2F1 catabolism (Fig. 5). Indeed, bigelovin activated casp‐9 and ‐3 concomitant with cleavage of casp‐3 specific substrate PARP (Fig. 2), suggesting that E2F1 is also a substrate of casp‐3.
The potential aberrance of caspases and the roles for caspases to play in pathogenesis of myeloma have been tested in a few studies. For example, a population‐based case‐control study was conducted to examine if single nucleotide polymorphisms (SNPs) in Casp‐3, Casp‐8, Casp‐9, and Casp‐10 alter multiple myeloma risk, and the results suggested that genetic variation in CASP genes may have a role in the etiology of MM.39 Casp‐1, 2, 3, 4, 6, 7, 8, 9, and 10 were expressed in myeloma cells,40 and Casp‐10 was required for myeloma cell survival.41 Rare mutations in Casp‐10, 3, 9, or ‐8 were detected in MM patients.42, 43 These results indicate that caspases' aberrancy is rare in MM, therefore bigelovin can exert its effects in primary myeloma cells.
E2F1 can not only promote cell survival,25, 26 but also induces metastasis and mediates chemoresistance.4 Malignant and, in particular, drug‐resistant cells are “addicted” to high levels of E2F1 activity, rendering them vulnerable to E2F1 inhibition. Inactivating E2F1 reverts apoptosis resistance and cancer sensitivity in Trp53‐deficient mice.44 These results suggest that E2F1 may represent a therapeutic target for cancers. Small compounds, for example, bigelovin and largazole, which triggers a proteasomal degradation of E2F1,45 could serve as lead compounds for the development of E2F1 inhibitors. However, E2F1 was not overexpressed in some primary myeloma cells, suggesting these cells might not be sensitive to E2F1‐targeting remedies, therefore other novel therapeutic strategies should be explored to combat this deadly disease.
Disclosure Statement
The authors have no conflict of interests.
Acknowledgments
This work was supported by the National Key Program for Basic Research (2010CB529200, 2012CB910800), the National Natural Science Foundation (81071930 and 81171925), and the Strategic Priority Research Programme of Chinese Academy of Sciences.
(Cancer Sci 2013; 104: 1697–1704)
References
- 1. Greipp PR, Miguel JS, Durie BGM et al International staging system for multiple myeloma. J Clin Oncol 2005; 23: 3412–20. [DOI] [PubMed] [Google Scholar]
- 2. Massague J. G1 cell‐cycle control and cancer. Nature 2004; 432: 298–306. [DOI] [PubMed] [Google Scholar]
- 3. Shah MA, Schwartz GK. Cell cycle‐mediated drug resistance: an emerging concept in cancer therapy. Clin Cancer Res 2001; 7: 2168–81. [PubMed] [Google Scholar]
- 4. Engelmann D, Putzer BM. The dark side of E2F1: in transit beyond apoptosis. Cancer Res 2012; 72: 571–5. [DOI] [PubMed] [Google Scholar]
- 5. Chen HZ, Tsai SY, Leone G. Emerging roles of E2Fs in cancer: an exit from cell cycle control. Nat Rev Cancer 2009; 9: 785–97. [DOI] [PMC free article] [PubMed] [Google Scholar]
- 6. Kanavaros P, Stefanaki K, Vlachonikolis J et al Immunohistochemical expression of the p53, p21/Waf‐1, Rb, p16 and Ki67 proteins in multiple myeloma. Anticancer Res 2000; 20: 4619–25. [PubMed] [Google Scholar]
- 7. Gutierrez NC, Castellanos MV, Martin ML et al Prognostic and biological implications of genetic abnormalities in multiple myeloma undergoing autologous stem cell transplantation: t(4; 14) is the most relevant adverse prognostic factor, whereas RB deletion as a unique abnormality is not associated with adverse prognosis. Leukemia 2006; 21: 143–50. [DOI] [PubMed] [Google Scholar]
- 8. Wilson CS, Butch AW, Lai R et al Cyclin D1 and E2F‐1 immunoreactivity in bone marrow biopsy specimens of multiple myeloma: relationship to proliferative activity, cytogenetic abnormalities and DNA ploidy. Br J Haematol 2001; 112: 776–82. [DOI] [PubMed] [Google Scholar]
- 9. Lai R, Medeiros LJ, Wilson CS et al Expression of the cell‐cycle‐related proteins E2F‐1, p53, mdm‐2, p21waf‐1, and Ki‐67 in multiple myeloma: correlation with cyclin‐D1 immunoreactivity. Mod Pathol 1998; 11: 642–7. [PubMed] [Google Scholar]
- 10. Parker BA, Geissman TA. Sesquiterpenoid lactones of Helenium bigelovii gray. J Org Chem 1962; 27: 4127–32. [Google Scholar]
- 11. Zhang H, Li L, Chen L et al Structure basis of bigelovin as a selective RXR agonist with a distinct binding mode. J Mol Biol 2011; 407: 13–20. [DOI] [PubMed] [Google Scholar]
- 12. Nam KW, Oh GT, Seo EK et al Nuclear factor kappaB‐mediated down‐regulation of adhesion molecules: possible mechanism for inhibitory activity of bigelovin against inflammatory monocytes adhesion to endothelial cells. J Ethnopharmacol 2009; 123: 250–6. [DOI] [PubMed] [Google Scholar]
- 13. Kinoshita K, Kawai T, Imaizumi T et al Anti‐emetic principles of Inula linariaefolia flowers and Forsythia suspensa fruits. Phytomedicine 1996; 3: 51–8. [DOI] [PubMed] [Google Scholar]
- 14. Bai N, Lai CS, He K et al Sesquiterpene lactones from Inula britannica and their cytotoxic and apoptotic effects on human cancer cell lines. J Nat Prod 2006; 69: 531–5. [DOI] [PubMed] [Google Scholar]
- 15. Park EJ, Kim J. Cytotoxic sesquiterpene lactones from Inula britannica . Planta Med 1998; 64: 752–4. [DOI] [PubMed] [Google Scholar]
- 16. Zeng GZ, Tan NH, Ji CJ et al Apoptosis inducement of bigelovin from Inula helianthus‐aquatica on human leukemia U937 cells. Phytother Res 2009; 23: 885–91. [DOI] [PubMed] [Google Scholar]
- 17. Yasui H, Hideshima T, Raje N et al FTY720 induces apoptosis in multiple myeloma cells and overcomes drug resistance. Cancer Res 2005; 65: 7478–84. [DOI] [PubMed] [Google Scholar]
- 18. Wang YY, Zhou GB, Yin T et al AML1‐ETO and C‐KIT mutation/overexpression in t(8; 21) leukemia: implication in stepwise leukemogenesis and response to Gleevec. Proc Natl Acad Sci USA 2005; 102: 1104–9. [DOI] [PMC free article] [PubMed] [Google Scholar]
- 19. Liu Y, Chen XQ, Liang HX et al Small compound 6‐O‐angeloylplenolin induces mitotic arrest and exhibits therapeutic potentials in multiple myeloma. PLoS ONE 2011; 6: e21930. [DOI] [PMC free article] [PubMed] [Google Scholar]
- 20. Duronio RJ, O'Farrell PH, Xie JE, Brook A, Dyson N. The transcription factor E2F is required for S phase during Drosophila embryogenesis. Genes Dev 1995; 9: 1445–55. [DOI] [PubMed] [Google Scholar]
- 21. Hateboer G, Kerkhoven RM, Shvarts A, Bernards R, Beijersbergen RL. Degradation of E2F by the ubiquitin‐proteasome pathway: regulation by retinoblastoma family proteins and adenovirus transforming proteins. Genes Dev 1996; 10: 2960–70. [DOI] [PubMed] [Google Scholar]
- 22. Engelmann D, Putzer BM. Translating DNA damage into cancer cell death‐A roadmap for E2F1 apoptotic signalling and opportunities for new drug combinations to overcome chemoresistance. Drug Resist Updates 2010; 13: 119–31. [DOI] [PubMed] [Google Scholar]
- 23. Muller H, Bracken AP, Vernell R et al E2Fs regulate the expression of genes involved in differentiation, development, proliferation, and apoptosis. Genes Dev 2001; 15: 267–85. [DOI] [PMC free article] [PubMed] [Google Scholar]
- 24. Ladu S, Calvisi DF, Conner EA et al E2F1 inhibits c‐Myc‐driven apoptosis via PIK3CA/Akt/mTOR and COX‐2 in a mouse model of human liver cancer. Gastroenterology 2008; 135: 1322–32. [DOI] [PMC free article] [PubMed] [Google Scholar]
- 25. Chen D, Pacal M, Wenzel P et al Division and apoptosis of E2f‐deficient retinal progenitors. Nature 2009; 462: 925–9. [DOI] [PMC free article] [PubMed] [Google Scholar]
- 26. Chong JL, Wenzel PL, Saenz‐Robles MT et al E2f1‐3 switch from activators in progenitor cells to repressors in differentiating cells. Nature 2009; 462: 930–4. [DOI] [PMC free article] [PubMed] [Google Scholar]
- 27. Lee JS, Leem SH, Lee SY et al Expression signature of E2F1 and its associated genes predict superficial to invasive progression of bladder tumors. J Clin Oncol 2010; 28: 2660–7. [DOI] [PubMed] [Google Scholar]
- 28. Alla V, Engelmann D, Niemetz A et al E2F1 in melanoma progression and metastasis. J Natl Cancer Inst 2010; 102: 127–33. [DOI] [PubMed] [Google Scholar]
- 29. Hallstrom TC, Mori S, Nevins JR. An E2F1‐dependent gene expression program that determines the balance between proliferation and cell death. Cancer Cell 2008; 13: 11–22. [DOI] [PMC free article] [PubMed] [Google Scholar]
- 30. Suzuki T, Yasui W, Yokozaki H et al Expression of the E2F family in human gastrointestinal carcinomas. Int J Cancer 1999; 81: 535–8. [DOI] [PubMed] [Google Scholar]
- 31. Korz C, Pscherer A, Benner A et al Evidence for distinct pathomechanisms in B‐cell chronic lymphocytic leukemia and mantle cell lymphoma by quantitative expression analysis of cell cycle and apoptosis‐associated genes. Blood 2002; 99: 4554–61. [DOI] [PubMed] [Google Scholar]
- 32. Huang CL, Liu D, Nakano J et al E2F1 overexpression correlates with thymidylate synthase and survivin gene expressions and tumor proliferation in non small‐cell lung cancer. Clin Cancer Res 2007; 13: 6938–46. [DOI] [PubMed] [Google Scholar]
- 33. Iwamoto M, Banerjee D, Menon LG et al Overexpression of E2F‐1 in lung and liver metastases of human colon cancer is associated with gene amplification. Cancer Biol Ther 2004; 3: 395–9. [PubMed] [Google Scholar]
- 34. Molina‐Privado I, Rodriguez‐Martinez M, Rebollo P et al E2F1 expression is deregulated and plays an oncogenic role in sporadic Burkitt's lymphoma. Cancer Res 2009; 69: 4052–8. [DOI] [PMC free article] [PubMed] [Google Scholar]
- 35. Hofmann F, Martelli F, Livingston DM, Wang Z. The retinoblastoma gene product protects E2F‐1 from degradation by the ubiquitin‐proteasome pathway. Genes Dev 1996; 10: 2949–59. [DOI] [PubMed] [Google Scholar]
- 36. Peart MJ, Poyurovsky MV, Kass EM et al APC/C(Cdc20) targets E2F1 for degradation in prometaphase. Cell Cycle 2010; 9: 3956–64. [DOI] [PMC free article] [PubMed] [Google Scholar]
- 37. Campanero MR, Flemington EK. Regulation of E2F through ubiquitin‐proteasome‐dependent degradation: stabilization by the pRB tumor suppressor protein. Proc Natl Acad Sci USA 1997; 94: 2221–6. [DOI] [PMC free article] [PubMed] [Google Scholar]
- 38. Rawlings ND, Barrett AJ, Bateman A. MEROPS: the database of proteolytic enzymes, their substrates and inhibitors. Nucleic Acids Res 2012; 40: D343–50. [DOI] [PMC free article] [PubMed] [Google Scholar]
- 39. Hosgood HD III, Baris D, Zhang Y et al Caspase polymorphisms and genetic susceptibility to multiple myeloma. Hematol Oncol 2008; 26: 148–51. [DOI] [PMC free article] [PubMed] [Google Scholar]
- 40. Jourdan M, Reme T, Goldschmidt H et al Gene expression of anti‐ and pro‐apoptotic proteins in malignant and normal plasma cells. Br J Haematol 2009; 145: 45–58. [DOI] [PMC free article] [PubMed] [Google Scholar]
- 41. Lamy L, Ngo VN, Emre NC et al Control of autophagic cell death by caspase‐10 in multiple myeloma. Cancer Cell 2013; 23: 435–49. [DOI] [PMC free article] [PubMed] [Google Scholar]
- 42. Kim MS, Oh JE, Min CK et al Mutational analysis of CASP10 gene in acute leukaemias and multiple myelomas. Pathology 2009; 41: 484–7. [DOI] [PubMed] [Google Scholar]
- 43. McIlwain DR, Berger T, Mak TW. Caspase functions in cell death and disease. Cold Spring Harb Perspect Biol 2013; 5: a008656. [DOI] [PMC free article] [PubMed] [Google Scholar]
- 44. Wikonkal NM, Remenyik E, Knezevic D et al Inactivating E2f1 reverts apoptosis resistance and cancer sensitivity in Trp53‐deficient mice. Nat Cell Biol 2003; 5: 655–60. [DOI] [PubMed] [Google Scholar]
- 45. Wu LC, Wen ZS, Qiu YT et al Largazole arrests cell cycle at g1 phase and triggers proteasomal degradation of e2f1 in lung cancer cells. ACS Med Chem Lett 2013; 4: 921–6. [DOI] [PMC free article] [PubMed] [Google Scholar]


