

Abstract
Our recent studies of microRNA (miRNA) expression signatures demonstrated that microRNA‐1291 (miR‐1291) was significantly downregulated in renal cell carcinoma (RCC) clinical specimens and was a putative tumor‐suppressive miRNA in RCC. The aim of the present study was to investigate the functional significance of miR‐1291 in cancer cells and to identify novel miR‐1291‐mediated cancer pathways and target genes in RCC. Expression of miR‐1291 was significantly downregulated in RCC tissues compared with adjacent non‐cancerous tissues. Restoration of mature miR‐1291 in RCC cell lines (A498 and 786‐O) revealed significant inhibition of cell proliferation, migration and invasion, suggesting that miR‐1291 functioned as a tumor suppressor. To identify miR‐1291‐mediated molecular pathways and targets, we used gene expression analysis (expression of RCC clinical specimens and miR‐1291‐transfected A498 cells) and in silico database analysis. Our data demonstrated that 79 signaling pathways were significantly regulated by tumor‐suppressive miR‐1291 in RCC cells. Moreover, solute career family 2 member 1 (SLC2A1) was a candidate target of miR‐1291 regulation. The SLC2A1 gene provides instructions for producing glucose transporter protein type 1 (GLUT1). Luciferase reporter assays showed that miR‐1291 directly regulated SLC2A1/GLUT1. In RCC clinical specimens, the expression of SLC2A1/GLUT1 mRNA was significantly higher in cancer tissues than in non‐cancerous tissues. A significant inverse correlation was recognized between SLC2A1/GLUT1 and miR‐1291 expression (r = −0.55, P < 0.0001). Loss of tumor‐suppressive miR‐1291 enhanced RCC cell proliferation, migration and invasion through targeting SLC2A1/GLUT1. The identification of novel tumor‐suppressive miR‐1291‐mediated molecular pathways and targets has provided new insights into RCC oncogenesis and metastasis.
Renal cell carcinoma (RCC) is a disease in which cancer cells form in the tubules of the kidney. Globally, the incidence and mortality rates of RCC are increasing 2–3% per decade.1 The 5‐year survival rate of advanced‐stage RCC is very poor (5–10%) due to recurrence or distant metastasis.2 The latest treatment for RCC includes molecular‐targeted therapies, which have been developed and are widely used for patients with metastatic or recurrent RCC.3 However, these types of therapies are not expected to have curative effects.
The discovery of non‐coding RNA (ncRNA) in the human genome was an important conceptual breakthrough in the post‐genome sequencing era.4 Improved understanding of ncRNA is necessary for continued progress in cancer research. MicroRNA (miRNA) are endogenous small ncRNA molecules (19–22 bases in length) that regulate protein‐coding gene expression by repressing translation or cleaving RNA transcripts in a sequence‐specific manner.5 Currently, 2042 human mature miRNA are registered at miRBase release 19.0 (http://microrna.sanger.ac.uk/). MicroRNA are unique in their ability to regulate multiple protein‐coding genes. Bioinformatic predictions indicate that miRNA regulate more than 30% of the protein‐coding genes in the human genome.6 A growing body of evidence suggests that miRNA are aberrantly expressed in many human cancers and that they play significant roles in the initiation, development and metastasis of these cancers.7 Some highly expressed miRNA can function as oncogenes by repressing tumor suppressors, whereas low‐level miRNA can function as tumor suppressors by negatively regulating oncogenes.8 It is believed that normal regulatory mechanisms can be disrupted by aberrant expression of tumor‐suppressive or oncogenic miRNA in cancer cells. Therefore, identification of aberrantly expressed miRNA is the first step toward elucidating miRNA‐mediated oncogenic pathways.
Based on this idea, we identified miRNA expression signatures in RCC using clinical specimens. Our previous study indicated that miR‐1291 was significantly reduced in cancer tissues compared with adjacent non‐cancerous tissues, suggesting that miR‐1291 is a candidate tumor‐suppressive miRNA in human cancers.9 To the best of our knowledge, there are no publications about miR‐1291 in cancer biology. The aim of the present study was to investigate the functional significance of miR‐1291 and identify the molecular pathways and target genes regulated by miR‐1291 in RCC cells. Genome‐wide gene expression analysis of miR‐1291 transfectants and in silico database analysis showed that solute career family 2 member 1 (SLC2A1) was a promising candidate target of miR‐1291. The SLC2A1 gene provides instructions for production of glucose transporter protein type 1 (GLUT1). SLC2A1/GLUT1 facilitates the transport of glucose across the plasma membranes of mammalian cells. SLC2A1/GLUT1 is responsible for the low level of basal glucose uptake required to sustain respiration in all cells. In malignant cells, the rate of glucose uptake is significantly accelerated and oxidative phosphorylation in mitochondria is often decreased compared with normal cells. This effect was first noted by Otto Warburg in 1929 and is called aerobic glycolysis or the Warburg effect.10 Transportation of glucose across the plasma membrane of cancer cells is the first rate‐limiting step for glucose metabolism and increased glucose metabolism in cancer cells is associated with upregulation of the transport of glucose proteins. In fact, SLC2A1/GLUT1 is overexpressed and is associated with poor prognosis in a wide range of cancers.11, 12 Also, SLC2A1/GLUT1 expression is affected by several signal pathways, such as cAMP, p53, insulin and oncogenic signaling.13 These data suggest that SLC2A1/GLUT1 acts as an oncogene in human cancer cells. Thus, SLC2A1/GLUT1 might be targeted by a putative tumor‐suppressive miR‐1291 in RCC. Elucidation of tumor‐suppressive miRNA‐modulated cancer pathways will provide new insights into the potential mechanisms of RCC oncogenesis and will facilitate the development of novel therapeutic strategies for the treatment of RCC.
Materials and Methods
Clinical specimens and cell culture
A total of 27 pairs of clear cell RCC (ccRCC) specimens and adjacent non‐cancerous specimens were collected from patients who had undergone radical nephrectomies at Kagoshima University Hospital. The samples were processed and stored in RNAlater (QIAGEN, Valencia, CA, USA) at −20°C until RNA extraction. Patient information is summarized in Table 1. The samples were staged according to the American Joint Committee on Cancer–Union Internationale Contre le Cancer (UICC) tumor–node–metastasis classification and were histologically graded.14 The present study was approved by the Bioethics Committee of Kagoshima University; prior written informed consent and approval was given by each patient.
Table 1.
Patient characteristics
| n (%) | |
|---|---|
| Total number | 27 |
| Median age (range) (years) | 67 (42–86) |
| Gender | |
| Male | 17 (63.0) |
| Female | 10 (37.0) |
| Pathological tumor stage | |
| pT1 | 22 (81.5) |
| pT2 | 0 (0.0) |
| pT3 | 5 (18.5) |
| pT4 | 0 (0.0) |
| Grade | |
| G1 | 6 (22.2) |
| G2 | 20 (74.1) |
| G3 | 0 (0.0) |
| Unknown | 1 (3.7) |
| Infiltration | |
| α | 8 (29.6) |
| β | 19 (70.4) |
| γ | 0 (0.0) |
| Venous invasion | |
| No | 20 (74.1) |
| Yes | 7 (25.9) |
For cell culture experiments, we used two human RCC cell lines (A498 and 786‐O) obtained from the American Type Culture Collection (Manassas, VA, USA). The cell lines were incubated in RPMI 1640 medium supplemented with 10% fetal bovine serum (FBS) and maintained in a humidified incubator (5% CO2) at 37°C. Total RNA was extracted, as previously described.9, 15 To evaluate epigenetic alterations of genomic methylation, these cells were treated with 1 μM of the DNA methyltransferase inhibitor, 5‐aza‐dC (Sigma‐Aldrich, St Louis, MO, USA). Cultured cells were harvested after 4 days of exposure to 5‐aza‐dC and the total RNA was extracted.
Quantitative real‐time RT‐PCR
TaqMan probes and primers for SLC2A1/GLUT1 (P/N: Hs00892681_m1; Applied Biosystems, Foster City, CA, USA) were assay‐on‐demand gene expression products. All reactions were performed in duplicate and a negative control lacking cDNA was included. We followed the manufacturer's protocol for PCR conditions. Stem‐loop RT‐PCR (TaqMan MicroRNA Assays; P/N: 002838 for miR‐1291; Applied Biosystems) was used to quantify miRNA according to earlier published conditions.16 To normalize the data for quantification of GLUT1 mRNA and the miRNA, we used human GUSB (P/N: Hs99999908_m1; Applied Biosystems) and U6 (P/N: 001973; Applied Biosystems), respectively. The delta–delta Ct method was used to calculate the fold change.
Mature miRNA
As described previously,9, 17 RCC cell lines were transfected with Lipofectamine RNAiMAX transfection reagent (Invitrogen, Carlsbad, CA, USA) and Opti‐MEM (Invitrogen) with 10 nM mature miRNA molecules (P/N: AM17100; Ambion, Austin, TX, USA; and P/N: C‐301345‐00‐0005; Thermo Fisher Scientific, Waltham, MA, USA). Pre‐miR miRNA precursor‐negative control (P/N: AM17111; Applied Biosystems) was used in the gain‐of‐function experiments. Cells were seeded in 10‐cm dishes for protein extraction (8 × 10⁵ cells per dish), six‐well plates for wound healing assays (20 × 104 cells per well), 24‐well plates for mRNA extraction and Matrigel invasion assays (5 × 10⁴ cells per well) and 96‐well plates for XTT assays (3 × 10³ cells per well).
Cell proliferation, migration, invasion assays and cell cycle assays
Cell proliferation was determined using a XTT assay (Roche Applied Science, Tokyo, Japan) performed according to the manufacturer's instructions. Cell migration activity was evaluated with a wound healing assay. Cells were plated in six‐well dishes and the cell monolayer was scraped using a P‐20 micropipette tip. The initial gap length (0 h) and the residual gap length at 24 h after wounding were calculated from photomicrographs. A cell invasion assay was carried out using modified Boyden chambers consisting of Transwell‐precoated Matrigel membrane filter inserts with 8 μm pores in 24‐well tissue cultures plates (BD Biosciences, Bedford, MA, USA). Minimum essential medium containing 10% FBS in the lower chamber served as the chemoattractant as described previously.15 A cell cycle assay was performed using flow cytometry. The 786‐O and A498 cells were transiently transfected with miR‐control or miR‐1291 and were harvested 72 h after transfection using trypsinisation. These cultured cells were incubated in 200 μL of Krishan's reagent (0.05 mg/mL propidium iodide, 0.1% sodium citrate, 0.02 mg/mL RNase A, 0.3% Nonidet P‐40, pH 8.3), then fluorescence from propidium iodide–nuclear DNA complexes was analyzed with a FACSCalibur (BD Bioscience). The percentage of cells in the G0/G1, S and G2/M phases were counted and compared. The apoptosis analysis was done as previously described.17 All experiments were performed in triplicate.
Screening of miR‐1291‐regulated genes using in silico and microarray data
To obtain putative miR‐1291 regulated genes, we used TargetScan database searching (http://www.targetscan.org). As another method, an oligo‐microarray Human 44K (Agilent Technologies, Santa Clara, CA, USA) was used for expression profiling in miR‐1291‐transfected A498 cells and was compared with miR–transfected cells, as previously described.9, 17 Briefly, hybridization and washing steps were performed in accordance with the manufacturer's instructions. The arrays were scanned using a Packard GSI Lumonics ScanArray 4000 (PerkinElmer, Boston, MA, USA). The data obtained were analyzed with dnasis array software (Hitachi Software Engineering, Tokyo, Japan), which converted the signal intensity into expression data. Data from each microarray study were subjected to global normalization.
Pathway analysis and expression data of putative miR‐1291 target genes
We performed gene expression analysis using miR‐1291 transfectants. To identify molecular targets and signaling pathways regulated by miR‐1291, in silico and gene expression data were analyzed in Kyoto Encyclopedia of Genes and Genomics (KEGG) pathway categories using the GENECODIS program. In the present study, we focused on the ‘pathways in cancer’ category, which included 74 genes. Gene expression data was applied using the GEO database (GSE36895 and GSE22541).
Western blotting
After 3 days of transfection, protein lysates (50 μg) were separated using NuPAGE on 4–12% bis‐tris gels (Invitrogen) and transferred into polyvinylidene fluoride membranes. Immunoblotting was conducted with diluted (1:1000) polyclonal GLUT1 antibodies (catalog number, C0213; Assay Biotechnology, Sunnyvale, CA, USA) and GAPDH antibodies (catalog number, MAB374; Chemicon, Temecula, CA, USA). The membrane was washed and then incubated with goat anti‐rabbit IgG (H+L)‐HRP conjugate (Bio‐Rad, Hercules, CA, USA). Specific complexes were visualized with an echochemiluminescence detection system (GE Healthcare, Little Chalfont, UK) and the expression levels of these genes were evaluated using ImageJ software (ver. 1.43; http://rsbweb.nih.gov/ij/index.html).
Plasmid construction and dual‐luciferase reporter assay
MicroRNA target sequences were inserted between the XhoI‐PmeI restriction sites in the 3′UTR of the hRluc gene in the psiCHECK‐2 vector (C8021; Promega, Madison, WI, USA). 786‐O cells were transfected with 15 ng vector, 10 nM microRNA and 1 μL Lipofectamine 2000 (Invitrogen) in 100 μL Opti‐MEM (Invitrogen). The activities of firefly and Renilla luciferases in cell lysates were determined using a dual‐luciferase assay system (E1910; Promega). Normalized data were calculated as the ratio of Renilla/firefly luciferase activities.
Statistical analysis
The relationships between two variables and numerical values were analyzed using the Mann–Whitney U‐test and the relationship between three variables and numerical values was analyzed using the Bonferroni‐adjusted Mann–Whitney U‐test. The relationship between miR‐1291 expression and GLUT1 mRNA expression was analyzed using the Spearman rank correlation. Expert Stat View analysis software (ver. 4; SAS Institute Inc., Cary, NC, USA) was used in these analyses. In the comparison of three variables, a non‐adjusted statistical level of significance of P < 0.05 corresponded to the Bonferroni‐adjusted level of P < 0.0167.
Results
Expression of miR‐1291 in RCC clinical specimens and cancer cell lines
We showed the gene structure of miR‐1291 in the 12q13.11 region of the human genome (Fig. 1a). The miR‐1291 is nested in an intron of the KAT8 regulatory NSL complex subunit 2 (KANSL2) gene. First, we evaluated miR‐1291 expression in RCC clinical specimens and RCC cell lines using real‐time PCR analysis. The relative expression of miR‐1291 to an internal control (U6) was significantly lower in clinical RCC specimens (n = 27; 0.0001014 ± 0.000168) than in adjacent non‐cancerous specimens (n = 27; 0.001 ± 0.002, P < 0.0001; Fig. 1b). In contrast, there was no significant difference in KANSL2 mRNA relative to GUSB between clinical RCC specimens (n = 27; 0.269 ± 0.232) and adjacent non‐cancerous specimens (n = 27; 0.326 ± 0.315, P = 0.6938; Fig. 1c). Also, we could not find any positive correlations between KANSL2 mRNA and miR‐1291 expression. These data suggest that they might have different mechanisms to regulate their expression even though miR‐1291 is nested in the KANSL2 gene.
Figure 1.
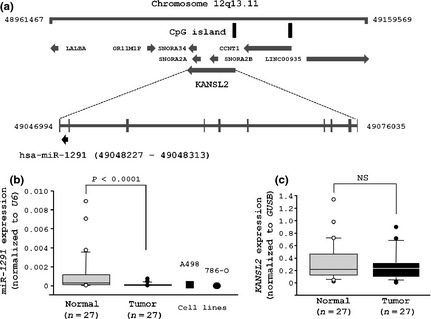
Expression levels of miR‐1291 in renal cell carcinoma (RCC) clinical specimens, non‐cancerous kidney tissues and RCC cell lines. Expression of miR‐1291 was significantly lower in 27 clinical RCC specimens and in RCC cell lines than in 27 adjacent non‐cancerous specimens.
We also evaluated the expression levels of miR‐1291 in RCC cell lines. miR‐1291 expression levels in A498 and 786‐O cells were significantly lower than those in non‐cancerous kidney tissues (P < 0.0001; Fig. 1b). Furthermore, we investigated the expression of other types of human cancer cell lines (20 cell lines) and the expression level of miR‐1291 was ubiquitously low in other cancer cell lines as well as the RCC cell lines (Fig. S1).
To investigate the silencing mechanisms of miR‐1291, we evaluated the expression levels of miR‐1291 in the RCC cells treated with a demethylating agant, 5‐aza‐dC. However, we could not find any restoration of miR‐1291 expression after 5‐aza‐dC treatment (data not shown).
Effects of miR‐1291 restoration on cell proliferation, migration and invasion in RCC cell lines
To investigate the functional role of miR‐1291, we performed gain‐of‐function studies using cells transfected with mature miR‐1291. We used two sources of mature miR‐1291 (Ambion and Thermo) to ensure reproducibility. The XTT assay demonstrated that cell proliferation was significantly inhibited in miR‐1291 transfectants in comparison with mock‐ or miRNA‐control‐transfected cells. Specifically, we observed the following growth rates, expressed as a percentage of the control, using Ambion miRNA: (i) A498: mock, 100.0 ± 1.7%; miR‐control, 98.4 ± 0.5%; and miR‐1291, 56.5 ± 3.1%; and (ii) 786‐O: mock, 100.0 ± 1.2%; miR‐control, 89.9 ± 0.7%; and miR‐1291, 59.1 ± 0.6%, with P < 0.0001 for miR‐1291 in both cells lines (Fig. 2a). In contrast, Thermo miRNA gave the following growth rates: (i) A498: mock, 100.0 ± 2.6%; miR‐control, 94.6 ± 1.7%; and miR‐1291, 77.6 ± 2.3%; and (ii) 786‐O: mock, 100.0 ± 0.7%; miR‐control, 94.0 ± 0.9%; miR‐1291, 80.4 ± 1.4%, with P < 0.0001 for miR‐1291 in both cell lines (Fig. 2b).
Figure 2.
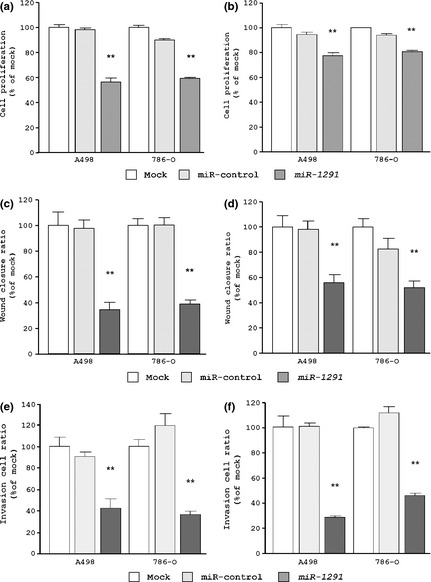
Effects of miR‐1291 transfection on cell viabilities in renal cell carcinoma cell lines (A498 and 786‐O). We used two sources of mature miR‐1291 from Ambion (a,c,e) and Thermo (b,d,f) to ensure reproducibility. (a,b) Cell proliferation determined using the XTT assay. (c,d) Cell migration activity determined using the wound healing assay. (e,f) Cell invasion activity determined using the Matrigel invasion assay. **P < 0.0001.
The wound healing assay demonstrated that significant inhibition of cell migration occurred in miR‐1291 transfectants in comparison with mock and miR‐control transfectants. Specifically, we observed the following wound closure rates, expressed as a percentage of the control, using Ambion miRNA: (i) A498: mock, 100.0 ± 10.2%; miR‐control, 97.2 ± 6.6%; and miR‐1291, 34.3 ± 5.7%; and (ii) 786‐O: mock, 100.0 ± 4.8%; miR‐control, 99.8 ± 5.7%; and miR‐1291, 38.6 ± 3.3%, with P < 0.0001 for miR‐1291 in both cell lines (Fig. 2c). In contrast, Thermo miRNA gave the following wound closure rates: (i) A498: mock, 100.0 ± 9.0%; miR‐control, 98.1 ± 6.2%; and miR‐1291, 55.8 ± 5.9%; and (ii) 786‐O: mock, 100.0 ± 6.5%; miR‐control, 82.8 ± 0.8%; and miR‐1291, 51.7 ± 5.1%, with P < 0.0001 for miR‐1291 in both cell lines (Fig. 2d).
The Matrigel invasion assay demonstrated that the number of invading cells was significantly decreased in miR‐1291‐transfectants in comparison with mock and miR‐control transfectants. Specifically, we observed the following invasion rates, expressed as a percentage of the control, using Ambion miRNA: (i) A498: mock, 100.0 ± 8.9%; miR‐control, 90.7 ± 4.1%; and miR‐1291, 42.0 ± 9.4%; and (ii) 786‐O: mock, 100.0 ± 6.3%; miR‐control, 119.4 ± 10.7%; and miR‐1291, 36.2 ± 3.3%, with P < 0.0001 for miR‐1291 in both cell lines (Fig. 2e). In contrast, Thermo miRNA gave the following invasion rates: (i) A498: mock, 100.0 ± 14.7%; miR‐control, 101.3 ± 2.1%; and miR‐1291, 28.7 ± 1.4%; and (ii) 786‐O: mock, 100.0 ± 0.9%; miR‐control, 112.0 ± 4.9%; and miR‐1291, 46.1 ± 2.1%, with P < 0.0001 for miR‐1291 in both cell lines (Fig. 2f).
To investigate the anti‐proliferative role of miR‐1291, we performed cell cycle and apoptosis assays using flow cytometry. We found a marked G0–G1 arrest in miR‐1291‐transfected A‐498 cells but not in 786‐O cells (Fig. S2). We did not find any apoptotic effect in the miR‐1291‐transfected RCC cell lines (data not shown).
Identification of miR‐1291‐mediated molecular pathways and putative target genes in RCC
To gain further insight into the molecular mechanisms and pathways regulated by tumor‐suppressive miR‐1291 in RCC, we first obtained putative miR‐1291 target genes by searching the TargetScan database. According to the database, 3363 conserved targets, with a total of 334 conserved sites and 4318 poorly conserved sites were deposited in this database. These genes were analyzed and characterized in KEGG pathway categories using the GENECODIS 3.0 program. Our strategy for selection of miR‐1291 target genes is shown in Figure S3. This analysis revealed 79 signaling pathways that were significantly associated with the miR‐1291 target genes (Table S1) and the top 30 significant signaling pathways are listed in Table 2. In these pathways, we focused on the ‘pathways in cancer’ category because it was most significantly associated with miR‐1291‐regulated pathways in this analysis; 74 genes were contained within this pathway (Table S2).
Table 2.
Significantly enriched annotations regulated by miR‐1291 in the TargetScan database
| No. genes | P‐value | Annotations |
|---|---|---|
| 74 | 5.69E‐08 | Pathways in cancer |
| 61 | 6.63E‐07 | MAPK signaling pathway |
| 40 | 2.64E‐06 | Wnt signaling pathway |
| 44 | 2.82E‐06 | Calcium signaling pathway |
| 35 | 5.66E‐06 | Axon guidance |
| 47 | 6.09E‐06 | Endocytosis |
| 39 | 8.83E‐06 | Jak‐STAT signaling pathway |
| 33 | 1.58E‐05 | Glutamatergic synapse |
| 47 | 1.92E‐05 | Regulation of actin cytoskeleton |
| 28 | 2.10E‐05 | GnRH signaling pathway |
| 26 | 5.23E‐05 | Fc gamma R‐mediated phagocytosis |
| 27 | 5.31E‐05 | Melanogenesis |
| 33 | 6.29E‐05 | Cell adhesion molecules |
| 22 | 7.53E‐05 | Arrhythmogenic right ventricular cardiomyopathy |
| 32 | 1.78E‐04 | Insulin signaling pathway |
| 40 | 1.98E‐04 | Chemokine signaling pathway |
| 30 | 2.02E‐04 | Neurotrophin signaling pathway |
| 18 | 2.06E‐04 | Acute myeloid leukemia |
| 24 | 2.13E‐04 | Dilated cardiomyopathy |
| 51 | 2.27E‐04 | Cytokine–cytokine receptor interaction |
| 20 | 2.54E‐04 | Adipocytokine signaling pathway |
| 23 | 3.18E‐04 | ErbB signaling pathway |
| 22 | 4.29E‐04 | Hypertrophic cardiomyopathy |
| 18 | 5.46E‐04 | Colorectal cancer |
| 16 | 6.16E‐04 | mTOR signaling pathway |
| 18 | 6.35E‐04 | Glioma |
| 20 | 7.29E‐04 | VEGF signaling pathway |
| 19 | 7.80E‐04 | Pancreatic cancer |
| 19 | 7.80E‐04 | Renal cell carcinoma |
| 16 | 8.49E‐04 | Non‐small‐cell lung cancer |
MAPK, mitogen‐activated protein kinase; VEGF, vascular endothelial growth factor.
To search for target genes in RCC regulated by tumor‐suppressive miR‐1291, we used two types of gene expression profiles. One was gene expression data of RCC clinical specimens and the other was analysis of gene expression in miR‐1291‐transfected A498 cells. First, we applied gene expression profiles in the GEO database (accession numbers GSE36895 and GSE22541) to evaluate upregulated or downregulated genes in RCC specimens. Among the 74 genes in the ‘pathways in cancer’ category, 12 were upregulated in 53 RCC clinical specimens compared with 23 non‐cancerous kidney tissues (Table 3, Fig. 3). Precise information on all 74 genes is summarized in Table S3. Furthermore, to identify miR‐1291‐regulated genes, we performed genome‐wide gene expression analysis using miR‐1291‐transfected A498 cells in comparison with miR‐control transfectants. We searched for target genes regulated by tumor‐suppressive miR‐1291 based on the following hypotheses: target genes should be upregulated in RCC specimens and downregulated in miR‐1291‐transfected cells. As a result of merging these two types of expression data, two genes (SLC2A1 and phosphoinositide‐3‐kinase, catalytic, gamma polypeptide [PIK3CG]) were listed as candidate miR‐1291 target genes in RCC (Table 3). Among these two potential targets, we focused on SLC2A1/GLUT1 as a promising candidate target gene for miR‐1291 and considered whether SLC2A1/GLUT1 was a direct target of miR‐1291. We did not focus on the PIK3CG gene because there was no significant inverse correlation between PIK3CG and miR‐1291 expression, although the expression of PIK3CG was significantly higher in cancerous tissues (data not shown).
Table 3.
Candidate target genes of miR‐1291 involved in ‘pathways in cancer’
| Expression (log2 ratio) | Entrez gene ID number | Symbol | Gene name | |
|---|---|---|---|---|
| RCC clinical specimens | miR‐1291 transfectant | |||
| 2.47 | −0.10 | 5880 | RAC2 | Ras‐related C3 botulinum toxin substrate 2 (rho family, small GTP binding protein Rac2) |
| 2.40 | −0.42 | 2256 | FGF11 | Fibroblast growth factor 11 |
| 1.93 | −1.04 | 6513 | SLC2A1 | Solute carrier family 2 (facilitated glucose transporter), member 1 |
| 1.77 | −0.03 | 1029 | CDKN2A | Cyclin‐dependent kinase inhibitor 2A (melanoma, p16, inhibits CDK4) |
| 1.47 | 0.01 | 1284 | COL4A2 | Collagen, type IV, alpha 2 |
| 1.39 | 1.69 | 23533 | PIK3R5 | Phosphoinositide‐3‐kinase, regulatory subunit 5 |
| 1.39 | −0.21 | 5900 | RALGDS | Ral guanine nucleotide dissociation stimulator |
| 1.32 | 0.13 | 7039 | TGFA | Transforming growth factor alpha |
| 1.32 | −0.68 | 2113 | ETS1 | V‐ets erythroblastosis virus E26 oncogene homolog 1 (avian) |
| 1.24 | 0.12 | 1438 | CSF2RA |
Colony stimulating factor 2 receptor alpha Low affinity (granulocyte–macrophage) |
| 1.20 | −0.01 | 5371 | PML | Promyelocytic leukemia |
| 1.20 | −2.11 | 5294 | PIK3CG | Phosphoinositide‐3‐kinase, catalytic, gamma polypeptide |
RCC, renal cell carcinoma.
Figure 3.
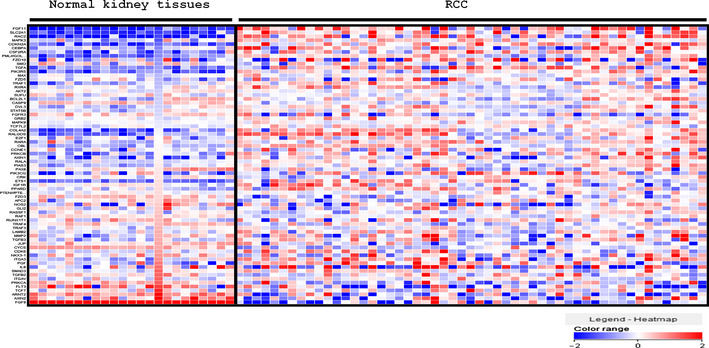
Heat map diagram of the expression of 74 genes involved in ‘pathways in cancer’ in 53 renal cell carcinoma (RCC) specimens in comparison with 23 adjacent non‐cancerous kidney specimens. Precise information of all 74 genes is summarized in Table S3.
SLC2A1/GLUT1 is a direct target of miR‐1291 in RCC
Next, we performed quantitative real‐time RT‐PCR and western blotting to investigate whether SLC2A1/GLUT1 mRNA and protein were downregulated by restoration of miR‐1291. Importantly, both SLC2A1/GLUT1 mRNA and protein levels were significantly repressed in miR‐1291‐transfectants in comparison with mock or miRNA‐control transfectants (Fig. 4a,b).
Figure 4.
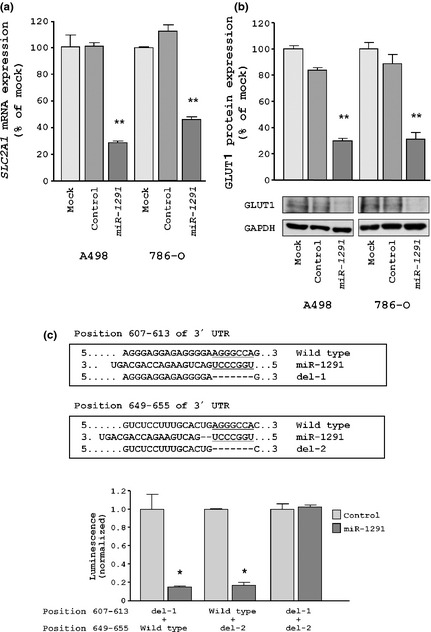
SLC2A1/GLUT1 as a target gene of miR‐1291 in renal cell carcinoma (RCC). (a) SLC2A1/GLUT1 mRNA expression at 24 h after transfection with 10 nM miR‐1291. (b) SLC2A1/GLUT1 protein expression at 72 h after transfection with microRNA. GAPDH was used as a loading control. (c) miR‐1291 binding sites in the 3′UTR of SLC2A1/GLUT1 mRNA. Luciferase reporter assays used the three types of vectors encoding the partial 3′UTR of SLC2A1/GLUT1 mRNA. The first deletion vector was constructed as lacking position 607–613 of putative miR‐1291 target sites (del‐1). The second deletion vector was constructed as lacking position 649–655 of putative miR‐1291 target sites (del‐2). The third deletion vector was constructed as lacking both positions of miR‐1291 target sites (del‐1 and del‐2). Renilla luciferase values were normalized to corresponding firefly luciferase values. *P < 0.05; **P < 0.0001.
To determine whether the 3′UTR of SLC2A1/GLUT1 has an actual target site for miR‐1291, we performed a luciferase reporter assay by using two partial vectors encoding the 3′UTR of SLC2A1/GLUT1 mRNA including either binding site (position 607–613 or position 649–655). We found that the luminescence intensity was significantly reduced in the presence of either site targeted by miR‐1291 (P < 0.05; Fig. 4c). In contrast, luminescence intensity was not decreased when the seed sequence of both target sites was deleted from the vectors (Fig. 4c).
Expression of SLC2A1/GLUT1 in RCC clinical specimens
Expression of SLC2A1/GLUT1 mRNA was significantly higher in the 27 clinical RCC specimens than in the 27 adjacent normal specimens (clinical RCC specimens, 8.806 ± 1.192; adjacent normal tissues, 1.683 ± 0.378; P < 0.0001; Fig. 5a). The correlation between SLC2A1 mRNA expression and miR‐1291 expression was investigated in clinical specimens. A significant inverse correlation was recognized between SLC2A1/GLUT1 and miR‐1291 expression (r = −0.55, P < 0.0001; Fig. 5b).
Figure 5.

SLC2A1/GLUT1 mRNA and miR‐1291 expression in clinical specimens. (a) SLC2A1/GLUT1 mRNA expression in 27 clinical renal cell carcinoma (RCC) specimens and 27 adjacent normal specimens. (b) An inverse correlation between SLC2A1/GLUT1 mRNA and miR‐1291 expression in clinical specimens.
Discussion
Aberrant expression of miRNA causes destruction of tightly regulated miRNA‐protein‐coding RNA networks in human cancer cells. Accumulating evidence of abnormally expressed miRNA in human cancers has demonstrated these miRNA‐mediated functions and has shown that differentially expressed miRNA contribute to cancer initiation, development and metastasis.8, 18 Based on these points, identification of aberrantly expressed miRNA‐mediated cancer pathways and target genes is the first step in elucidating the role of miRNA in human cancers. To better understand RCC oncogenesis, we sequentially identified tumor‐suppressive miRNA‐mediated RCC molecular pathways based on RCC miRNA expression signatures.9 Recently, our miRNA studies in RCC revealed that miR‐1/133a, miR‐138, miR‐135a and miR‐1285 function as tumor suppressors, inhibiting cell proliferation, migration and invasion through targeting transgelin‐2, vimentin, c‐MYC and transglutaminase‐2, respectively.9, 17, 19, 20
Our previous study of RCC miRNA expression signatures showed that miR‐1291 was significantly downregulated, suggesting that this miRNA was a candidate tumor‐suppressive miRNA in RCC. First, we evaluated the expression levels of miR‐1291 in RCC clinical specimens, and confirmed that miR‐1291 was significantly downregulated in tumor tissues. In addition, the expression level of miR‐1291 was ubiquitously low in 20 different cancer cell lines including RCC, glioblastoma, esophageal, breast, colon, bladder and prostate cancers. MiR‐1291 is uniquely nested in the KANSL2 gene, which has CpG islands adjacent to its exon 1. However, the present study demonstrated that miR‐1291 expression did not depend on the methylation status of the host gene. Also, we could not find any positive correlation between KANSL2 mRNA and miR‐1291 expression in the clinical samples and KANSL2 mRNA expression was modest but miR‐1291 expression was quite faint in comparison with the internal control expression. These data suggest that they might have different mechanisms to regulate their expression even though miR‐1291 is nested in the KANSL2 gene. Further examination is necessary to elucidate the silencing mechanisms of miR‐1291 expression. We did not find any correlation between miR‐1291 expression and clinico‐pathological parameters. Our cohort included only five samples with pT3 and pT4 among 27 RCC and it was too small to evaluate the relationship between them.
Next, we investigated the functional significance of miR‐1291 in RCC by using two cell lines, A498 and 768‐O. Furthermore, two types of miRNA (from Ambion and Thermo) were used to evaluate the function of miR‐1291. Restoration of mature miR‐1291 in cancer cells showed significant inhibition of cancer cell proliferation, suggesting that miR‐1291 might indeed be a new tumor suppressor in RCC. A cell cycle assay revealed marked G0–G1 arrest in miR‐1291‐transfected A‐498 cells but not in 786‐O cells, suggesting that miR‐1291 might regulate genes associated with cell cycles in some RCC cases.
With the exception of our present report, no other studies have suggested relationships between tumor‐suppressive miR‐1291 and human cancers. Thus, we believe that analysis of miR‐1291 could lead to discoveries of new molecular mechanisms in RCC. It is believed that a single miRNA is capable of targeting a number of genes to globally regulate biological processes. Aberrantly expressed miRNA causes disruption of the tightly regulated miRNA–messenger RNA networks in cancer cells. Therefore, we propose that identification of novel cancer pathways and target genes regulated by tumor‐suppressive miR‐1291 is an important first step in understanding RCC oncogenesis. To elucidate the tumor‐suppressive functions of miR‐1291, we investigated the molecular pathways and target oncogenic genes regulated by miR‐1291 in RCC cells. A total of 3363 targets were categorized into known molecular pathways using KEGG pathways and the ‘pathways in cancer’ category was selected as the pathway that was most significantly regulated by miR‐1291. Furthermore, we searched for driver genes in RCC involved in the ‘pathways in cancer’ category. In the present study, we selected SLC2A1/GLUT1 because this gene was upregulated in RCC clinical specimens and reduced by miR‐1291 transfection in RCC cells. Luciferase reporter assays demonstrated that miR‐1291 directly targeted SLC2A1/GLUT1. This is the first report demonstrating that SLC2A1/GLUT1 was regulated by a specific miRNA.
Glucose regulates transcription, enzymatic activity and hormone secretion. These functions typically depend on glucose uptake, which is primarily controlled by the glucose transporters family (GLUT1–14).21, 22 There are 14 GLUT members, of which GLUT1, the first member of the GLUT family to be identified, is the most extensively studied. GLUT1 was reported originally as a marker of infantile skin hemangioma23 and overexpression was reported in several types of human cancers, including RCC.24, 25, 26, 27, 28, 29, 30, 31 Renal cell carcinomas, like many other cancers, are dependent on aerobic glycolysis for ATP production, a phenomenon known as the Warburg effect.10, 11, 12 The dependence of RCC on glycolysis is in part a result of induction of GLUT1. In normal tissues, the product of the VHL gene is associated with ubiquitination and degradation of hypoxia inducible factor (HIF) through an oxygen‐sensing mechanism.32, 33 In the absence of oxygen or in the presence of a mutated VHL gene, HIF1a and HIF2a are stabilized and induce the expression of a panel of transcriptional target genes, such as VEGF, PDGF and GLUT1, supporting the metabolic shift that underlies RCC tumorigenicity.34 Interestingly, it was reported about the identification of a class of compounds; one member of this class, STF‐31, selectively kills RCC by specifically targeting glucose uptake through GLUT1. Treatment with these agents inhibits the growth of RCC by binding GLUT1 directly and impeding glucose uptake in vivo without toxicity to normal tissues.35 GLUT1 is a promising target for cancer treatment and GLUT1‐regulated miRNA could possibly be used in nucleic acid medicine.
In conclusion, we found that downregulation of miR‐1291 was a frequent event in RCC. miR‐1291 inhibited cancer cell proliferation through direct targeting of SLC2A1/GLUT1, suggesting that miR‐1291 is a new tumor‐suppressive miRNA. Tumor‐suppressive miR‐1291 appeared to modulate multiple cancer‐associated pathways. The recognition of oncogenes targeted by miR‐1291 might lead to a better understanding of RCC oncogenesis and promote the development of new therapeutic strategies for RCC.
Disclosure Statement
The authors have no conflict of interest.
Supporting information
Fig. S1. Expression levels of miR‐1291 in 20 human cancer cell lines.
Fig. S2. Cell cycle assays in miR‐1291‐transfected renal cell carcinoma cell lines.
Fig. S3. Strategy for selection of miR‐1291 target genes.
Table S1. Significantly enriched annotations regulated by miR‐1291 in the TargetScan database.
Table S2. Candidate target genes of miR‐1291 involved in ‘pathways in cancer’.
Table S3. Seventy‐four differently expressed genes involved in the ‘pathway in cancer’.
Acknowledgments
The authors thank Ms Mutsumi Miyazaki for her excellent laboratory assistance.
(Cancer Sci 2013; 104: 1411–1419)
References
- 1. Gupta K, Miller JD, Li JZ et al Epidemiologic and socioeconomic burden of metastatic renal cell carcinoma (mRCC): a literature review. Cancer Treat Rev 2008; 34: 193–205. [DOI] [PubMed] [Google Scholar]
- 2. Hadoux J, Vignot S, De La Motte Rouge T. Renal cell carcinoma: focus on safety and efficacy of temsirolimus. Clin Med Insights Oncol 2010; 4: 143–54. [DOI] [PMC free article] [PubMed] [Google Scholar]
- 3. Griffioen AW, Mans LA, de Graaf AM et al Rapid angiogenesis onset after discontinuation of sunitinib treatment of renal cell carcinoma patients. Clin Cancer Res 2012; 18: 3961–71. [DOI] [PMC free article] [PubMed] [Google Scholar]
- 4. Mattick JS. RNA regulation: a new genetics? Nat Rev Genet 2004; 5: 316–23. [DOI] [PubMed] [Google Scholar]
- 5. Filipowicz W, Bhattacharyya SN, Sonenberg N. Mechanisms of post‐transcriptional regulation by microRNAs: are the answers in sight? Nat Rev Genet 2008; 9: 102–14. [DOI] [PubMed] [Google Scholar]
- 6. Bartel DP. MicroRNAs: genomics, biogenesis, mechanism, and function. Cell 2004; 116: 281–97. [DOI] [PubMed] [Google Scholar]
- 7. Nelson KM, Weiss GJ. MicroRNAs and cancer: past, present, and potential future. Mol Cancer Ther 2008; 7: 3655–60. [DOI] [PubMed] [Google Scholar]
- 8. Esquela‐Kerscher A, Slack FJ. Oncomirs – microRNAs with a role in cancer. Nat Rev Cancer 2006; 6: 259–69. [DOI] [PubMed] [Google Scholar]
- 9. Hidaka H, Seki N, Yoshino H et al Tumor suppressive microRNA‐1285 regulates novel molecular targets: aberrant expression and functional significance in renal cell carcinoma. Oncotarget 2012; 3: 44–57. [DOI] [PMC free article] [PubMed] [Google Scholar]
- 10. Warburg O. On the origin of cancer cells. Science 1956; 123: 309–14. [DOI] [PubMed] [Google Scholar]
- 11. Gogvadze V, Zhivotovsky B, Orrenius S. The Warburg effect and mitochondrial stability in cancer cells. Mol Aspects Med 2010; 31: 60–74. [DOI] [PubMed] [Google Scholar]
- 12. Vander Heiden MG, Cantley LC, Thompson CB. Understanding the Warburg effect: the metabolic requirements of cell proliferation. Science 2009; 324: 1029–33. [DOI] [PMC free article] [PubMed] [Google Scholar]
- 13. Sommermann TG, O'Neill K, Plas DR et al IKKβ and NF‐κB transcription govern lymphoma cell survival through AKT‐induced plasma membrane trafficking of GLUT1. Cancer Res 2011; 71: 7291–300. [DOI] [PMC free article] [PubMed] [Google Scholar]
- 14. Sobin LH, Wittekind C. TNM Classification of Malignant Tumours, 6th edn International Union Against Cancer (UICC). New York: Wiley–Liss Inc., 2009; 255–257. [Google Scholar]
- 15. Chiyomaru T, Enokida H, Tatarano S et al miR‐145 and miR‐133a function as tumour suppressors and directly regulate FSCN1 expression in bladder cancer. Br J Cancer 2010; 102: 883–91. [DOI] [PMC free article] [PubMed] [Google Scholar]
- 16. Nohata N, Hanazawa T, Kikkawa N et al Caveolin‐1 mediates tumor cell migration and invasion and its regulation by miR‐133a in head and neck squamous cell carcinoma. Int J Oncol 2011; 38: 209–17. [PubMed] [Google Scholar]
- 17. Kawakami K, Enokida H, Chiyomaru T et al The functional significance of miR‐1 and miR‐133a in renal cell carcinoma. Eur J Cancer 2012; 48: 827–36. [DOI] [PubMed] [Google Scholar]
- 18. Davis‐Dusenbery BN, Hata A. MicroRNA in cancer: the involvement of aberrant microRNA biogenesis regulatory pathways. Genes Cancer 2010; 1: 1100–14. [DOI] [PMC free article] [PubMed] [Google Scholar]
- 19. Yamasaki T, Seki N, Yamada Y et al Tumor suppressive microRNA‐138 contributes to cell migration and invasion through its targeting of vimentin in renal cell carcinoma. Int J Oncol 2012; 41: 805–17. [DOI] [PMC free article] [PubMed] [Google Scholar]
- 20. Yamada Y, Hidaka H, Seki N et al Tumor‐suppressive microRNA‐135a inhibits cancer cell proliferation by targeting the c‐MYC oncogene in renal cell carcinoma. Cancer Sci 2013; 104: 304–12. [DOI] [PMC free article] [PubMed] [Google Scholar]
- 21. Macheda ML, Rogers S, Best JD. Molecular and cellular regulation of glucose transporter (GLUT) proteins in cancer. J Cell Physiol 2005; 202: 654–62. [DOI] [PubMed] [Google Scholar]
- 22. Joost HG, Thorens B. The extended GLUT‐family of sugar/polyol transport facilitators: nomenclature, sequence characteristics, and potential function of its novel members (review). Mol Membr Biol 2001; 18: 247–56. [DOI] [PubMed] [Google Scholar]
- 23. North PE, Waner M, Mizeracki A et al GLUT1: a newly discovered immunohistochemical marker for juvenile hemangiomas. Hum Pathol 2000; 31: 11–22. [DOI] [PubMed] [Google Scholar]
- 24. Ozcan A, Shen SS, Zhai QJ et al Expression of GLUT1 in primary renal tumors: morphologic and biologic implications. Am J Clin Pathol 2007; 128: 245–54. [DOI] [PubMed] [Google Scholar]
- 25. Nagase Y, Takata K, Moriyama N et al Immunohistochemical localization of glucose transporters in human renal cell carcinoma. J Urol 1995; 153: 798–801. [PubMed] [Google Scholar]
- 26. Jang SM, Han H, Jang KS et al The glycolytic phenotype is correlated with aggressiveness and poor prognosis in invasive ductal carcinoma. J Breast Cancer 2012; 15: 172–80. [DOI] [PMC free article] [PubMed] [Google Scholar]
- 27. Brown RS, Wahl RL. Overexpression of Glut‐1 glucose transporter in human breast cancer. An immunohistochemical study. Cancer 1993; 72: 2979–85. [DOI] [PubMed] [Google Scholar]
- 28. Mellanen P, Minn H, Grenman R et al Expression of glucose transporters in head‐and‐neck tumors. Int J Cancer 1994; 56: 622–9. [DOI] [PubMed] [Google Scholar]
- 29. Kawamura T, Kusakabe T, Sugino T et al Expression of glucose transporter‐1 in human gastric carcinoma: association with tumor aggressiveness, metastasis and patient survival. Cancer 2001; 92: 634–41. [DOI] [PubMed] [Google Scholar]
- 30. Rudlowski C, Becker AJ, Schroder W et al GLUT1 messenger RNA and protein induction relates to the malignant transformation of cervical cancer. Am J Clin Pathol 2003; 120: 691–8. [DOI] [PubMed] [Google Scholar]
- 31. Cantuaria G, Fagotti A, Ferrandina G et al GLUT1 expression in ovarian carcinoma: association with survival and response to chemotherapy. Cancer 2001; 92: 1144–50. [DOI] [PubMed] [Google Scholar]
- 32. Jaakkola P, Mole DR, Tian YM et al Targeting of HIF‐alpha to the von Hippel–Lindau ubiquitylation complex by O2‐regulated prolyl hydroxylation. Science 2001; 292: 468–72. [DOI] [PubMed] [Google Scholar]
- 33. Kaelin WG Jr. Molecular basis of the VHL hereditary cancer syndrome. Nat Rev Cancer 2002; 2: 673–82. [DOI] [PubMed] [Google Scholar]
- 34. Smaldone MC, Maranchie JK. Clinical implications of hypoxia inducible factor in renal cell carcinoma. Urol Oncol 2009; 27: 238–45. [DOI] [PubMed] [Google Scholar]
- 35. Chan DA, Sutphin PD, Nguyen P et al Targeting GLUT1 and the Warburg effect in renal cell carcinoma by chemical synthetic lethality. Sci Transl Med 2011; 3: 94ra70. [DOI] [PMC free article] [PubMed] [Google Scholar]
Associated Data
This section collects any data citations, data availability statements, or supplementary materials included in this article.
Supplementary Materials
Fig. S1. Expression levels of miR‐1291 in 20 human cancer cell lines.
Fig. S2. Cell cycle assays in miR‐1291‐transfected renal cell carcinoma cell lines.
Fig. S3. Strategy for selection of miR‐1291 target genes.
Table S1. Significantly enriched annotations regulated by miR‐1291 in the TargetScan database.
Table S2. Candidate target genes of miR‐1291 involved in ‘pathways in cancer’.
Table S3. Seventy‐four differently expressed genes involved in the ‘pathway in cancer’.