Abstract
Peneciraistin C (Pe‐C) is a novel spiroketal compound isolated from the saline soil derived fungus Penicillium raistrickii. Our previous study showed that Pe‐C exerted a potent cytotoxic effect on many kinds of cancer cell lines, especially on human lung cancer A549 cells. Here, we report the anticancer mechanisms of Pe‐C in a variety of lung cancer cells. The results showed that Pe‐C induced caspase‐independent autophagic cell death and elevated mitochondrial‐derived reactive oxygen species levels. Interestingly, if autophagy was blocked by 3‐methyladenine or Atg5 siRNA, Pe‐C triggered a shift from autophagic cell death into caspase‐dependent apoptotic cell death. In addition, cotreatment with the antioxidant N‐acetyl‐l‐cysteine or Mito‐TEMPO could effectively reverse the effect of the enhanced reactive oxygen species production, which in turn almost completely prevented the cell death induced by Pe‐C. Thus, this study provided new insights into the mechanisms underlying Pe‐C‐mediated cell death, which indicated that Pe‐C could be a potential drug candidate for therapy of lung cancers.
Lung cancer is the leading cause of cancer‐related death in men and is second only to breast cancer in women.1, 2 In China, approximately 60 0000 people suffer from this disease and consequently die each year. In clinical practice, lung carcinomas are classified into two major types: non‐small‐cell lung cancer and small‐cell lung cancer.3 Chemotherapy is still an important option in curing or controlling lung cancer. Although many relatively effective chemotherapeutic agents have been developed, the cure rate of lung cancer is still low because of drug resistance. In addition, the side‐effects of chemotherapeutic drugs often hamper the quality of life of lung cancer patients.4 Therefore, the discovery of effective novel molecular targeted therapies for lung cancer is urgently needed.
Spiroketals are cyclic substructures found in many natural products that show a wide range of biological activities, such as antitumor activity, antibacterial activity, and anti‐inflammatory effects.5, 6, 7, 8 Peneciraistin C (Pe‐C) (Fig. 1) is a novel spiroketal compound purified from the fungus Penicillium raistrickii, isolated from saline soil collected in Bohai Bay in Zhanhua (Shandong Province, China). In preliminary screening, Pe‐C showed potent cytotoxic activity in many kinds of human cancer cell lines, especially in human lung cancer A549 cells.9 In this study, we report the antitumor activity and the possible molecular mechanisms of Pe‐C in a variety of lung cancer cells.
Figure 1.
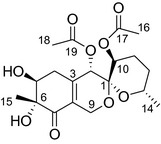
Chemical structure of peneciraistin C.
Over the past decades, apoptosis induction is the main focus in the development of new anticancer drugs, so a great number of studies have been focused on type‐I programmed cell death. In contrast, more and more evidence now shows that autophagic cell death has emerged as an important mechanism of cancer cell death induced by anticancer agents.10, 11, 12 The housekeeping role of autophagy is to protect cells under stressful conditions through removing misfolded or aggregated proteins, engulfing damaged organelles such as mitochondria and endoplasmic reticulum. The autophagic vesicles and their contents are degraded by the cellular lysosomal system and recycled to sustain cellular metabolism.13 However, when this process occurs in excess, autophagy itself becomes cytotoxic and eventually leads to autophagic cell death.14 Thus, in addition to apoptotic cell death, the study on autophagic response is a prospective direction for the development of anticancer drugs. Reactive oxygen species (ROS) production, especially through the mitochondria, is important for the regulation for autophagy induction in cancer therapy.10, 15, 16 However, it seems somewhat controversial that ROS is instrumental in inducing autophagy under stress conditions.17, 18, 19, 20 In this regard, it is of interest to determine the role of ROS and autophagy in A549 cell death induced by the novel compound Pe‐C.
In the present study, we investigated the mechanism underlying the novel compound Pe‐C in lung cancer cells. We found that Pe‐C elicited autophagic cell death independent of caspase activation and apoptosis in a variety of lung cancer cells, which was mediated by the accumulation of mitochondrial‐derived ROS. However, when autophagy was blocked, Pe‐C triggered a shift from autophagic cell death into caspase‐dependent apoptotic cell death.
Materials and Methods
Cell culture
Human lung cancer cells A549, H446, H661, and the human normal lung epithelial cell BEAS‐2B were obtained from the Type Culture Collection of the Chinese Academy of Sciences (Shanghai, China). The lung cancer cells were cultured with RPMI‐1640 medium supplemented with 10% FBS; the BEAS‐2B cells were cultured in M199 medium supplemented with 20% high quality FBS and 2 μL/mL epidermal growth factor at 37°C under a humidified atmosphere of 95% air and 5% CO2.
Chemical reagents and antibodies
Peneciraistin C was isolated from the saline soil‐derived fungus P. raistrickii.9 3‐Methyladenine (3‐MA), wortmannin (WM), caspase inhibitor (z‐VAD‐fmk and Q‐vd‐OPh), N‐acetyl‐l‐cysteine (NAC), acridine orange (AO), and chloromethyl‐2',7'‐dichlorofluorescein diacetate (CM‐H2‐DCFDA) were all purchased from Sigma‐Aldrich (St. Louis, MO, USA). Anti‐LC3, anti‐Atg5, anti‐p62, anti‐cleaved caspase‐9, anti‐cleaved caspase‐3, and anti‐cleaved poly(ADP‐ribose) polymerase (PARP) antibodies were purchased from Cell Signaling Technology (Danvers, MA, USA). Anti‐actin antibody, secondary antibodies, and the specific mitochondria‐targeting antioxidant (Mito‐TEMPO) were obtained from Santa Cruz Biotechnology (Santa Cruz, CA, USA).
Cell viability assay
Cell viability was determined by MTT assay as previously described.19 Briefly, different kinds of cells were seeded in 96‐well flat bottom microtiter plates for 24 h. After treatment, 20 μL MTT solution (5 mg/mL) was added to each well and incubated for 4 h. The crystals were then dissolved in 100 μL DMSO/well. Absorbance was recorded at a wavelength of 490 nm with a microtiter plate reader (Bio‐Tek ELX800, Winooski, VT, USA). At least three replicates were carried out for each treatment.
Determination of cell death and apoptosis
After treatment, cells were harvested and stained with Trypan blue, then counted with a hemocytometer. For cell cycle analysis, treated cells were harvested, fixed in 70% ethanol overnight at 4°C, then cells were washed with PBS and stained with propidium iodide working solution (Beyotime, Shanghai, China) for 30 min in the dark at 37°C. Then the sub‐G1 peaks in the DNA histogram were analyzed with a flow cytometer. Next, for detection of early apoptotic cell death, cells were stained with FITC‐labeled annexin V (BD Pharmingen, San Diego, CA, USA) according to the manufacturer's instructions. The resulting fluorescence was detected by flow cytometry with CellQuest analysis software (BD Biosciences, San Jose, CA, USA).
Detection of acidic vesicular organelles
After treatment, cells were stained with 1 μM AO for 15 min at 37°C in the dark, then washed twice with PBS. Images of AO staining were visualized immediately using a fluorescence microscope. To quantify the fluorescence intensity of AO, other cells were stained with 1 μM AO in PBS at 37°C for 15 min, the cells were harvested, washed, and resuspended in 200 μL PBS, then analyzed by flow cytometry assay. The fluorescence intensity of AO was analyzed with CellQuest software.
Transmission electron microscopy
After treatment, cells were harvested and fixed in 2.5% glutaraldehyde at 4°C overnight. After washing, cells were postfixed with 1% OsO4 for 1.5 h. After dehydration with an ethanol series and propylene oxide at 4°C, cells were embedded in epoxy resin for section. The ultrathin sections were doubly stained by uranyl acetate and lead citrate. The data were analyzed by transmission electron microscopy.
Caspase activity assay
The activity of caspase‐3, ‐8, and ‐9 was measured using commercially available caspase colorimetric assay kits (Beyotime). Briefly, after treatment, cells were harvested by centrifugation at 600 g for 5 min at 4°C. The cell pellets were resuspended in lysis buffer and left on ice for 15 min. Then the lysates were centrifuged at 16 000g for 15 min at 4°C and the supernatant was collected for caspase‐3, ‐8, and ‐9 activity assays according to the kits' instructions.
Measurement of intracellular ROS production
The intracellular ROS levels were measured using the fluorescent dye 2′,7′‐dichlorodihydrofluorescein diacetate (DCF‐DA). Briefly, the treated cells were collected, washed, and incubated with 10 μM DCF‐DA for 30 min in the dark. The stained cells were analyzed using a flow cytometer with CellQuest analysis software.
Western blot analysis
After treatment, cells were harvested and lysed. An equal amount of protein was separated by SDS‐PAGE (12–16%) and transferred to PVDF membranes. After blocking with 5% non‐fat dried milk for 1 h, the membrane was incubated with the desired primary antibodies (dilution 1:1000) overnight at 4°C. Then the immunoreactive bands were visualized by enhanced chemiluminescence using HRP‐conjugated IgG secondary antibodies.
RNA interference
For downregulation of Atg5 gene expression, Atg5 siRNA was purchased from Invitrogen (Carlsbad, CA, USA). Transient transfections of siRNA were carried out using Lipofectamine 2000 (Invitrogen), according to the manufacturer's protocol. After 48 h of transfection, A549 cells were treated with Pe‐C for an additional 48 h. Then cell lysates were subjected to immunoblotting, cell viability, and apoptosis analysis.
Immunofluorescence analysis
After treatment, cells were fixed with 4% paraformaldehyde for 15 min. The cells were the permeabilized with 0.5% Triton X‐100 for 30 min and blocked with 2% BSA for 1 h. After blocking, cells were incubated with anti‐LC3 (1:400) antibody at 4°C overnight then reacted with FITC‐conjugated goat anti‐rabbit IgG (1:100) for 1 h at 37°C. The nuclei were stained with 1 μM DAPI for 5 min. Then LC3 puncta and stained nuclei were detected under a fluorescence microscope and merged (Olympus, Tokyo, Japan).
Statistical analysis
All data are expressed as the mean ± SD. Group comparisons were carried out using Student's t‐test, and multiple groups were carried out using spss 10.0 software (SPSS Inc., Chicago, IL, USA). P < 0.05 is considered statistically significant.
Results
Peneciraistin C induces caspase‐independent non‐apoptotic cell death in lung cancer cells
As shown in Figure 2(a), Pe‐C had a slight effect on normal human lung epithelial BEAS‐2B cells, however, it significantly induced growth inhibition and cell death in a time‐ and dose‐dependent manner in the three tumor cell lines after 24 and 48 h of treatment. The IC50 values of Pe‐C in A549, H446, and H661 cells were 3.2, 6.8 and 4.6 μM, respectively, after 48 h of treatment. To determine whether the cytotoxicity of Pe‐C was apoptosis‐related, A549, H446, and H661 cells were pretreated with the pan‐caspase inhibitors z‐VAD‐fmk and Q‐vd‐OPh. As shown in Figure 2(b) and Figure S1, pretreatment with z‐VAD‐fmk and Q‐vd‐OPh significantly abrogated the cell death in response to 5‐fluorouracil (5‐FU) in A549 cells. In contrast, z‐VAD‐fmk and Q‐vd‐OPh both failed to protect the three tumor cells from death caused by Pe‐C. These results suggested that Pe‐C, unlike 5‐FU, induced cell death in a caspase‐independent manner. To further confirm whether the cell death induced by Pe‐C was due to apoptosis, the activities of caspase‐3, ‐8, and ‐9 and PARP were examined by spectrophotometric method or immunoblot analysis (Fig. 2c, Fig. S2), with 5‐FU as the positive control. Consistently, Pe‐C showed no noticeable effect on the activities of these caspase substrates in A549 cells. Similar results were observed for H446 and H661 cells (data not shown). The effects of Pe‐C on sub‐G1 apoptotic fraction were also examined by flow cytometry in A549 cells (Fig. 2d). Treatment with Pe‐C did not result in an obvious increase of the sub‐G1 phase, whereas, as expected, a significant increase of the sub‐G1 fraction was observed after 5‐FU treatment. These results indicate that Pe‐C‐induced tumor cell death is not associated with the caspase‐dependent apoptotic signaling cascade.
Figure 2.
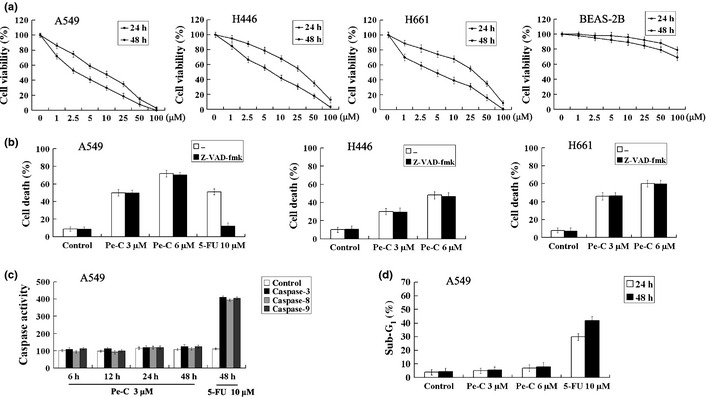
Peneciraistin C (Pe‐C) induces caspase‐independent non‐apoptotic cell death in three lung cancer cell lines. (a) A549, H446, H661, and BEAS‐2B cells were treated with indicated concentrations of Pe‐C for 24 and 48 h. Cell viabilities were determined by MTT assay. The IC 50 value was calculated by an IC 50 software program. (b) A549, H446, and H661 cells were treated with indicated concentrations of Pe‐C and 5‐fluorouracil (5‐FU) in the absence (–) or presence of pan‐caspase inhibitor z‐VAD‐fmk (100 μM) for 48 h. The percentage of cell death was quantified by Trypan blue staining. (c) A549 cells were treated with indicated concentrations of Pe‐C or 5‐FU for the indicated times. The activity of caspase‐3, ‐8, and ‐9 was measured by a microplate reader at 405 nm. (d) A549 cells were treated with indicated concentrations of Pe‐C or 5‐FU for 24 and 48 h. Cells were stained with propidium iodide and analyzed by flow cytometry. Data represent results of at least three independent experiments.
Peneciraistin C induces autophagic features in lung cancer cells
As it seemed that Pe‐C‐induced cell death lacked the characteristics of classical apoptotic cell death, we sought to determine whether it could induce cell death through autophagy. First, we examined the effect of Pe‐C on the levels of acidic vesicular organelles (AVOs), a typical method for monitoring autophagy,21 by staining tumor cells with AO. As shown in Figure 3(a), Pe‐C induced AVO formation in a dose‐dependent manner in A549 cells. When treated with 3–6 μM Pe‐C for 48 h, A549 cells showed a large number of fluorescent vesicles in the cytoplasm, whereas only a few fluorescent vesicles were observed in the control group. To quantify the AVO fractional volume after Pe‐C treatment, flow cytometric analysis was carried out. The data indicated that Pe‐C elicited AVO development in a time‐dependent manner in A549 cells (Fig. 3c). Subsequently, transmission electron microscopy was used to further determine the formation of autophagosomes in Pe‐C treated cells (Fig. 3b). Treatment of A549 cells with 3–6 μM Pe‐C for 48 h caused the accumulation of numerous autophagic vacuoles, which showed autophagosome and/or autolysosomal characteristics, whereas only a few vacuoles were observed in the control cells. To further examine the induction of autophagy by Pe‐C, we assessed the effects of Pe‐C on the levels of LC3, Atg5, and p62, which are all autophagy‐specific markers.22 The immunoblot analysis revealed that Pe‐C treatment led to the drastic conversion of LC3 I/II, the upregulation of Atg5, and the downregulation of p62 in a time‐dependent manner in A549 cells (Fig. 3d). In addition, Pe‐C was also found to induce drastic conversion of LC3‐I to LC3‐II in other lung cancer cells, including H446 and H661 cells (Fig. 3e). All of the findings clearly indicate that Pe‐C induces an autophagic response in lung cancer cells.
Figure 3.
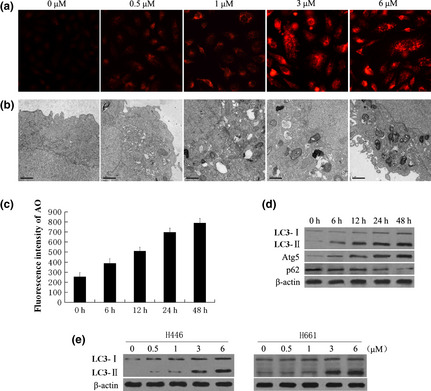
Induction of autophagy in a variety of human lung cancer cells in response to peneciraistin C (Pe‐C). (a, b) A549 cells were treated with indicated concentrations of (Pe‐C) for 48 h. (a) Treated cells were stained with acridine orange (AO) and visualized under a red filter fluorescence microscope. (b) Formation of autophagosomes in treated cells was checked by transmission electron microscopy. Scale bar = 1 μM. (c, d) A549 cells were treated with 3 μM Pe‐C for the indicated times. (c) Treated cells were stained with AO, then the fluorescence intensity was analyzed by flow cytometry. (d) After treatment, whole cell extracts were subjected to immunoblotting with anti‐LC3, anti‐Atg5, and anti‐p62 antibodies. (e) H446 and H661 cells were treated with indicated concentrations of Pe‐C for 48 h. The LC3‐I/LC3‐II levels were determined as described in (d).
Autophagy inhibition converts Pe‐C‐induced cell death to caspase‐dependent apoptotic cell death
To confirm the contribution of autophagy induced by Pe‐C, we analyzed the impact of autophagy blockade on Pe‐C‐induced cell death using 3‐MA and WM, a well‐known inhibitor of early stages of the autophagic process.10 As expected, Pe‐C treatment resulted in a significant increase of LC3‐II expression in A549 cells, whereas this increased level of LC3‐II was markedly attenuated in the presence of 3‐MA or WM (Fig. 4a). Surprisingly, the cell viability measured by MTT assay showed that pretreatment with 3‐MA or WM led to an inconspicuous inhibition of Pe‐C‐induced cell death in A549 cells (Fig. 4b). Given that autophagy and apoptosis are closely interrelated because major players of both pathways cross‐talk to each other,23, 24, 25 we thought that autophagic cell death might be switched to apoptotic cell death under the condition of autophagy inhibition. Indeed, we found that pretreatment of 3‐MA or WM significantly increased the population of sub‐G1 phase apoptotic cells (Fig. 4c). More importantly, pretreatment of the cells with 3‐MA or WM dramatically increased the activity of caspase‐3 in response to Pe‐C (Fig. 4d). Such typical apoptosis‐related events were barely detected in the Pe‐C alone treatment group, suggesting that the inhibition of autophagy shifted Pe‐C‐induced autophagic cell death to caspase‐dependent apoptotic cell death.
Figure 4.
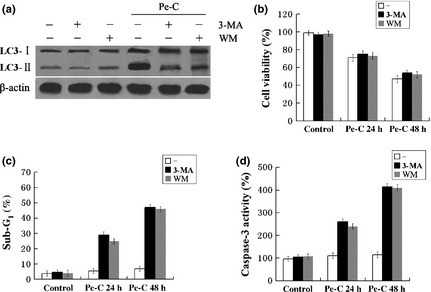
Blockage of autophagy converts peneciraistin C (Pe‐C)‐induced cell death to apoptotic cell death. A549 cells were pretreated with 3‐methyladenine (3‐MA, 5 mM) or wortmannin (WM, 100 nM) for 1 h, followed by 3 μM Pe‐C for the indicated times. (a) After treatment for 48 h, whole cell lysates were separated by SDS‐PAGE, then immunoblotting was carried out using anti‐LC3 antibody. (b) Cell viabilities were analyzed by MTT assay. (c) Sub‐G1 cell cycle phase was analyzed using flow cytometry. (d) Caspase‐3 activity was measured by a microplate reader at 405 nm.
To further assess the functional relationship between autophagy and apoptosis in response to Pe‐C treatment, we next determined whether the downregulation of Atg5 gene expression by siRNA could also convert Pe‐C‐induced autophagic cell death into apoptotic cell death. Consistently, immunoblot analysis revealed that knockdown of Atg5 markedly induced the formation of the active forms of cleaved capase‐9 and caspase‐3, and resultant cleavage of PARP (Fig. 5a, fourth line), which are well‐known apoptotic hallmarks. Such typical apoptotic hallmarks were observed only in cells cotreated with siAtg5, not in Pe‐C alone treated cells (Fig. 5a, third and fourth lines). The effectiveness of siAtg5 on Pe‐C‐induced autophagy was confirmed by the reduction of LC3‐II and Atg5 protein levels (Fig. 5a, fourth line). Similarly, downregulation of Atg5 gene expression significantly increased the proportion of early phase apoptotic cells, as the population of annexin V‐positive cells increased from 3.21% to 29.36% (Fig. 5b). In addition, Atg5 knockdown also led to barely reduction of cell death induced by Pe‐C (Fig. 5c). However, knockdown of Atg5 markedly increased the sub‐G1 fraction (Fig. 5d). Moreover, pretreatment with Z‐VAD‐fmk, a pan‐caspase inhibitor, succeeded in inhibiting Pe‐C‐induced cell death and effectively reduced the sub‐G1 apoptotic fraction after knockdown of Atg5 in A549 cells (Fig. 5c,d). All of these findings clearly suggest that inhibition of autophagy causes a shift from autophagic cell death to apoptosis in response to Pe‐C.
Figure 5.
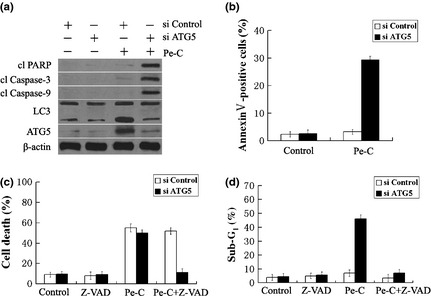
Effect of Atg5 siRNA on cell autophagy and apoptosis. A549 lung cancer cells were transfected with Atg5‐targeted siRNA (si ATG5) or control siRNA (si Control) for 48 h, then stimulated with peneciraistin C (Pe‐C, 3 μM) for 48 h. (a) Whole cell lysates were prepared and separated by SDS‐PAGE, then subjected to immunoblotting using indicated antibodies. (b) Cells were stained with FITC‐labeled annexin V and analyzed by flow cytometry. (c) Cells were treated with Pe‐C in the absence or presence of z‐VAD‐fmk (Z‐VAD). The cell death rate was measured by Trypan blue staining. (d) Sub‐G1 cell cycle phase was determined with flow cytometry in the absence or presence of z‐VAD‐fmk. cl, cleaved; PARP, poly(ADP‐ribose) polymerase.
Mitochondrial‐derived ROS production plays an essential role in Pe‐C‐induced cell death
Next, we investigated the mechanisms leading to cell death by Pe‐C. Recently, mounting evidence has indicated that ROS were involved in autophagy induction in cancer therapy.16, 26 To investigate whether intracellular ROS levels were increased in Pe‐C‐treated A549 cells, the treated cells were stained with CM‐H2‐DCFDA, a cell‐permeable fluorescence dye that reacts to a broad spectrum of ROS. As shown in Figure 6(a,b), ROS levels were clearly increased after Pe‐C treatment in a time‐dependent manner, and such increase was efficiently attenuated when the cells were pretreated with NAC, a broad‐spectrum antioxidant. Surprisingly, the elevated ROS levels were also significantly weakened by Mito‐TEMPO, a mitochondria‐targeting antioxidant with superoxide and alkyl radical scavenging properties (Fig. 6b). To examine whether the enhanced ROS production played an important role in Pe‐C‐induced cell death, A549 cells were pretreated with NAC or Mito‐TEMPO. The result indicated that pretreatment with antioxidant NAC or Mito‐TEMPO almost completely prevented the cell death induced by Pe‐C (Fig. 6c). Interestingly, when the autophagy induced by Pe‐C was blocked using siAtg5, the results were consistent with Figure 6(a–c) (Fig. S3). These data indicated that ROS production induced by Pe‐C played a key role in autophagy and apoptosis. Finally, we investigated whether the inhibition of ROS influenced LC3 expression. Indeed, scavenging of ROS by NAC or Mito‐TEMPO dramatically decreased the LC3 level in response to Pe‐C (Fig. 6d). These results clearly indicate that ROS production induced by Pe‐C, presumably through mitochondria, plays a major role in promoting autophagy and subsequent cell death.
Figure 6.
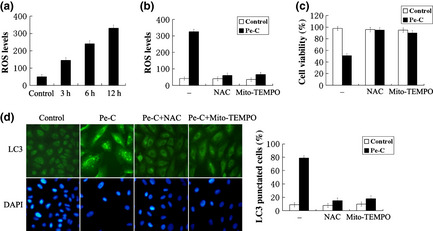
Mitochondrial‐derived reactive oxygen species (ROS) production plays an essential role in peneciraistin C (Pe‐C)‐induced autophagic cell death. (a) A549 cells were treated with 3 μM Pe‐C for the indicated time, then ROS generation was detected using chloromethyl‐2′,7′‐dichlorofluorescein diacetate (CM‐H2‐DCFDA, 10 μM) by flow cytometry. Data were processed with CellQuest software and analyzed by densitometry. (b) A549 cells were treated with Pe‐C (3 μM) in the absence (–) or presence of antioxidants N‐acetyl‐l‐cysteine (NAC, 10 mM) or Mito‐TEMPO (100 μM) for 12 h; CM‐H2‐DCFDA was added 30 min before end of treatment. The ROS levels were detected with a flow cytometer and data were analyzed as described in (a). (c, d) A549 cells were treated with Pe‐C (3 μM) in the absence (–) or presence of antioxidants NAC (10 mM) or Mito‐TEMPO (100 μM) for 48 h. (c) Cell viabilities were determined by MTT assay. (d) Cells were fixed for immunofluorescence staining with anti‐LC3 antibody and observed under a fluorescence microscope.
Discussion
In this study, we provided novel evidence that Pe‐C, isolated from saline soil‐derived fungus P. raistrickii, activated autophagic cell death, which was fundamentally different from apoptosis induced by 5‐FU in human lung cancer cells. We proposed that autophagic cell death, rather than apoptosis, was a possible mechanism for Pe‐C‐induced cytotoxicity. As is well known, the relationship between autophagic and apoptotic cell death is controversial. The two may coexist, cooperate, or antagonize each other to balance death versus survival signaling.27, 28 Our results indicated that Pe‐C induced cell death with autophagic features, such as increased levels of AVOs, the conversion of LC3 I/II, the upregulation of Atg5, and the downregulation of p62, but not with the caspase‐dependent apoptotic characteristics (Figs 2, 3). Interestingly, when cells were cotreated with 3‐MA or WM, the well‐known autophagy inhibitor, or Agt5 siRNA, an essential component for autophagosome formation,29, 30 there was hardly any protective effect on Pe‐C‐induced cell death in A549 cells. Furthermore, it was found that pretreatment of 3‐MA/WM or Agt5 siRNA significantly increased the population of sub‐G1 phase or annexin V‐positive apoptotic cells and markedly induced the formation of the active forms of cleaved capase‐9 and caspase‐3, and resultant cleavage of PARP in response to Pe‐C (Figs 4, 5). In short, it is possible that the Pe‐C‐induced lung cancer cell death may include both apoptotic and autophagic cell death. These cancer cells preferentially undergo autophagic cell death instead of apoptosis in response to Pe‐C, which can be turned to apoptosis when the autophagic cell death pathway is limited.
Next, we investigated the underlying upstream regulatory mechanisms leading to cell death by Pe‐C. Recent evidence has indicated that ROS production, especially through the mitochondria, is important for regulating autophagy and apoptosis in response to chemotherapy‐induced stress.31, 32, 33 However, it seems somewhat controversial that ROS is favorable for inducing autophagy under stress conditions. For instance, inhibition of autophagy by thymidine analogues led to accumulation of ROS production and increased apoptosis.34 In contrast, ApoG2 induced autophagy through ROS‐dependent manners in human hepatocellular carcinoma cells, and inhibition of ROS‐mediated autophagy by antioxidant NAC potentiated ApoG2‐induced apoptosis and cell killing.35 These data showed that ROS formation was either involved in autophagy activation or was included in autophagy inhibition. Thus, it is of interest to determine the role of ROS and autophagy/apoptosis in Pe‐C‐induced cell death. Our study found that ROS accumulated dramatically after Pe‐C treatment (Fig. 6a), and the blocking of this ROS accumulation with antioxidant NAC almost completely blocked the Pe‐C‐induced autophagy and subsequent cell death (Fig. 6b–d). Interestingly, the elevated ROS levels were also significantly weakened by Mito‐TEMPO (Fig. 6b), the mitochondria‐targeting antioxidant, and autophagic cell death was almost completely prevented by Mito‐TEMPO (Fig. 6c,d). In blockage of autophagy induced by Pe‐C, ROS levels were almost unaffected, however, treatment with the antioxidant NAC or Mito‐TEMPO could inhibit ROS accumulation and subsequent cell death completely (Fig. S3). These results indicate that ROS accumulation is presumably derived from mitochondria after Pe‐C treatment, and this ROS production plays a key role in progression to cell death.
Taken together, our findings suggest that Pe‐C‐induced cell death in human lung carcinoma cells is mediated by caspase‐independent autophagic cell death, and mitochondrial ROS production plays a major role in promoting autophagy and subsequent cell death. Moreover, our study unveils novel aspects of interplay between apoptosis and autophagy underlying the cytotoxic action of Pe‐C, and offers a potential drug candidate for treatment of refractory lung cancers that are resistant to caspase‐independent apoptosis.
Disclosure Statement
The authors have no conflict of interest.
Supporting information
Fig. S1. Peneciraistin C (Pe‐C) induces caspase‐independent non‐apoptotic cell death in three lung cancer cell lines. A549, H446, and H661 cells were treated with indicated concentrations of Pe‐C or 5‐fluorouracil (5‐FU) in the absence or presence of pan‐caspase inhibitor (Q‐vd‐OPh, 100 μM) for 48 h. The percentage of cell death was quantified by Trypan blue staining.
Fig. S2. Peneciraistin C (Pe‐C) does not induce caspase activation in A549 lung cancer cells. A549 cells were treated with indicated concentrations of Pe‐C or 5‐fluorouracil (5‐FU) for 48 h. The activated caspase‐3, caspase‐9 and poly(ADP‐ribose) polymerase (PARP) were measured by immunoblot analysis. cl, cleaved.
Fig. S3. Reactive oxygen species (ROS) production induced by peneciraistin C (Pe‐C) plays an essential role in the case of apoptosis. A549 lung cancer cells were transfected with Atg5‐targeted siRNA (si ATG5) and the control siRNA (si Control) for 48 h. (a) After transfection, A549 cells were treated with 3 μM Pe‐C for the indicated time, then ROS generation was detected using chloromethyl‐2′,7′‐dichlorofluorescein diacetate (CM‐H2‐DCFDA, 10 μM) by a flow cytometer. (b) After transfection, A549 cells were treated with Pe‐C (3 μM) in the absence (–) or presence of antioxidants N‐acetyl‐l‐cysteine (NAC, 10 mM) or Mito‐TEMPO (100 μM) for 12 h. CM‐H2‐DCFDA was added 30 min before end of treatment. The ROS levels were detected with a flow cytometer. (c) After transfection, A549 cells were treated with Pe‐C (3 μM) in the absence (–) or presence of antioxidants NAC (10 mM) or Mito‐TEMPO (100 μM) for 48 h. Cell viabilities were determined by MTT assay.
Acknowledgments
This work was supported by the Shandong Province Higher Educational Science and Technology Program (J10LC66) and the National Natural Science Foundation of China (Grant No. 31270082). The authors also appreciate the support of the Shandong Provincial Natural Science Foundation of China (Grant Nos. Y2008B17 and ZR2011BL026).
(Cancer Sci 2013; 104: 1476–1482)
References
- 1. Capelletto E, Novello S. Emerging new agents for the management of patients with non‐small cell lung cancer. Drugs 2012; 72: 37–52. [DOI] [PubMed] [Google Scholar]
- 2. Piperdi B, Perez‐Soler R. Role of erlotinib in the treatment of non‐small cell lung cancer: clinical outcomes in wild‐type epidermal growth factor receptor patients. Drugs 2012; 72: 11–9. [DOI] [PMC free article] [PubMed] [Google Scholar]
- 3. Viani GA, Boin AC, Ikeda VY, Vianna BS, Silva RS, Santanella F. Thirty years of prophylactic cranial irradiation in patients with small cell lung cancer: a meta‐analysis of randomized clinical trials. J Bras Pneumol 2012; 38: 372–81. [DOI] [PubMed] [Google Scholar]
- 4. Abe A, Yamada H, Moriya S, Miyazawa K. The β‐carboline alkaloid harmol induces cell death via autophagy but not apoptosis in human non‐small cell lung cancer A549 cells. Biol Pharm Bull 2011; 34: 1264–72. [DOI] [PubMed] [Google Scholar]
- 5. Kueh JT, Choi KW, Williams GM et al Synthesis of a 6,6‐spiroketal amino Acid and its incorporation into a Peptide turn sequence using solid‐phase Peptide synthesis. Chemistry 2013; 19: 3807–11. [DOI] [PubMed] [Google Scholar]
- 6. Kikumori M, Yanagita RC, Tokuda H et al Structure‐activity studies on the spiroketal moiety of a simplified analogue of debromoaplysiatoxin with antiproliferative activity. J Med Chem 2012; 55: 5614–26. [DOI] [PubMed] [Google Scholar]
- 7. Ding G, Liu S, Guo L, Zhou Y, Che Y. Antifungal metabolites from the plant endophytic fungus Pestalotiopsis foedan . J Nat Prod 2008; 71: 615–8. [DOI] [PubMed] [Google Scholar]
- 8. Calzado MA, Lüdi KS, Fiebich B et al Inhibition of NF‐kappaB activation and expression of inflammatory mediators by polyacetylene spiroketals from Plagius flosculosus . Biochim Biophys Acta 2005; 1729: 88–93. [DOI] [PubMed] [Google Scholar]
- 9. Ma LY, Liu WZ, Shen Li et al Spiroketals, isocoumarin, and indoleformic acid derivatives from saline soil derived fungus Penicillium raistrickii . Tetrahedron 2012; 68: 2276–82. [Google Scholar]
- 10. Zhang T, Li Y, Park KA et al Cucurbitacin induces autophagy through mitochondrial ROS production which counteracts to limit caspase‐dependent apoptosis. Autophagy 2012; 8: 559–76. [DOI] [PubMed] [Google Scholar]
- 11. Jiang Q, Li F, Shi K, Yang Y, Xu C. Sodium selenite‐induced activation of DAPK promotes autophagy in human leukemia HL60 cells. BMB Rep 2012; 45: 194–9. [DOI] [PubMed] [Google Scholar]
- 12. Kanzawa T, Kondo Y, Ito H, Kondo S, Germano I. Induction of autophagic cell death in malignant glioma cells by arsenic trioxide. Cancer Res 2003; 63: 2103–8. [PubMed] [Google Scholar]
- 13. Ling YH, Aracil M, Zou Y et al PM02734 (elisidepsin) induces caspase‐independent cell death associated with features of autophagy, inhibition of the Akt/mTOR signaling pathway, and activation of death‐associated protein kinase. Clin Cancer Res 2011; 17: 5353–66. [DOI] [PubMed] [Google Scholar]
- 14. Kumar S, Kumar A, Pathania AS et al Tiron and trolox potentiate the autophagic cell death induced by magnolol analog Ery5 by activation of Bax in HL‐60 cells. Apoptosis 2013; 18: 605–17. [DOI] [PubMed] [Google Scholar]
- 15. Bellot GL, Liu D, Pervaiz S. ROS, autophagy, mitochondria and cancer: Ras, the hidden master? Mitochondrion 2013; 13: 155–62. [DOI] [PubMed] [Google Scholar]
- 16. Li ZY, Yang Y, Ming M, Liu B. Mitochondrial ROS generation for regulation of autophagic pathways in cancer. Biochem Biophys Res Commun 2011; 414: 5–8. [DOI] [PubMed] [Google Scholar]
- 17. Kaminskyy V, Piskunova T, Zborovskaya I, Tchevkina E, Zhivotovsky B. Suppression of basal autophagy reduces lung cancer cell proliferation and enhances caspase‐dependent and ‐independent apoptosis by stimulating ROS formation. Autophagy 2012; 8: 1032–44. [DOI] [PMC free article] [PubMed] [Google Scholar]
- 18. Saleem A, Dvorzhinski D, Santanam U, Mathew R, Bray K. Effect of dual inhibition of apoptosis and autophagy in prostate cancer. Prostate 2012; 72: 1374–81. [DOI] [PMC free article] [PubMed] [Google Scholar]
- 19. Pan X, Zhang X, Sun H, Zhang J, Yan M, Zhang H. Autophagy inhibition promotes 5‐fluorouraci‐induced apoptosis by stimulating ROS formation in human non‐small cell lung cancer A549 cells. PLoS ONE 2013; 8: e56679. [DOI] [PMC free article] [PubMed] [Google Scholar]
- 20. Kim EH, Sohn S, Kwon HJ et al Sodium selenite induces superoxide‐mediated mitochondrial damage and subsequent autophagic cell death in malignant glioma cells. Cancer Res 2007; 67: 6314–24. [DOI] [PubMed] [Google Scholar]
- 21. Paglin S, Hollister T, Delohery T et al A novel response of cancer cells to radiation involves autophagy and formation of acidic vesicles. Cancer Res 2001; 61: 439–44. [PubMed] [Google Scholar]
- 22. Klionsky DJ, Abdalla FC, Abeliovich H, Abraham RT, Acevedo‐Arozena A. Guidelines for the use and interpretation of assays for monitoring autophagy in higher eukaryotes. Autophagy 2008; 4: 151–75. [DOI] [PMC free article] [PubMed] [Google Scholar]
- 23. Luo S, Rubinsztein DC. BCL2L11/BIM: a novel molecular link between autophagy and apoptosis. Autophagy 2013; 9: 104–5. [DOI] [PMC free article] [PubMed] [Google Scholar]
- 24. Young MM, Kester M, Wang HG. Sphingolipids: regulators of crosstalk between apoptosis and autophagy. J Lipid Res 2013; 54: 5–19. [DOI] [PMC free article] [PubMed] [Google Scholar]
- 25. Shi M, Zhang T, Sun L et al Calpain, Atg5 and Bak play important roles in the crosstalk between apoptosis and autophagy induced by influx of extracellular calcium. Apoptosis 2013; 18: 435–51. [DOI] [PubMed] [Google Scholar]
- 26. Wang Y, Nartiss Y, Steipe B, McQuibban GA, Kim PK. ROS‐induced mitochondrial depolarization initiates PARK2/PARKIN‐dependent mitochondrial degradation by autophagy. Autophagy 2012; 8: 1462–76. [DOI] [PubMed] [Google Scholar]
- 27. Shrivastava A, Kuzontkoski PM, Groopman JE, Prasad A. Cannabidiol induces programmed cell death in breast cancer cells by coordinating the cross‐talk between apoptosis and autophagy. Mol Cancer Ther 2011; 10: 1161–72. [DOI] [PubMed] [Google Scholar]
- 28. Eisenberg‐Lerner A, Bialik S, Simon HU, Kimchi A. Life and death partners: apoptosis, autophagy and the cross‐talk between them. Cell Death Differ 2009; 16: 966–75. [DOI] [PubMed] [Google Scholar]
- 29. Mizushima N. Methods for monitoring autophagy. Int J Biochem Cell Biol 2004; 36: 2491–502. [DOI] [PubMed] [Google Scholar]
- 30. Martinet W, Knaapen MW, Kockx MM, De Meyer GR. Autophagy in cardiovascular disease. Trends Mol Med 2007; 13: 482–91. [DOI] [PubMed] [Google Scholar]
- 31. Gong K, Chen C, Zhan Y, Chen Y, Huang Z, Li W. Autophagy‐related gene 7 (ATG7) and reactive oxygen species/extracellular signal‐regulated kinase regulate tetrandrine‐induced autophagy in human hepatocellular carcinoma. J Biol Chem 2012; 287: 35576–88. [DOI] [PMC free article] [PubMed] [Google Scholar]
- 32. Lee J, Giordano S, Zhang J. Autophagy, mitochondria and oxidative stress: cross‐talk and redox signalling. Biochem J 2012; 441: 523–40. [DOI] [PMC free article] [PubMed] [Google Scholar]
- 33. Liu W, Phang JM. Proline dehydrogenase (oxidase), a mitochondrial tumor suppressor, and autophagy under the hypoxia microenvironment. Autophagy 2012; 8: 1407–9. [DOI] [PMC free article] [PubMed] [Google Scholar]
- 34. Stankov MV, Panayotova‐Dimitrova D, Leverkus M et al Autophagy inhibition due to thymidine analogues as novel mechanism leading to hepatocyte dysfunction and lipid accumulation. AIDS 2012; 26: 1995–2006. [DOI] [PubMed] [Google Scholar]
- 35. Cheng P, Ni Z, Dai X et al The novel BH‐3 mimetic apogossypolone induces Beclin‐1‐ and ROS‐mediated autophagy in human hepatocellular cells. Cell Death Dis 2013; 4: e489. [DOI] [PMC free article] [PubMed] [Google Scholar]
Associated Data
This section collects any data citations, data availability statements, or supplementary materials included in this article.
Supplementary Materials
Fig. S1. Peneciraistin C (Pe‐C) induces caspase‐independent non‐apoptotic cell death in three lung cancer cell lines. A549, H446, and H661 cells were treated with indicated concentrations of Pe‐C or 5‐fluorouracil (5‐FU) in the absence or presence of pan‐caspase inhibitor (Q‐vd‐OPh, 100 μM) for 48 h. The percentage of cell death was quantified by Trypan blue staining.
Fig. S2. Peneciraistin C (Pe‐C) does not induce caspase activation in A549 lung cancer cells. A549 cells were treated with indicated concentrations of Pe‐C or 5‐fluorouracil (5‐FU) for 48 h. The activated caspase‐3, caspase‐9 and poly(ADP‐ribose) polymerase (PARP) were measured by immunoblot analysis. cl, cleaved.
Fig. S3. Reactive oxygen species (ROS) production induced by peneciraistin C (Pe‐C) plays an essential role in the case of apoptosis. A549 lung cancer cells were transfected with Atg5‐targeted siRNA (si ATG5) and the control siRNA (si Control) for 48 h. (a) After transfection, A549 cells were treated with 3 μM Pe‐C for the indicated time, then ROS generation was detected using chloromethyl‐2′,7′‐dichlorofluorescein diacetate (CM‐H2‐DCFDA, 10 μM) by a flow cytometer. (b) After transfection, A549 cells were treated with Pe‐C (3 μM) in the absence (–) or presence of antioxidants N‐acetyl‐l‐cysteine (NAC, 10 mM) or Mito‐TEMPO (100 μM) for 12 h. CM‐H2‐DCFDA was added 30 min before end of treatment. The ROS levels were detected with a flow cytometer. (c) After transfection, A549 cells were treated with Pe‐C (3 μM) in the absence (–) or presence of antioxidants NAC (10 mM) or Mito‐TEMPO (100 μM) for 48 h. Cell viabilities were determined by MTT assay.


