Abstract
Background
Long non-coding RNA (lncRNA) TatD DNase Domain Containing 1 (TATDN1) is a recently characterized oncogenic lncRNA in several types of cancer including breast cancer. Our preliminary microarray analysis revealed its upregulation in triple negative breast cancer (TNBC) and its inverse correlation with microRNA-26b (miR-26b), which is a tumor suppressive miRNA in breast cancer. This study was therefore carried out to investigate the interaction between TATDN1 and miR-26b in TNBC.
Methods
A total of 66 pairs of TNBC and non-tumor tissues were collected from 66 patients (45.8 ± 10.5 years old) with TNBC through biopsy under the guidance of MRI before initiation of any therapies. Quantitative reverse transcription PCR (RT-qPCR), transient cell transfection, methylation specific PCR (MSP) and cell proliferation assay were carried out in this study.
Results
We found that TATDN1 was upregulated and miR-26b was downregulated in TNBC. Correlation analysis showed that the expression of TATDN1 and miR-26b was inversely correlated. In TNBC cells, overexpression of TATDN1 mediated the downregulation of miR-26b. Knockdown of TATDN1 led to the upregulation of miR-26b. Methylation-specific PCR showed that TATDN1 positively regulated the methylation of miR-26b gene. Cell proliferation analysis showed that TATDN1 positively regulated the proliferation of TNBC cells. Overexpression of miR-26b attenuated the effects of TATDN1 overexpression on cell proliferation.
Conclusion
Therefore, overexpression of TATDN1 promotes cancer cell proliferation in TNBC by regulating the methylation of miR-26b gene.
Keywords: triple negative breast cancer, TATDN1, miR-26b, methylation, proliferation
Introduction
Breast cancer has been the most prevalent malignancy in females for decades.1 In 2018, breast cancer caused 626,679 deaths, accounting for 6.6% of all cancer deaths.2 In the same year, a total of 2,088,849 new breast cancer cases were diagnosed, accounting for 11.6% of all new cancer cases.2 Triple-negative breast cancer (TNBC) is a major subtype of breast cancer that lacks the expression of receptors commonly expressed in other types of breast cancer.3 Due to the unique feature of TNBC, the development of targeted therapies is challenging.4 At present, TNBC patients are mainly treated with radiation, chemotherapy as well as surgery in case of early diagnosis.5 However, prognosis is generally poor.5
Studies on the molecular pathogenesis of cancers have revealed a considerable number of genetic alterations involved in the development and progression of different types of malignancy including TNBC.6,7 The functional analysis of genetic alterations involved in cancer provides novel insights into the development of targeted therapies.8,9 Besides genes’ involvement in the synthesis of proteins, cancer occurrence and progression also involve non-coding RNAs (ncRNAs), such as long ncRNAs (lncRNAs) and miRNAs (miRNAs).10 However, the functions of most ncRNAs in cancer remain elusive. LncRNA TATDN1 is a recently characterized oncogenic lncRNA in several types of cancer including breast cancer.11–14 It is known that TATDN1 participates in cancer biology mainly by interacting with miRNAs, such as miR-451, miR-140-3p and miR-6089.11–13 Our preliminary microarray analysis revealed its upregulation in TNBC and its inverse correlation with miR-26b, which is a tumor suppressive miRNA in breast cancer.15 This study was therefore carried out to investigate the interaction between TATDN1 and miR-26b in TNBC.
Materials and Methods
Collection of Tissue Samples
A total of 66 pairs of TNBC and non-tumor (breast tissues within 3 cm around tumors) tissues were collected from 66 patients (grade 3, age range 45.8 ± 10.5 years old) with TNBC through biopsy under the guidance of MRI before initiation of any therapies. All the patients were admitted to West China Hospital between March 2017 and March 2019. This study passed the review board of the Ethics Committee of West China Hospital meeting (201,702), and the research has been carried out in accordance with the World Medical Association Declaration of Helsinki. Inclusion criteria were: 1) newly diagnosed cases; 2) patients were willing to participate in the study. Exclusion criteria were: 1) patients were diagnosed with other clinical disorders; 2) patients with initiated therapies; 3) recurrent cases. All patients were Han Chinese. Based on the AJCC staging system, the 66 patients included 12, 19, 20 and 15 cases at stage I, II, III and IV, respectively. All patients were informed of the principle of this study and they all signed the written informed consent.
Cell Lines and Transfections
Human TNBC cell lines MDA-MB-157 and BT-549 obtained from ATCC (USA) were used in this study. The cell culture medium was composed of 10% FBS and 90% RPMI-1640. Cell culture conditions were 5% CO2, 37°C and 95% humidity. Full length cDNA of TATDN1 (Accession: NR_027427.1) was cloned into pcDNA3.1 vector (Invitrogen) to establish the TATDN1 expression vector. Oligonucleotides of negative control (NC) miRNA (5′-GUGAUGGUCAGCUAGUUAACA-3′) and miR-26b mimic (5′-UUCAAGUAAUUCAGGAUAGGU-3′) as well as NC siRNA (5′-UGUAGCUAGUACUCUCACAUGUA-3′) and TATDN1 siRNA (5′- UAUUGUUUUCACCAAGAUUUAG-3′) were synthesized by Sangon (Shanghai, China). Cells were harvested at 75–85% confluence and HiPerFect transfection reagent (Qiagen) was used to transfect 10 nM vector, 40 nM siRNA or 40 nM miRNA into 106 cells. Control (C) cells were untransfected cells. NC cells were cells transfected with NC miRNA or empty pcDNA3.1 vector.
RNA Extractions and RT-qPCR Analysis
TRIzol reagent (Invitrogen) was used to extract total RNAs from collected tissue samples and in vitro cultivated cells. All RNA samples were digested with DNA eraser (Takara) to remove genomic DNAs. Nanodrop 2000 (Thermo Fisher Scientific) was used to measure RNA concentrations. RNA integrity was determined by 5% Urea-PAGE gel electrophoresis. Reverse transcriptions (RTs) were performed using 1000 ng total RNAs (template) and the SSRT IV system (Thermo Fisher Scientific) with the following conditions: 25°C for 10 min, 55°C for 20 min and 85°C for 10 min. SYBR Premix Ex Taq™ kit (Takara Bio) was used to perform all qPCR reactions. The expression levels of TATDN1 were measured with GAPDH as the endogenous control. PureLink miRNA Isolation Kit (Thermo Fisher Scientific) was used to extract total RNAs from aforementioned cells and tissue samples. All-in-OneTM miRNA qRT-PCR Detection Kit (Genecopoeia) was used to measure the expression levels of mature miR-26b with U6 as endogenous control. The PCR products were identify by melting curve (Supplementary data1)
All qPCR mixtures were prepared following the manufacturer’s instructions. PCR efficiencies of all primer pairs were about 100%. PCR products were separated by 2% agarose gel and were sequenced to make sure correct PCR products were obtained. PCR thermal cycling conditions were: 95°C for 1 min, followed by 40 cycles of 95°C for 10 s and 60°C for 45 s. PCR reactions were performed on the CFX96 Touch Real-Time PCR Detection System (Bio-Rad). Primers were designed and synthesized by Invitrogen (Shanghai, China). Primer sequences were: 5′-ACCGGAGGAAAATCCCTAGC-3′ (forward) and 5′-AAATCCCCATAAAAGGGGCGGCTG-3′ (reverse) for TATDN1 (126 bp); 5′-GAAGAGAGAGACCCTCACGCTG-3′ (forward) and 5′-ACTGTGAGGAGGGGAGATTCAGT-3′ (reverse) for GAPDH (117 bp). Forward primer of miR-26b was 5′-TTCAAGTAATTCAGGATA-3′. Universal reverse primers and U6 forward primer were from the kit. PCR conditions were: 95°C for 1 min, followed by 40 cycles of 95°C for 15 s and 60°C for 50 s. All PCR reactions were repeated 3 times and mean values were presented. The 2−ΔΔct method was used to calculate fold changes of gene expression. Multiple internal controls were used in this study, including 18S rRNA and β-actin for TATDN1, and miR-25-3p for miR-26b, and similar results were obtained.
Bisulfite Sequencing Analysis and Methylation Specific PCR (MSP)
At 24 h post-transfection, genomic DNAs were extracted from BT-549 cells using Monarch® Genomic DNA Purification Kit (NEB) following the manufacturer’s instructions. DNA conversion was performed using EZ DNA Methylation-Gold™ Kit (ZYMO RESEARCH, USA). PCR reactions were performed to measure DNA methylation using Taq 2X Master Mix (NEB). The methylation status of miR-26b promoter was determined by Bisulfite sequencing PCR (BSP). The PCR amplification products were sequenced by Invitrogen Corporation, Shanghai, China. Primers were listed in the Supplementary Table 1.
Cell Proliferation Assay
Cells harvested at 24 h post-transfection were seeded onto a 96-well plate with 104 cells per well. Three wells were set for each experiment. Cells were cultivated under aforementioned conditions and CCK-8 (DOJINDO, Japan) was added into each well to reach the final concentration of 10% at 4 h before the end of cell culture. Cells were harvested at 24, 48, 72 and 96 h post-transfection. After the addition of CCK-8 solution, WST-8 was converted by cellular dehydrogenases to an orange formazan, and the number of living cells was directly proportional to the amount of formazan produced. A microplate reader was used to measure OD values at 450 nm. OD value of C group at 96 h was set to “100”, and all other time points and other groups were normalized to this value.
Statistical Analysis
PCRs were performed in 3 technical replicates. Other experiments were carried out in 3 independent replicates. Data from 3 replicates were expressed at mean ± stand deviation (SD). Statistical analyses were performed by using a two-tailed Student’s t-test. Pearson’s correlation coefficient was used for correlation analysis. P < 0.05 was statistically significant. Patients were divided into high and low TATDN1 level groups and the correlations between the expression levels of TATDN1 and patients’ clinical data were analyzed by Chi-squared test.
Results
The Expression of TATDN1 and miR-26b Was Altered in TNBC
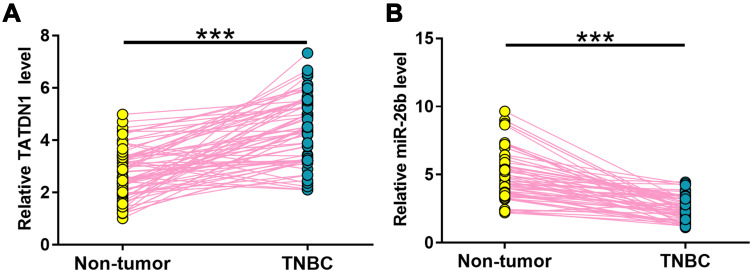
The differential expression of TATDN1 and miR-26b in TNBC were analyzed by measuring their expression levels in both TNBC and non-tumor tissues from the 66 TNBC patients. The results showed that, compared with non-tumor tissues, the expression levels of TATDN1 were significantly higher in TNBC tissues (Figure 1A, p < 0.001). Moreover, the expression levels of TATDN1 were significantly lower in TNBC tissues compared with that in non-tumor tissues (Figure 1B, p < 0.001). Chi-squared test showed that the expression levels of TATDN1 were not significantly correlated with patients’ age, clinical stage, drinking and smoking habits. Correlations between the expression levels of TATDN1 and patients’ clinical data were shown in Supplementary Table 2.
Figure 1.
The expression of TATDN1 and miR-26b were altered in TNBC. The differential expression of TATDN1 (A) and miR-26b (B) in TNBC were analyzed by measuring their expression levels in both TNBC and non-tumor tissues from the 66 TNBC patients. Data were compared by performing paired t-test. All PCR reactions were repeated 3 times. ***p < 0.001.
The Expression of TATDN1 and miR-26b Was Inversely Correlated
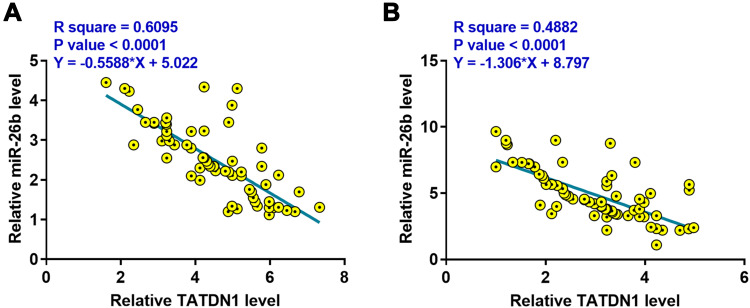
The correlation between the expression of TATDN1 and miR-26b across TNBC and non-tumor tissues from the 66 patients was analyzed by Pearson’s correlation coefficient. It was observed that the expression levels of TATDN1 and miR-26b were significantly and inversely correlated across TNBC tissues (Figure 2A). In addition, a significant and inverse correlation between the expression of TATDN1 and miR-26b was also observed across non-tumor tissues (Figure 2B).
Figure 2.
The expression of TATDN1 and miR-26b were inversely correlated. The correlations between the expression of TATDN1 and miR-26b across TNBC (A) and non-tumor (B) tissues from the 66 patients were analyzed by Pearson’s correlation coefficient.
TATDN1 Negatively Regulated the Expression of miR-26b in BT-549 Cells
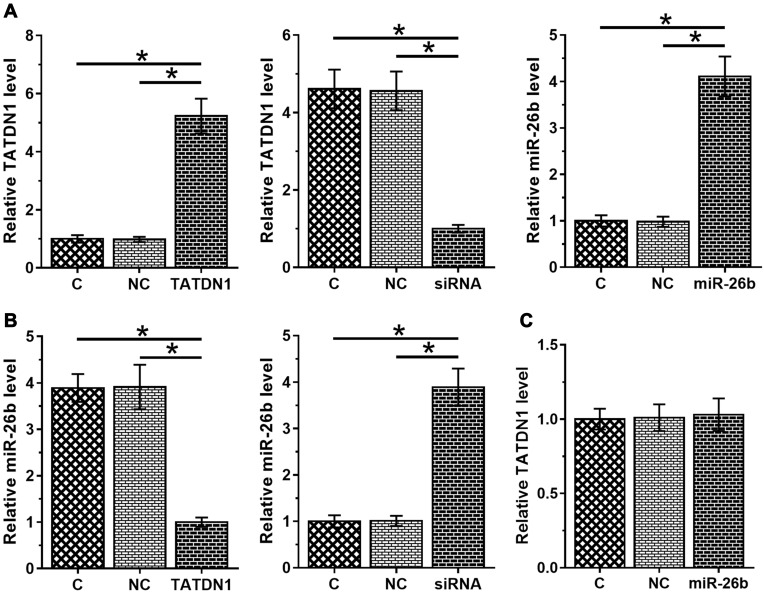
BT-549 cells were transfected with TATDN1 expression vector and siRNA as well as miR-26b mimic. Transfections were confirmed by qPCR at 24 h post-transfection (Figure 3A, p < 0.05). Compared with C and NC groups, overexpression of TATDN1 led to downregulation of miR-26b. In contrast, knockdown of TATDN1 led to the upregulation of miR-26b (Figure 3B, p < 0.05). However, overexpression of miR-26b did not alter the expression of TATDN1 (Figure 3C, p < 0.05). IntaRNA was used to predict the direct interaction between TATDN1 and miR-26b, but no binding site was found (data not shown). So, TATDN1 cannot sponge miR-26b directly.
Figure 3.
TATDN1 negatively regulated the expression of miR-26b in BT-549 cells. BT-549 cells were transfected with TATDN1 expression vector and siRNA as well as miR-26b mimic. Transfections were confirmed by qPCR at 24 h post-transfection (A). The effects of overexpression and silencing of TATDN1 on miR-26b (B), and the effects of overexpression of miR-26b on TATDN1 (C) were all analyzed by qPCR at 24 h post-transfection. All PCR reactions were repeated 3 times, and mean values were presented. *p < 0.05.
Abbreviations: C, untransfected cells; NC, empty vector or NC siRNA transfection; TATDN1, TATDN1 expression vector transfection; siRNA, TATDN1 siRNA transfection; miR-26b, miR-26b mimic transfection.
TATDN1 Positively Regulated the Methylation of miR-26b in MDA-MB-157 and BT-549 Cells
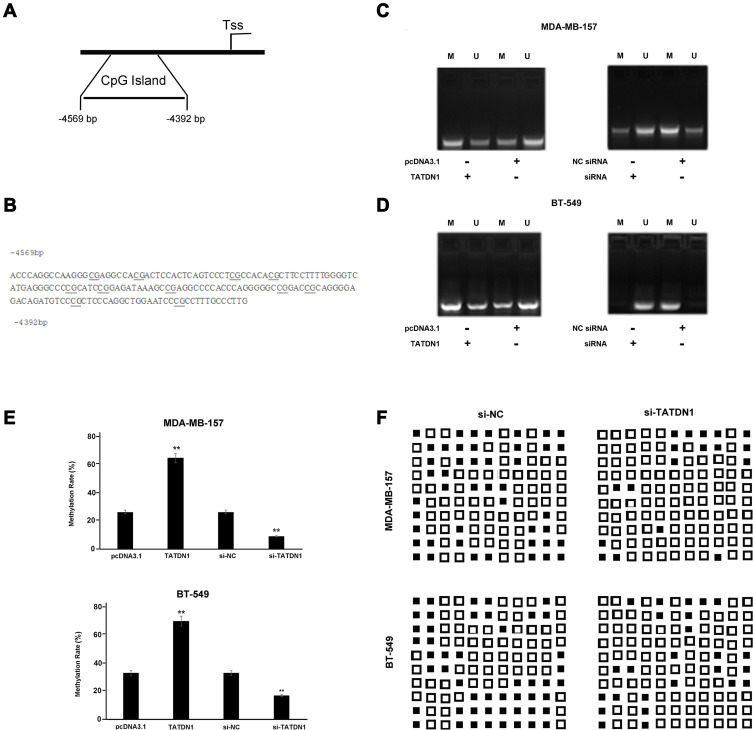
In previous a study, the expression of miR-26b was significantly diminished in hypermethylation breast cancer cell lines. So, it was reasonable to suppose that TATDN1 may affect the expression of miR-26b by DNA methylation. The CpG islands of miR-26b upstream sequence were shown in Figure 4A and B. The effects of overexpression and knockdown of TATDN1 on miR-26b gene upstream CpG islands region in MDA-MB-157 and BT-549 cells were analyzed by MSP. It was observed that overexpression of TATDN1 led to significantly increased methylation of miR-26b gene upstream sequence, and knockdown of TATDN1 led to significantly decreased methylation of the sequence in both MDA-MB-157 (Figure 4C) and BT-549 (Figure 4D) cells. After transfection of TATDN1 expression vector, the methylation rate increased from about 30% (26–37%) to about 70% (64 −78%), while transfection of TATDN1 siRNA decreased the methylation rate from about 30% (26–37%) to about 15% (9–19%) (Figure 4E). DNA methylation level of miR-26b upstream CpG islands region in breast cancer cells was diminished by si-TATDN1 (Figure 4F).
Figure 4.
TATDN1 positively regulated the methylation of miR-26b in BT-549 cells. (A) A CpG island was located in the promoter region of −5000 bp upstream of the miR-26b gene. (B) The sequence level detail of the miR-26b promoter region (−4817 to −4526 bp upstream of the miR-26b stem-loop). The effects of overexpression of TATDN1 (C), and silencing of TATDN1 on miR-26b gene methylation in BT-549 cells (D) were analyzed by MSP. Experiments were repeated in three biologically independent replicates and representative images were presented. (E) Statistical results of silencing of TATDN1 on the methylation level of miR-26b CpG islands region in breast cancer cells. Data are representative of three independent experiments and are presented as mean ± SD (**p < 0.01) (Student’s t-test). (F) Knockdown of TATDN1 decreased DNA methylation level of miR-26b CpG islands region in breast cancer cells analyzed by BSP. Each line indicates the cell samples. Each column indicates CpG sites which were marked in Figure 4B. The black squares indicate the methylation sites; while the empty squares indicate unmethylation sites.
TATDN1 Promoted the Proliferation of TNBC Cells Through miR-26b
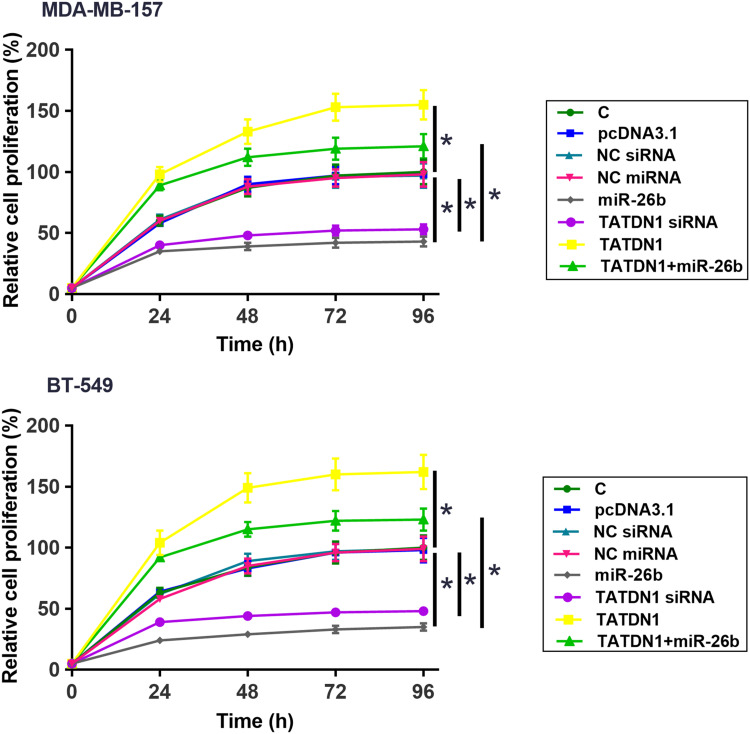
The effects of overexpression and knockdown of TATDN1 as well as overexpression of miR-26b on the proliferation of TNBC cells were analyzed by CCK-8 assay. Compared with C group, overexpression of TATDN1 promoted the proliferation of both MDA-MB-157 and BT-549 cells, while silencing of TATDN1 suppressed cell proliferation. Moreover, overexpression of miR-26b decreased the proliferation rate of TNBC cells attenuated the effects of overexpression of TATDN1 on cell proliferation (Figure 5, p < 0.05). It is worth noting that the overexpression of TATDN1 and miR-26b (> 2-fold) and knockdown of TATDN1 (< 0.5-fold) were confirmed by RT-qPCR at the end of cell proliferation assay (data not shown).
Figure 5.
TATDN1 promoted the proliferation of TNBC cells through miR-26b. The effects of overexpression and silencing of TATDN1 as well as overexpression of miR-26b on the proliferation of TNBC cells were analyzed by CCK-8 assay. All PCR reactions were repeated in three biologically independent replicates and mean values were presented. *p < 0.05.
Discussion
This study mainly investigated the involvement of TATDN1 in TNBC. We found that TATDN1 was upregulated in TNBC and may regulate the expression of miR-26b to promote TNBC cell proliferation.
The expression pattern and functionality of TATDN1 have been analyzed in non-small cell lung cancer (NSCLC), liver cancer, and breast cancer.11–14 In NSCLC, TATDN1 is overexpressed and promotes cancer cell invasion and migration through the interaction with multiple signaling pathways, such as β-catenin and Ezrin.14 Besides, TATDN1 also interacts with the TATDN1/miR-451/TRIM66 pathway to induce the development of cisplatin resistance in NSCLC cells.11 Another study reported that overexpression of TATDN1 contributed to the development and progression of liver cancer, mainly by sponging tumor suppressive miRNA-6089.13 TATDN1 was shown to sponge tumor suppressive miRNA-140-3p to promote the development of breast cancer,12 while they did not analyze the expression and function of TATDN1 in TNBC as breast cancers are a group of heterogeneous cancers. Our study is the first to report the upregulation of TATDN1 in TNBC.
TATDN1 was reported to exert its roles in cancer biology mainly by sponging miRNAs.11–13 Our study also showed that TATDN1 can regulate miR-26b, but through a different pathway to promote TNBC cell proliferation. It has been reported that lncRNAs can regulate the methylation of miRNAs to participate in cancer biology.16 Our study showed that TATDN1 could positively regulate the methylation of miR-26b gene, while the methylation-related factors involved in these processes remain to be explored. It is worth noting that TATDN1 and miR-26b were inversely and significantly correlated across both TNBC and normal tissue samples. Therefore, TATDN1-regulated expression of miR-26b may also exist in normal breast cells.
Our study did not include normal breast cell lines in order to perform in vitro cell experiments, which is the limitation of this study. However, we observed the inverse correlation between the expression of TATDN1 and miR-26b in both TNBC and non-tumor tissues. Therefore, we hypothesize that TATDN1 may negatively regulate the expression of miR-26b under both pathological and physiological conditions. It is worth noting that the cell models used in this study were from basal B-TNBC origins. Therefore, future studies are needed to explore the roles of TATDN1 in other subtypes of TNBC.
Conclusion
In conclusion, TATDN1 is upregulated in TNBC and promotes the methylation of miR-26b to suppress its expression, thereby promoting TNBC cell proliferation.
Disclosure
All authors declare no competing financial interests and report no conflicts of interest for this work.
References
- 1.DeSantis CE, Ma J, Goding Sauer A, Newman LA, Jemal A. Breast cancer statistics, 2017, racial disparity in mortality by state. CA Cancer J Clin. 2017;67(6):439–448. doi: 10.3322/caac.21412 [DOI] [PubMed] [Google Scholar]
- 2.Bray F, Ferlay J, Soerjomataram I, Siegel RL, Torre LA, Jemal A. Global cancer statistics 2018: GLOBOCAN estimates of incidence and mortality worldwide for 36 cancers in 185 countries. CA Cancer J Clin. 2018;68(6):394–424. doi: 10.3322/caac.21492 [DOI] [PubMed] [Google Scholar]
- 3.Bianchini G, Balko JM, Mayer IA, Sanders ME, Gianni L. Triple-negative breast cancer: challenges and opportunities of a heterogeneous disease. Nat Rev Clin Oncol. 2016;13(11):674–690. doi: 10.1038/nrclinonc.2016.66 [DOI] [PMC free article] [PubMed] [Google Scholar]
- 4.Collignon J, Lousberg L, Schroeder H, Jerusalem G. Triple-negative breast cancer: treatment challenges and solutions. Breast Cancer. 2016;8:93–107. [DOI] [PMC free article] [PubMed] [Google Scholar]
- 5.Wahba HA, El-Hadaad HA. Current approaches in treatment of triple-negative breast cancer. Cancer Biol Med. 2015;12(2):106–116. [DOI] [PMC free article] [PubMed] [Google Scholar]
- 6.Turnbull C, Sud A, Houlston RS. Cancer genetics, precision prevention and a call to action. Nat Genet. 2018;50(9):1212–1218. doi: 10.1038/s41588-018-0202-0 [DOI] [PMC free article] [PubMed] [Google Scholar]
- 7.Cory S, Adams JM, Joint A. Odyssey into cancer genetics. Annu Rev Cancer Biol. 2019;3:1–9. [Google Scholar]
- 8.Sawyers C. Targeted cancer therapy. Nature. 2004;432(7015):294–297. doi: 10.1038/nature03095 [DOI] [PubMed] [Google Scholar]
- 9.Banerjee S, Li Y, Wang Z, Sarkar FH. Multi-targeted therapy of cancer by genistein. Cancer Lett. 2008;269(2):226–242. doi: 10.1016/j.canlet.2008.03.052 [DOI] [PMC free article] [PubMed] [Google Scholar]
- 10.Anastasiadou E, Jacob LS, Slack FJ. Non-coding RNA networks in cancer. Nat Rev Cancer. 2018;18(1):5–18. [DOI] [PMC free article] [PubMed] [Google Scholar]
- 11.Wang L, Shang X, Feng Q. LncRNA TATDN1 contributes to the cisplatin resistance of non-small cell lung cancer through TATDN1/miR-451/TRIM66 axis. Cancer Biol Ther. 2019;20(3):261–271. doi: 10.1080/15384047.2018.1529091 [DOI] [PMC free article] [PubMed] [Google Scholar]
- 12.Yu XY, Tian JR, Yang D, Tan HR. TATDN1 promotes the development and progression of breast cancer by targeting microRNA-140-3p. Eur Rev Med Pharmacol Sci. 2019;23(12):5293–5300. [DOI] [PubMed] [Google Scholar]
- 13.Shen C, Xu Y, Lu TF, Zhang JJ, Qian YB, Xu N. LncRNA TATDN1 induces the progression of hepatocellular carcinoma via targeting miRNA-6089. Eur Rev Med Pharmacol Sci. 2019;23(15):6459–6466. [DOI] [PubMed] [Google Scholar]
- 14.Zequn N, Xuemei Z, Wei L, et al. The role and potential mechanisms of LncRNA-TATDN1 on metastasis and invasion of non-small cell lung cancer. Oncotarget. 2016;7(14):18219–18228. doi: 10.18632/oncotarget.7788 [DOI] [PMC free article] [PubMed] [Google Scholar]
- 15.Li J, Kong X, Zhang J, Luo Q, Li X, Fang L. MiRNA-26b inhibits proliferation by targeting PTGS2 in breast cancer. Cancer Cell Int. 2013;13(1):7. doi: 10.1186/1475-2867-13-7 [DOI] [PMC free article] [PubMed] [Google Scholar]
- 16.Liu HT, Fang L, Cheng YX, Sun Q. LncRNA PVT1 regulates prostate cancer cell growth by inducing the methylation of miR-146a. Cancer Med. 2016;5(12):3512–3519. doi: 10.1002/cam4.900 [DOI] [PMC free article] [PubMed] [Google Scholar]


