Abstract
Objective:
Integrate tracked ultrasound and AI methods to provide a safer and more accessible alternative to X-ray for scoliosis measurement. We propose automatic ultrasound segmentation for 3-dimensional spine visualization and scoliosis measurement to address difficulties in using ultrasound for spine imaging.
Methods:
We trained a convolutional neural network for spine segmentation on ultrasound scans using data from eight healthy adult volunteers. We tested the trained network on eight pediatric patients. We evaluated image segmentation and 3-dimensional volume reconstruction for scoliosis measurement.
Results:
As expected, fuzzy segmentation metrics reduced when trained networks were translated from healthy volunteers to patients. Recall decreased from 0.72 to 0.64 (8.2% decrease), and precision from 0.31 to 0.27 (3.7% decrease). However, after finding optimal thresholds for prediction maps, binary segmentation metrics performed better on patient data. Recall decreased from 0.98 to 0.97 (1.6% decrease), and precision from 0.10 to 0.06 (4.5% decrease). Segmentation prediction maps were reconstructed to 3-dimensional volumes and scoliosis was measured in all patients. Measurement in these reconstructions took less than 1 minute and had a maximum error of 2.2° compared to X-ray.
Conclusion:
automatic spine segmentation makes scoliosis measurement both efficient and accurate in tracked ultrasound scans.
Significance:
Automatic segmentation may overcome the limitations of tracked ultrasound that so far prevented its use as an alternative of X-ray in scoliosis measurement.
Keywords: Artificial neural networks, Pediatrics, Medical diagnostic imaging
I. Introduction
WE are proposing a safe, affordable, and accurate scoliosis measurement method using 3-dimensional spine reconstructions based on bone identification with deep learning in tracked ultrasound images. Scoliosis is a spinal deformity found in 2-3% of adolescent children [1]. In about 10% of these cases, scoliosis is progressively getting worse, and these patients require therapy. To stop the progression of scoliosis, the first option is bracing. If scoliosis further progresses and causes complications, then the second option is permanent surgical fusion of the spinal column. Surgery should preferably be avoided, because it limits the range of motion of patients permanently. The most effective way to avoid surgery is by discovering scoliosis at an early age, and frequently monitoring identified patients. If monitoring shows scoliosis progression, the process may be slowed or stopped by starting bracing therapy early, and surgery may be avoided [2]. In current clinical practice however, both screening and monitoring suffers from the lack of a safe, affordable, and accurate scoliosis measurement method.
Currently, scoliosis is measured by X-ray imaging, which limits how often measurements can be made. X-ray provides a clear and accurate picture of the spine, but several concerns have surfaced over the past decades. Primarily, its ionizing radiation has been linked to an increased incidence of cancer [3]. Patients undergoing frequent spine X-rays develop a cancer mortality rate 8% higher compared to the baseline population, according to a long-term follow-up study of a scoliotic population [4]. Screening is currently not implemented in many regions, because the current screening techniques unnecessarily refer too many patients to X-ray imaging. The most common screening technique, the forward bending test has only 2.6% positive predictive value and a sensitivity of 56% [5]. A better screening tool may be imaging with tracked ultrasound. Ultrasound machines are both affordable and safe to be installed in any physician’s office or screening location. According to pilot studies, tracked ultrasound is more accurate than other screening methods. Tracked ultrasound-based scoliosis measurement may even reach the accuracy of X-ray [6]. But ultrasound also has drawbacks compared to X-ray, mainly that the ultrasound image of the spine is dependent on the angle of incidence between the probe and the spine and does not have a characteristic pixel value range. Therefore, the spine is not clearly visible in ultrasound scans. To measure scoliosis with tracked ultrasound, the operator needs to review hundreds of image frames in a sequence, marking anatomical landmarks for scoliosis measurement. This process requires considerable time and sonography experience from users. For faster measurements, the tracked ultrasound sequence may be projected on the coronal plane to generate a single image. But most bone details are not visible in these projection images due to acoustic artifacts. The mid-line of the spine near the spinous processes is visible in these projection images due to the superimposition of acoustic shadows of superficial bone surfaces. But measurement of mid-line curvature is not always a good predictor of scoliosis due to additional rotation of individual vertebrae in the axial and coronal planes. With projection, the 3-dimensional aspect of measurements is lost, and curvature of the mid-line has large differences up to 6 degrees in both directions compared to X-ray based measurements [7]. These limitations have so far prevented tracked ultrasound to be widely used as either a screening or a monitoring tool in scoliosis.
For ultrasound-based scoliosis measurement, 3-dimensional reconstruction of the entire spine from a tracked ultrasound sequence would be a good alternative to X-ray; however, such 3D reconstruction has many technical hurdles. Segmenting bone surfaces in 2-dimensional ultrasound images is a difficult image processing problem. Foroughi et al. developed an early dynamic programming-based method and validated its performance in cadavers [8], but this algorithm has many parameters that need to be manually adjusted for new ultrasound geometry and imaging settings, which has prevented its adoption in clinical ultrasound segmentation. Berton et al. [9] attempted to select image features for bone segmentation using image processing parameters optimized on a set of training data but achieved limited success. Others [10] have used image filters to detect high intensity lines in ultrasound, and those methods have had some success segmenting specific parts of the spine, such as lumbar laminae [10]. Convolutional image filters have been used to identify specific landmarks in the lumbar spine in synthetic spine models and patients for guiding spinal anesthesia with high success rate [11][12]. Even better visualization of the lumbar spine has been achieved with special piston ultrasound transducer, with signal processing optimized for bone surface detection [13][14]. However, these methods have not been generalized for the entire spine or for a more diverse applications other than local anesthesia in the lumbar spine.
In general, conventional image-processing algorithms have achieved limited success in ultrasound segmentation, due to the presence of a multitude of acoustic artifacts and the large variability inherent in ultrasound images [15][16]. Often, two scans of the same anatomical region look different due to different scanning parameters or transducer angle. Only algorithms robust to variations in images may have a chance for wide adoption in clinical practice for the spine segmentation from ultrasound.
Convolutional neural networks (CNNs) have recently outperformed other image processing algorithms in many image processing tasks, mainly because they can capture more complicated patterns in images compared to traditional methods. CNNs not only have impressive performance, but they can be trained for various tasks with little to no modification in their source code. They have not only outperformed previously developed feature-based and random forest-based bone ultrasound segmentation methods, but efficient GPU-based implementations allow real time image processing as well [17]. Real time processing may be beneficial in spine scans for visual feedback to the sonographer on how much of the spine surface has been covered. Methods using CNNs for bone segmentation have been applied to recognize individual lumbar vertebrae by matching the vertebra contours to previously defined X-ray contours of the same vertebrae [18]. The flexibility of neural networks also allows simultaneous classification and segmentation, reusing feature extraction computation layers of segmentation [19]. Although these early results are promising, translation to routine clinical practice depends on whether trained CNNs can be robustly transferred to larger patient populations. CNNs may perform unpredictably when applied on populations with different features compared to the training dataset [20]. Therefore, to properly evaluate CNNs for clinical applications, training and testing should be performed on different populations.
We evaluated if automatic segmentation with a CNN and volume reconstruction would enable efficient scoliosis measurement using tracked ultrasound.
II. Methods
A. Study Population
After obtaining institutional ethics approvals, ultrasound images for our training dataset were collected from eight adult, healthy volunteers. The volunteers’ age ranged from 18 to 30 years, height from 154 to 180 cm, and body mass index from 22.1 to 29.8. Seven volunteers were female and one male. The scoliotic patient population for testing included six children (age 7 to 17 years) who underwent X-ray imaging on the day of our ultrasound scan. Patients’ height ranged from 127 to 185 cm, and body mass index from 16.0 to 23.6, five of them were females and one of them male. Informed consent was obtained from their parents or guardians, according to our approved study protocol.
B. Ultrasound Scanning Technique
All volunteers and patients were scanned with sagittal image orientation. The ultrasound transducer was moved in a pattern of horizontal sweeps, gradually moving down from the upper thoracic to the lower lumbar levels. All scans were recorded at 10 frames per second and completed in 2-3 minutes. The duration of scans was well tolerated by our youngest patients as well. Images of consecutive sweeps had at least a quarter of the image width overlap between them to make sure the entire spine is scanned. The horizontal sweeps were wide enough to include the transverse processes on both sides. Ultrasound imaging parameters were fixed throughout all scans to keep the image geometry consistent. Depth was set to 90 mm to accommodate larger patients as well. Imaging parameters not affecting image size, e.g. gain, dynamic range, and frequency, were set by the sonographer to maximize clarity of bone echoes before scanning each patient. A point-of-care ultrasound machine, MicrUs EXT-1H (Telemed Medical Systems, Milano, Italy) was equipped with an optical position tracker, OptiTrack V120:Duo (NaturalPoint, Corvallis, OR, USA). Ultrasound was tracked relative to an optical reference marker fixed to a belt around the waist of patients (Fig. 1).
Fig. 1.
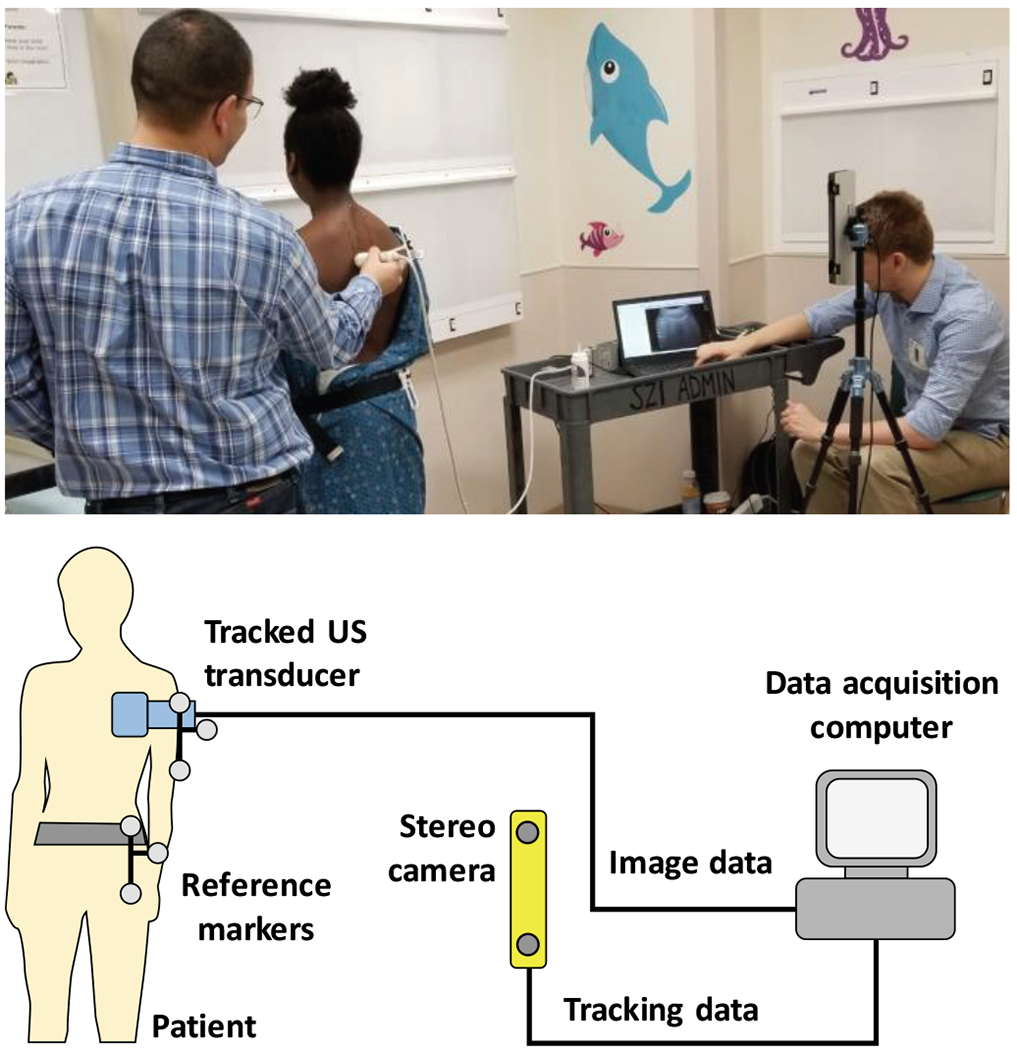
Study patient being scanned with our tracked ultrasound system at the Children’s National Medical Center in Washington, DC (top). Schematic view of the tracked ultrasound system (bottom).
C. Data Annotations
The visible bone contours on recorded ultrasound images were annotated (segmented) by a physician experienced in spine sonography by previously participating in ultrasound-MRI and ultrasound-CT fusion imaging research. A paintbrush-style image editing tool was used for segmentation in the 3D Slicer application. One frame in approximately every 0.5 seconds of the ultrasound sequence was segmented and exported for neural network training. To increase the efficiency of manual segmentation, a custom module for the 3D Slicer application was developed to automate skipping frames, selecting tools, and saving segmented frames.
Bone contours were identified as hyperechoic lines, with hypoechoic acoustic shadow under them. Only the hyperechoic parts of bone surfaces with acoustic shadows were segmented, to avoid inclusion of other anatomical structures (Fig. 2).
Fig. 2.
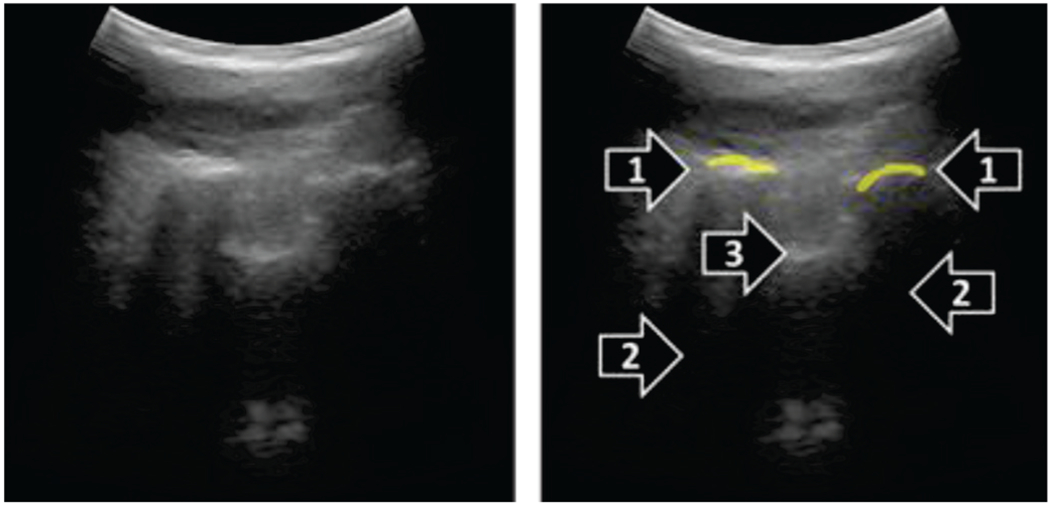
Example paramedian sagittal ultrasound image (left), and its manual segmentation (right). Hyperechoic bone contours (1) were segmented when acoustic shadow (2) was visible distal to the contours. Other hyperechoic contours likely representing tendons and ligaments (3) were not segmented.
D. Machine Learning Protocol
A commonly used CNN for image segmentation, called U-Net (Ronneberger 2015), was trained to automatically segment bones in the ultrasound images. Our implementation of U-Net contained 8 square-shaped layers of size 128×128, 64×64, 32×32, 16×16, 8×8, 4×4, 2×2, and 1×1 artificial neurons with an increasing number of channels of 2, 12, 22, 32, 42, 52, 62, and 72, respectively (Fig. 3). Each two-dimensional convolutional layer in the U-Net underwent bias regularization using the L1-Norm. The U-Net model was trained using the Adam optimizer and weighted categorical cross-entropy loss function with weights of 10% for background and 90% for bone classes. Training data was supplied for the optimizer through a batch generator with data augmentation. Augmentation included random rotations between −10° and +10°, random flip around the vertical axis, and random shift in the image plane up to 1/8 of the image size. Training data was used in batches of 128 images for each iteration of the optimizer.
Fig. 3.
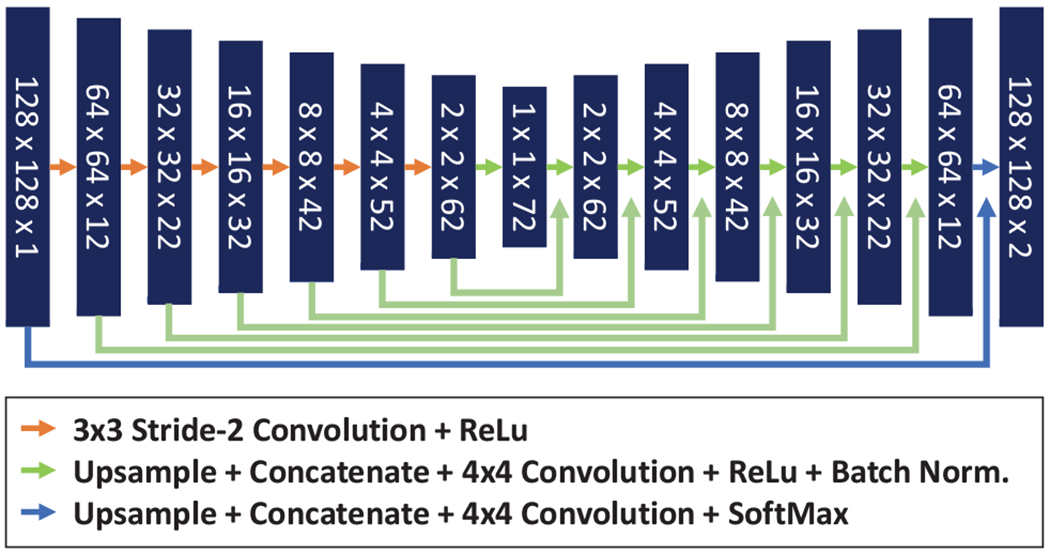
Schematic representation of the U-Net neural network trained for spine ultrasound segmentation.
Eight U-Nets were trained with the same model structure but different training datasets, leaving out one volunteer from each training session. Trained models were validated on the dataset that was left out from training (all images from one volunteer). This leave-one-out cross-validation was repeated multiple times to optimize the training hyperparameters. Finally, each U-Net was trained for 500 epochs with the learning rate decreasing from 0.02 to 0.0001 evenly in each epoch. All eight rounds of training and validation took over 10 hours with one parameter set, which limited our parameter search to relatively few values. We experienced worse validation metrics when changing learning rate by 0.1 in any direction, and when decreasing batch size or epoch number. We also experienced worse validation results when changing the class weight of foreground from 10% to either 5% or 15%. Validation metrics plateaued at a batch size of 128 and epoch number of 500. Input size of 64x64 resulted in worse results, but a larger input size of 256x256 did not improve results. Once the eight U-Nets were trained, each model was tested on the scoliotic patient dataset. Training was ran on a PC with a single Nvidia RTX 2070 GPU, Intel i7-6700K CPU, running TensorFlow-GPU version 1.13.
All source code used in this paper can be publicly accessed (https://github.com/SlicerIGT/aigt). Additionally, all data used in this paper for training and testing are automatically downloaded to the users’ local computer when running the source code, for full reproducibility of our image segmentation experiments.
E. Evaluation Metrics
We evaluated predictions using recall and precision segmentation metrics. We also calculated F-score as the harmonic mean of recall and precision to provide a single performance metric to optimize while searching for training hyperparameters. Prediction map values ranged from 0.0 to 1.0 due to the SoftMax activation of the final layer of U-Net.
Prediction maps were treated as fuzzy segmentations (when class labels are not binary, but range continuously from 0.0 to 1.0), and segmentation metrics (recall, precision, etc.) were calculated using formulas previously recommended for fuzzy segmentations [21]. After fuzzy segmentation, ROC curve metrics were also computed. The prediction maps were converted to binary maps by thresholding. Sensitivity and specificity metrics were calculated at 24 different threshold levels ranging from 0.001% to 90% for calculating the Receiver Operating Characteristic (ROC) curves for each prediction. The area under ROC curve was calculated using these values. The best threshold was selected for each trained model as the threshold that produced the point on the ROC curve furthest from the diagonal. Binary segmentation metrics were calculated at the best threshold value for each model and each dataset (validation and testing).
The trained networks were also evaluated in spine curvature measurement on the patient dataset. The segmented ultrasound images of the training dataset were reconstructed in 3-dimensional volumes with 1 mm isotropic voxel size using the position tracking information recorded for each frame [22]. The reconstruction was visualized by volume rendering in 3D Slicer and overlaid with the posteroanterior X-ray of the same patients. The transverse process angle of vertebrae above and below the main scoliotic curve were calculated after projection of marked anatomical landmarks on the coronal plane. Differences in scoliosis curve measurements are only considered clinically significant when larger than 5°. Measurements of the same curve can have up to 5° error due to interobserver variability and the time of the day when the images was scanned [23].
III. Results
A total of 3,290 ultrasound images were segmented manually from the scans of eight adult volunteers for training the U-Net models. Additionally, 1,892 ultrasound images were segmented manually from the scans of six pediatric scoliotic patients for testing. Eight training sessions resulted in 8 trained models, training on data from seven volunteers, leaving out one for cross-validation. One training took on average 70.7 minutes (min. 67, max. 74). Predictions at three stages of training are shown in Fig. 4.
Fig. 4.
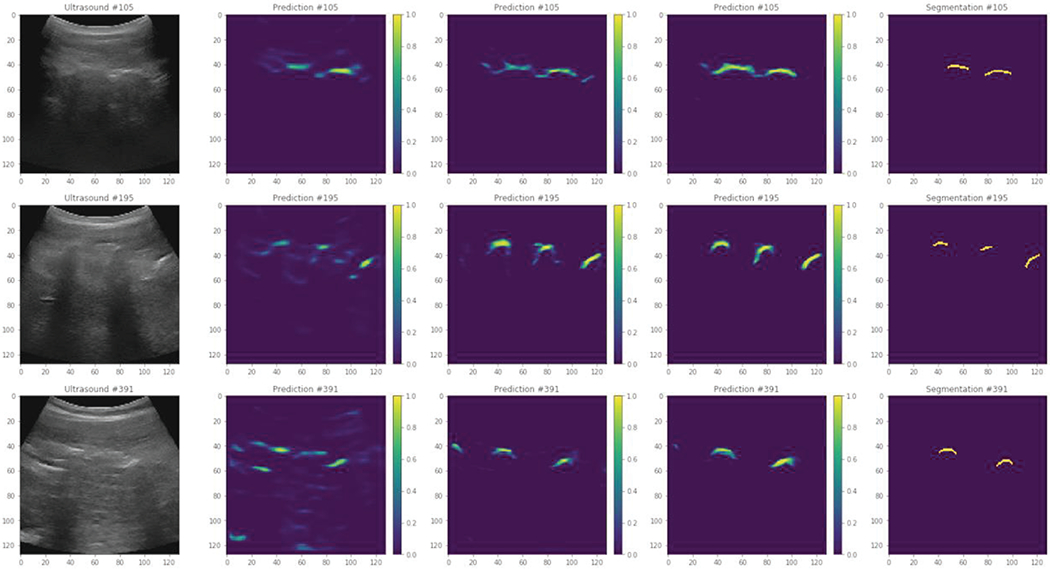
Example prediction images after 5, 50, and 500 epochs (from second to fourth column). Original ultrasound images are shown on the left, and manual segmentations are shown on the right.
Cross-validation and test results of the eight trained models are shown in Table 1. As expected, fuzzy segmentation metrics decreased when trained models were applied to generate predictions on the test dataset. Recall decreased by 8.2% and precision by 3.7%. However, the area under the ROC curve only decreased by 2.0%. Optimal thresholds were calculated for the entire test dataset for each model based on the ROC curves. After applying the threshold to test prediction maps, and binary segmentation metrics were calculated. The decrease in recall and precision were smaller, only 1.6% and 4.5% respectively, in translation from volunteers to patients.
TABLE I.
Cross-validation and Test Results
| Cross validation on healthy volunteers | Test on patients | |||||||||
|---|---|---|---|---|---|---|---|---|---|---|
| Model | Fuzzy recall | Fuzzy precision | AUROC | Best recall | Best precision | Fuzzy recall | Fuzzy precision | AUROC | Best recall | Best precision |
| 1 | 0.788 | 0.262 | 0.994 | 0.988 | 0.088 | 0.596 | 0.294 | 0.963 | 0.958 | 0.061 |
| 2 | 0.641 | 0.313 | 0.977 | 0.965 | 0.073 | 0.597 | 0.323 | 0.965 | 0.969 | 0.059 |
| 3 | 0.733 | 0.278 | 0.993 | 0.985 | 0.094 | 0.666 | 0.272 | 0.971 | 0.959 | 0.064 |
| 4 | 0.700 | 0.335 | 0.989 | 0.979 | 0.113 | 0.665 | 0.254 | 0.983 | 0.976 | 0.061 |
| 5 | 0.705 | 0.321 | 0.990 | 0.984 | 0.088 | 0.652 | 0.282 | 0.971 | 0.967 | 0.059 |
| 6 | 0.767 | 0.264 | 0.996 | 0.988 | 0.109 | 0.708 | 0.241 | 0.985 | 0.974 | 0.070 |
| 7 | 0.731 | 0.321 | 0.993 | 0.984 | 0.135 | 0.648 | 0.213 | 0.972 | 0.970 | 0.049 |
| 8 | 0.714 | 0.371 | 0.995 | 0.988 | 0.128 | 0.591 | 0.286 | 0.953 | 0.958 | 0.049 |
| Average | 0.722 | 0.308 | 0.991 | 0.983 | 0.103 | 0.640 | 0.271 | 0.970 | 0.966 | 0.059 |
| Min | 0.641 | 0.262 | 0.977 | 0.965 | 0.073 | 0.591 | 0.213 | 0.953 | 0.958 | 0.049 |
| Max | 0.788 | 0.371 | 0.996 | 0.988 | 0.135 | 0.708 | 0.323 | 0.985 | 0.976 | 0.070 |
AUROC: area under the ROC curve. Best threshold is defined as the farthest point from the diagonal on the ROC curve.
The optimal threshold was found to be different in all validation and test cases, but always in the lowest two percentiles, average 1.1% (min. 0.4%, max. 2%) in cross-validation, and 0.3% (min. 0.1%, max. 0.8%) in the test dataset (Fig. 5). When training the U-Net with all 8 sets of volunteer data, not leaving any data for validation, the test results were similar to the leave-one-out models, with fuzzy recall of 0.66 and fuzzy precision of 0.25. The same model also produced similar spine images after volume reconstruction of test scans.
Fig. 5.
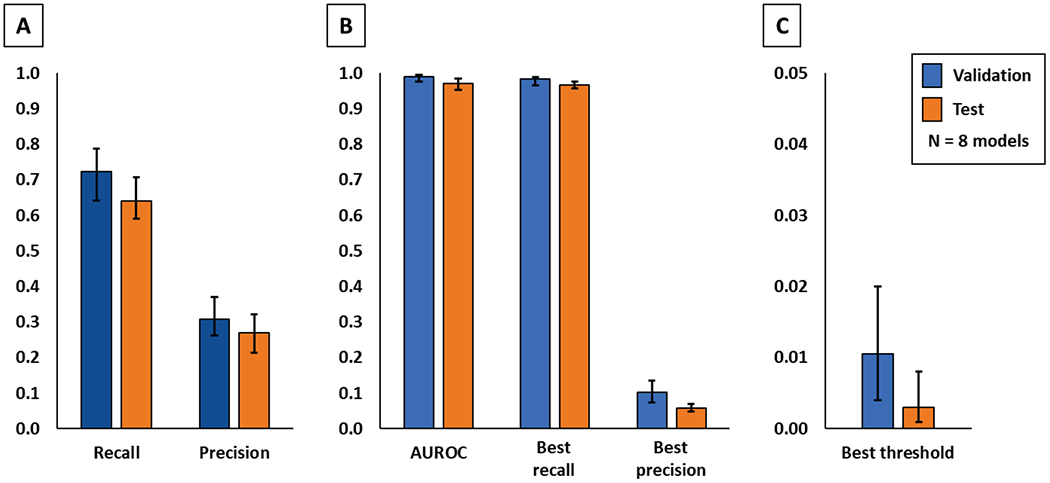
Comparison of cross-validation and patient tests by quantitative evaluation metrics. All values are shown as average, minimum, and maximum. Fuzzy segmentation metrics are shown on the left (A), binary segmentation metrics after thresholding are shown in the middle (B), and optimal threshold values are shown on the right (C).
All test ultrasound images were processed by the model that had the highest fuzzy F-score on the validation dataset. Prediction maps were calculated for each set of ultrasound images. The prediction maps were reconstructed in 3-dimensional ultrasound volumes. Prediction performed at 7 frames per second (fps), and volume reconstruction at 3 fps, using CPU-based implementation in the SlicerIGT extension of 3D Slicer [24]. We used transverse processes as anatomical landmarks for measuring scoliosis on the reconstructed volumes. Transverse processes were visible on all vertebrae at the start and end of the main scoliotic curves of all patients. However, the reconstructed volumes were typically unclear near the last thoracic spine segments. Prediction values were lower in the lumbar segment, causing the lumbar region to appear with less intensity when the visualization threshold is set for the thoracic part of the spine (Fig. 6). To find the transverse processes the observer physician needed to zoom in and rotate the reconstructed volumes to find the points where the transverse processes end, but all measurements were completed within one minute. Scoliosis was quantified based on transverse process angles in all patients. Measurement was performed in a single 3-dimensional volume for each patient, and in considerably less time compared to previous tracked ultrasound-based measurement, which may take up to 10 minutes [6]. Transverse process angles were measured in both X-ray images and ultrasound reconstructions for comparison with X-ray. The two imaging modalities had a maximum difference of 2.2° in scoliosis measurement. The average difference was 2.0° (Fig. 7), well within the 5° clinically significant error range.
Fig. 6.
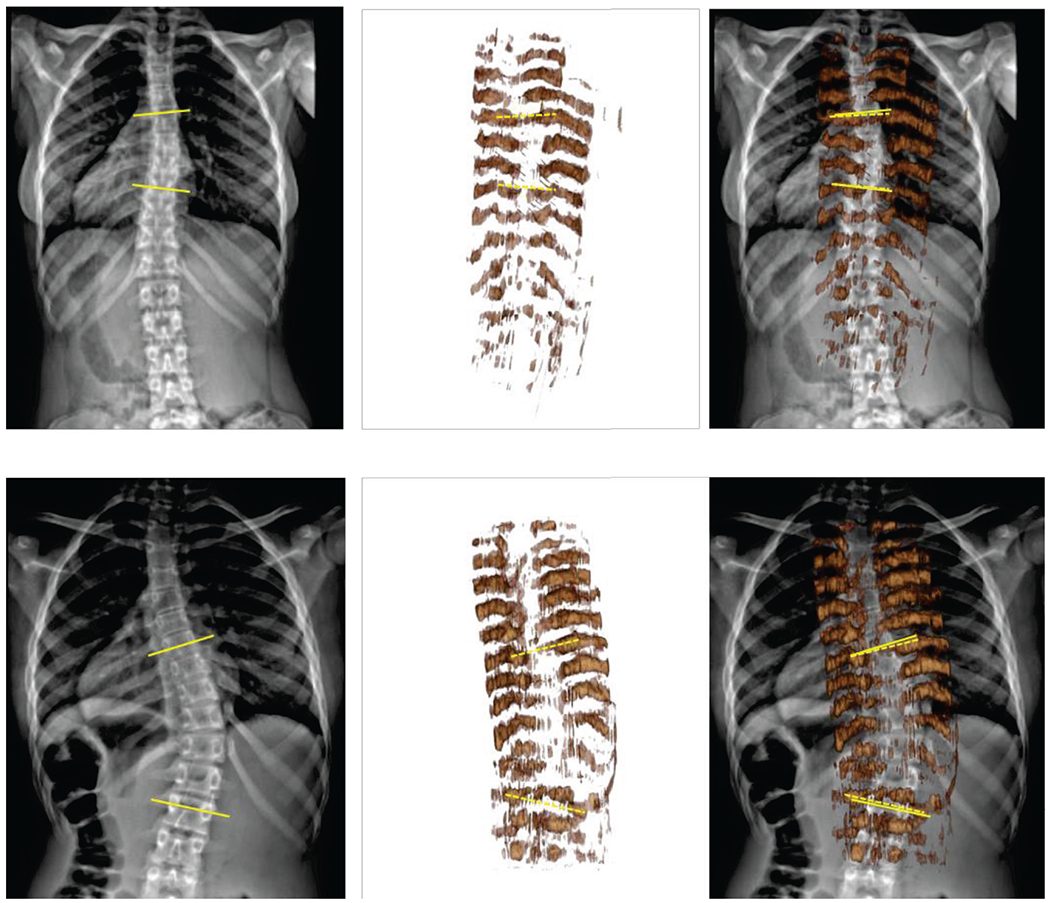
Comparison of cross-validation and patient tests by quantitative evaluation metrics. All values are shown as average, minimum, and maximum. Fuzzy segmentation metrics are shown on the left (A), binary segmentation metrics after thresholding are shown in the middle (B), and optimal threshold values are shown on the right (C).
Fig. 7.
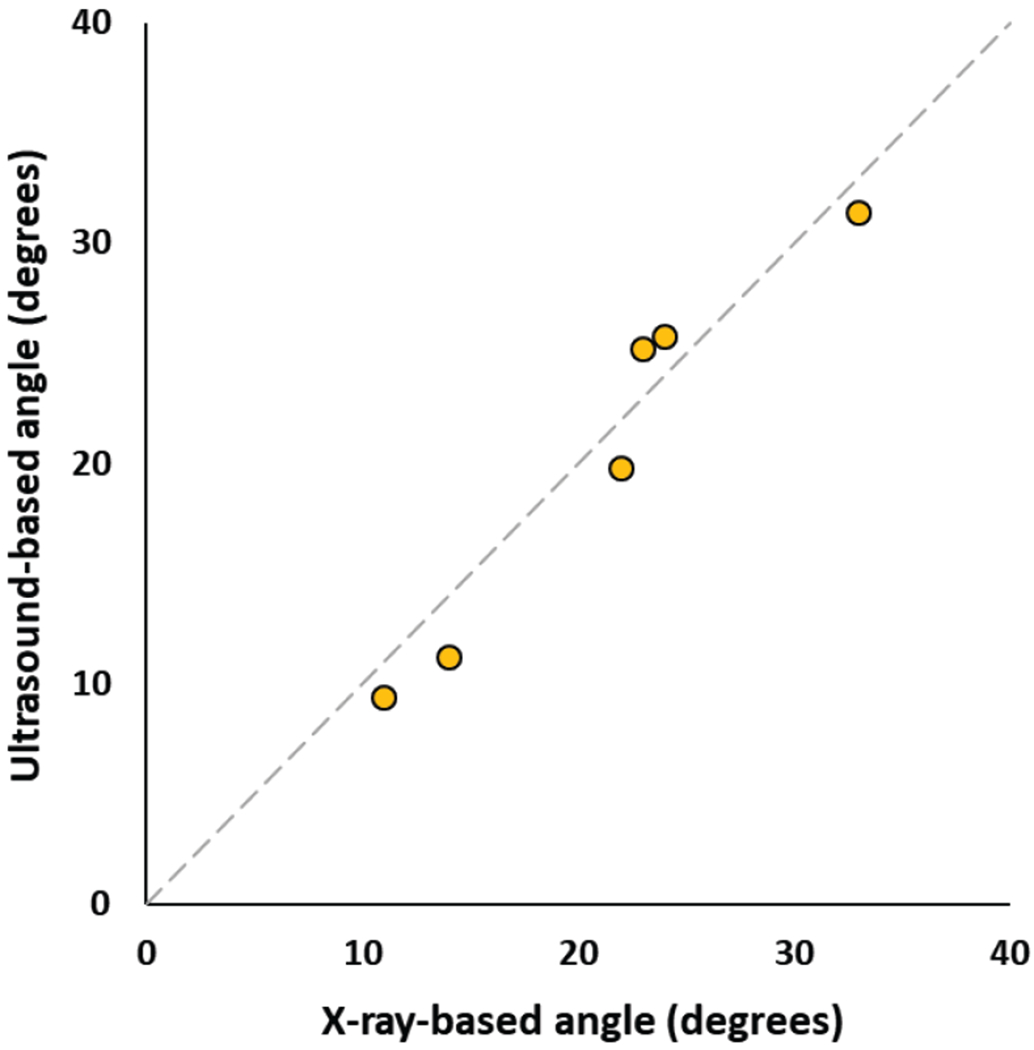
Scatter plot of ultrasound-based vs. X-ray based transverse process angles measured in patients.
IV. Discussion
Neural networks for bone segmentation were trained on a healthy, adult, volunteer population. The trained neural networks were then tested on a pediatric patient population with scoliotic spines. The performance of the networks decreased when applied to the patient population. However, through optimal thresholding, the loss in performance was minimized and the ultrasound volume reconstructions were usable for accurate scoliosis measurement in patients.
The main limitation of our study is its low sample size. Although our results are promising, the generalization of performance needs to be tested in larger and more diverse patient populations. Different ultrasound machines, imaging protocols, and different sonographers also need to be included in future studies. Another limitation observed during our experiments is the range of optimal prediction thresholds. A large part (around 99%) of the fuzzy prediction range was never used for visualization to separate bones from background. The optimal threshold was lower than 1% in both validation and test cases. For this reason, the prediction values had to undergo logarithmic transformation for optimal visualization in volume reconstructions with the 0-255 intensity range typical from most displays.
Best thresholds based on ROC analysis caused high recall and low precision binary metrics compared to fuzzy metrics. This is due to heavy class imbalance between foreground and background in our images. Foreground often covers less than 1% of the ultrasound images, therefore including lower prediction values in the foreground has relatively little effect on background classification. Despite the imbalance, we kept the definition of “best” threshold based on ROC curve analysis, because we found that similar thresholds were chosen by users while setting the opacity threshold of volume visualization. This indicates that users do not mind over-segmentation in exchange for full visualization of the spine. We tried to compensate class imbalance by further adjusting the class weights in the loss function during model training, but more imbalanced weights resulted in worse validation metrics. Additionally, the optimal visualization threshold was found lower in the lumbar region than in the thoracic region during evaluation testing. Therefore, if the proposed segmentation method is deployed in clinical practice, the visualization threshold will need to be adjusted manually by users for each patient and each spine segment. In our test, this was conveniently achieved with a slider on the user interface.
There are also inherent limitations of ultrasound imaging compared to X-ray, due to which ultrasound can never fully replace X-ray imaging. Acoustic shadowing hides all bone surfaces deeper than the posterior surface of vertebrae and ribs. In Fig. 6, some structures of the spine surfaces are missing, even though not covered by acoustic shadowing, e.g. spinous processes and laminae. Probably because the training segmentations only included transverse processes and ribs, which are the structures needed for spinal curvature measurement. Deep learning process optimized segmentation for these structures to maximize similarity metrics with manual segmentations in the loss function. Image quality could be further improved by adjusting ultrasound settings for each patient and each spine segment (thoracic vs. lumbar). Although adaptive settings may improve image clarity, we chose to keep the settings at an average level to make the method immediately accessible for a wider range of users without sonography background. Automatic setting of imaging parameters is a subject of current research. Another limitation of tracked ultrasound compared to X-ray is that tracked ultrasound imaging takes 2-3 minutes. If the patient posture changes during this time, the scan needs to be restarted due to a mismatch between parts of the scan. We helped patients stand still by facing a wall. If patient motion becomes an issue, then additional optical markers may be added to automatically detect patient posture changes and warn the operator to restart the scan. Larger patient stabilization tools would risk portability and simple usability of the system. A limitation of optical position tracking is the accidental occlusion of optical markers, and the accumulation of tracking errors when the reference and ultrasound markers are far from each other. The SlicerIGT software has audio and visual alerts when the tracker line of sight is blocked, so the operator is notified that the scan needs to be restarted. To keep tracking error below 1 mm even when scanning the upper thoracic spine segments, we designed large optical markers (12 cm diameter).
Traditionally, vertebral endplates are used for scoliosis measurement, because those are the most visible features in X-ray. The angle between vertebra endplates of a scoliotic curve, called Cobb angle, cannot be directly measured by ultrasound in the absence of vertebral bodies in ultrasound images. Using posterior anatomical landmarks, like the transverse processes, was proposed as an alternative way to measure scoliosis with ultrasound images [6]. The clinical value of Cobb angles is already established in the radiology literature, but the clinical value of transverse process angles still needs to be explored in future studies. These limitations indicate that more research is needed in the future to establish the clinical value of the presented method using transverse processes. We hope to facilitate future research by releasing all source code and data used in this paper in the public domain.
If a representative sample of the images is included in the training dataset, the trained models perform with excellent accuracy, as shown by our cross-validation results. Tests on patient images show that trained neural network models still perform well when used on a population of different age and spinal deformities. Although generalization of neural network models is a difficult research area, we hypothesize that segmentation performance was good in our experiment because individual ultrasound images only capture a limited range of the patient anatomy, less characteristic of pathological spine curvatures. Our limited subject population did not allow us to conduct proper statistical analysis on what clinical features (e.g. age or body mass index) affect the performance of trained neural networks. However, our results provide a promising example for generalization of trained neural networks when used in a new patient population. When ultrasound scans from a wider patient population becomes available, we may also develop better image augmentation methods for neural network training that capture more characteristic variations in images.
U-Net for spine ultrasound segmentation did not require significant changes in its architecture or source code. Essentially, we used the same U-Net architecture in this study that has also been successfully used in segmentation of cells in microscopy images [25], separate water and fat signal in magnetic resonance images [26], and for segmentation of pedestrians in infrared video frames [27], just to name a few examples. In the future, if we find a population, in which our U-Net based spine ultrasound segmentation is not accurate enough, we may further improve its performance by adding new samples to the training dataset. In contrast, traditionally designed image segmentation algorithms require a deep understanding of the methodological details to implement improvements. The difficulty in implementing algorithmic changes has been a major limitation of incremental development in the past. Hopefully this difficulty will be overcome by modern neural networks.
Ultrasound is a promising alternative to X-ray in spine imaging due to its safety and universal accessibility. Ultrasound combined with position tracking allows 3D reconstruction of larger image volumes that contain many spine segments. When anatomical landmarks can be identified in these volumes, tracked ultrasound may be sufficiently accurate for other clinical applications besides scoliosis measurement, such as needle guidance [28][29] and pedicle screw placement [30]. The premise of our work is that for these and other tasks involving landmark identification in spine ultrasound, if bone echoes can be highlighted automatically, users with less experience in sonography could achieve more accurate and consistent results. Furthermore, if position tracking is used, highlighted bone echoes can be reconstructed into 3-dimensional surfaces of bones for fast and convenient use by radiologists, orthopedic surgeons, and other practitioners. Although reconstructed ultrasound volumes may never replace X-ray due to acoustic artifacts, ultrasound reconstructions are true 3-dimensional volumes, which may also have advantages over X-ray. Reconstructed ultrasound is suitable for vertebra rotation measurement in the axial plane, which is not possible in projected X-ray images.
V. Conclusion
We trained a neural network model on an easily accessible training dataset from healthy volunteers and successfully used it to reconstruct spine volumes for curvature measurement in pediatric patients with scoliosis. The presented reconstruction method may become a viable alternative to X-ray in clinical screening, monitoring, or treatment applications.
Acknowledgment
We thank Jonise Handy-Richards at Children’s National Medical Center for her assistance with patient recruitment.
This work was funded, in part, by NIH/NIBIB and NIH/NIGMS (via grant 1R01EB021396-01A1 - Slicer+PLUS: Point-of-Care Ultrasound) and by CANARIE’s Research Software Program. Gabor Fichtinger is supported as a Canada Research Chair in Computer-Integrated Surgery.
Contributor Information
Tamas Ungi, Laboratory for Percutaneous Surgery at the School of Computing, Queen’s University, Kingston, ON, Canada.
Hastings Greer, Kitware Inc., Carrboro, NC, USA..
Kyle R. Sunderland, Laboratory for Percutaneous Surgery at the School of Computing, Queen’s University, Kingston, ON, Canada
Victoria Wu, Laboratory for Percutaneous Surgery at the School of Computing, Queen’s University, Kingston, ON, Canada.
Zachary M. C. Baum, Laboratory for Percutaneous Surgery at the School of Computing, Queen’s University, Kingston, ON, Canada
Christopher Schlenger, Verdure Imaging, Inc., Stockton, CA, USA..
Matthew Oetgen, Children’s National Medical Center, Washington, DC, USA..
Kevin Cleary, Children’s National Medical Center, Washington, DC, USA..
Stephen Aylward, Kitware Inc., Carrboro, NC, USA..
Gabor Fichtinger, Laboratory for Percutaneous Surgery at the School of Computing, Queen’s University, Kingston, ON, Canada.
References
- [1].Konieczny MR, Senyurt H, and Krauspe R, “Epidemiology of adolescent idiopathic scoliosis,” Journal of children’s orthopaedics, vol. 7, no. 1, pp. 3–9, Dec. 2012. [DOI] [PMC free article] [PubMed] [Google Scholar]
- [2].Weinstein SL et al. , “Effects of bracing in adolescents with idiopathic scoliosis,” N Engl J Med, vol. 369, no. 16, pp. 1512–21, Oct. 2013. [DOI] [PMC free article] [PubMed] [Google Scholar]
- [3].Doody MM et al. , “Breast cancer mortality after diagnostic radiography: findings from the US Scoliosis Cohort Study,” Spine, vol. 25, no. 16, pp. 2052–63, Aug. 2000. [DOI] [PubMed] [Google Scholar]
- [4].Ronckers CM et al. , “Cancer mortality among women frequently exposed to radiographic examinations for spinal disorders,” Radiat Res., vol. 174, no. 1, pp. 83–90, Jul. 2010. [DOI] [PMC free article] [PubMed] [Google Scholar]
- [5].Deurloo JA and Verkerk PH, “To screen or not to screen for adolescent idiopathic scoliosis? A review of the literature,” Public Health, vol. 129, no. 9, pp. 1267–1272, Sep. 2015. [DOI] [PubMed] [Google Scholar]
- [6].Ungi T et al. , “Spinal curvature measurement by tracked ultrasound snapshots,” Ultrasound in medicine & biology, vol. 40, no. 2, pp. 447–54, Feb. 2014. [DOI] [PubMed] [Google Scholar]
- [7].Cheung CW et al. , “Ultrasound volume projection imaging for assessment of scoliosis,” IEEE transactions on medical imaging, vol 34, no. 8, pp. 1760–8, Jan. 2015. [DOI] [PubMed] [Google Scholar]
- [8].Foroughi P et al. , “Localization of pelvic anatomical coordinate system using US/atlas registration for total hip replacement,” International Conference on Medical Image Computing and Computer-Assisted Intervention, pp. 871–879. Springer, Berlin, Heidelberg, Sep. 2008. [DOI] [PubMed] [Google Scholar]
- [9].Berton F et al. , “Segmentation of the spinous process and its acoustic shadow in vertebral ultrasound images,” Computers in biology and medicine, vol. 72, pp. 201–11, May 2016. [DOI] [PubMed] [Google Scholar]
- [10].Tran D and Rohling RN, “Automatic detection of lumbar anatomy in ultrasound images of human subjects,” IEEE Trans Biomed Eng, vol. 57, no. 9, pp. 2248–2256, Sep. 2010. [DOI] [PubMed] [Google Scholar]
- [11].Owen K et al. , “Improved elevational and azimuthal motion tracking using sector scans,” IEEE Transactions on Ultrasonics, Ferroelectrics, and Frequency Control, vol. 60, no. 4, pp. 671–84, Mar. 2013. [DOI] [PubMed] [Google Scholar]
- [12].Oh TT et al. , “A novel approach to neuraxial anesthesia: application of an automated ultrasound spinal landmark identification,” BMC Anesthesiology, vol. 19, no. 1, pp 57 Dec. 2019. [DOI] [PMC free article] [PubMed] [Google Scholar]
- [13].Tiouririne M et al. , “Imaging performance of a handheld ultrasound system with real-time computer-aided detection of lumbar spine anatomy: a feasibility study.” Investigative Radiology, vol. 52, no. 8, pp. 447, Aug. 2017. [DOI] [PMC free article] [PubMed] [Google Scholar]
- [14].Singla P et al. , “Feasibility of Spinal Anesthesia Placement Using Automated Interpretation of Lumbar Ultrasound Images: A Prospective Randomized Controlled Trial.” Journal of Anesthesia & Clinical Research, vol. 10, no. 2, 2019. [DOI] [PMC free article] [PubMed] [Google Scholar]
- [15].Meiburger KM, Acharya UR, and Molinari F, “Automated localization and segmentation techniques for B-mode ultrasound images: a review,” Computers in biology and medicine, vol. 92, pp. 210–35, Jan. 2018. [DOI] [PubMed] [Google Scholar]
- [16].Pinter C et al. , “Real-time transverse process detection in ultrasound,” in Proc. SPIE 10576, Medical Imaging 2018: Image-Guided Procedures, Robotic Interventions, and Modeling, 105760Y, Mar. 13, 2018. [Google Scholar]
- [17].Salehi M et al. , “Precise Ultrasound Bone Registration with Learning-Based Segmentation and Speed of Sound Calibration”. In: Descoteaux M et al., (eds) Medical Image Computing and Computer-Assisted Intervention — MICCAI 2017. Lecture Notes in Computer Science, vol 10434 Springer, Cham, Sep. 2017. [Google Scholar]
- [18].Baka N, Leenstra S, van Walsum T, “Ultrasound Aided Vertebral Level Localization for Lumbar Surgery,” IEEE Trans Med Imaging., vol. 36, no. 10, pp. 2138–2147, Oct. 2017. [DOI] [PubMed] [Google Scholar]
- [19].Wang P, Patel VM, and Hacihaliloglu I, “Simultaneous Segmentation and Classification of Bone Surfaces from Ultrasound Using a Multi-feature Guided CNN,” In: Frangi A et al. , (eds) Medical Image Computing and Computer Assisted Intervention – MICCAI 2018. Lecture Notes in Computer Science, vol. 11073 Springer, Cham, Sep. 2018. [Google Scholar]
- [20].Yamashita R et al. , “Convolutional neural networks: an overview and application in radiology,” Insights into imaging, vol. 9, no. 4, pp. 611–29, Aug. 2018. [DOI] [PMC free article] [PubMed] [Google Scholar]
- [21].Taha AA and Hanbury A, “Metrics for evaluating 3D medical image segmentation: analysis, selection, and tool,” BMC medical imaging, vol. 15, no. 1, pp. 29, Dec. 2015. [DOI] [PMC free article] [PubMed] [Google Scholar]
- [22].Vaughan T et al. , “Hole filling with oriented sticks in ultrasound volume reconstruction,” J Med Imaging (Bellingham), vol. 2, no. 3, pp. 034002, Jul. 2015. [DOI] [PMC free article] [PubMed] [Google Scholar]
- [23].Malfair D et al. , “Radiographic evaluation of scoliosis: review,” AJR Am J Roentgenol, vol. 194, no. 3 (Suppl), pp. S8–S22, 2010. [DOI] [PubMed] [Google Scholar]
- [24].Ungi T, Lasso A, and Fichtinger G, “Open-source platforms for navigated image-guided interventions,” Med Image Anal, vol. 33, pp. 181–186, Oct. 2016. [DOI] [PubMed] [Google Scholar]
- [25].Ronneberger O, Fischer P, and Brox T, “U-net: Convolutional networks for biomedical image segmentation,” In International Conference on Medical image computing and computer-assisted intervention (Springer, Cham), vol 9351, pp. 234–241, Oct. 2015. [Google Scholar]
- [26].Andersson J, Ahlström H, and Kullberg J, “Separation of water and fat signal in whole-body gradient echo scans using convolutional neural networks,” Magn Reson Med, vol. 82, no. 3, pp. 1177–1186, Sep. 2019. [DOI] [PMC free article] [PubMed] [Google Scholar]
- [27].Wang P and Bai X, “Thermal infrared pedestrian segmentation based on conditional GAN,” IEEE Transactions on Image Processing, vol. vol. 28, no. 12, pp. 6007–21, Jul. 2019. [DOI] [PubMed] [Google Scholar]
- [28].Ungi T et al. , “Spinal needle navigation by tracked ultrasound snapshots,” IEEE Transactions on Biomedical Engineering, vol. 59, no. 10, pp. 2766–72, Jul. 2012. [DOI] [PubMed] [Google Scholar]
- [29].Al-Deen Ashab H et al. , “An augmented reality system for epidural anesthesia (AREA): prepuncture identification of vertebrae,” IEEE Trans Biomed Eng, vol. 60, no. 9, pp. 2636–44, Sep. 2013. [DOI] [PubMed] [Google Scholar]
- [30].Ungi T et al. , “Tracked ultrasound snapshots in percutaneous pedicle screw placement navigation: a feasibility study,” Clinical Orthopaedics and Related Research, vol. 471, no. 12, pp. 4047–55, Dec. 2013. [DOI] [PMC free article] [PubMed] [Google Scholar]


