

Abstract
Although TP53 is the most commonly mutated gene in human cancers, the p53-dependent transcriptional programs mediating tumor suppression remain incompletely understood. Here, to uncover critical components downstream of p53 in tumor suppression, we perform unbiased RNAi and CRISPR/Cas9-based genetic screens in vivo. These screens converge upon the p53-inducible gene Zmat3, encoding an RNA-binding-protein, and we demonstrate that ZMAT3 is an important tumor suppressor downstream of p53 in mouse KrasG12D-driven lung and liver cancers and human carcinomas. Integrative analysis of the ZMAT3 RNA-binding landscape and transcriptomic profiling reveals that ZMAT3 directly modulates exon inclusion in transcripts encoding proteins of diverse functions, including the p53 inhibitors MDM4 and MDM2, splicing regulators, and components of varied cellular processes. Interestingly, these exons are enriched in NMD signals, and, accordingly, ZMAT3 broadly affects target transcript stability. Collectively, these studies reveal ZMAT3 as a novel RNA-splicing and homeostasis regulator and key component of p53-mediated tumor suppression.
Graphical Abstract
eTOC
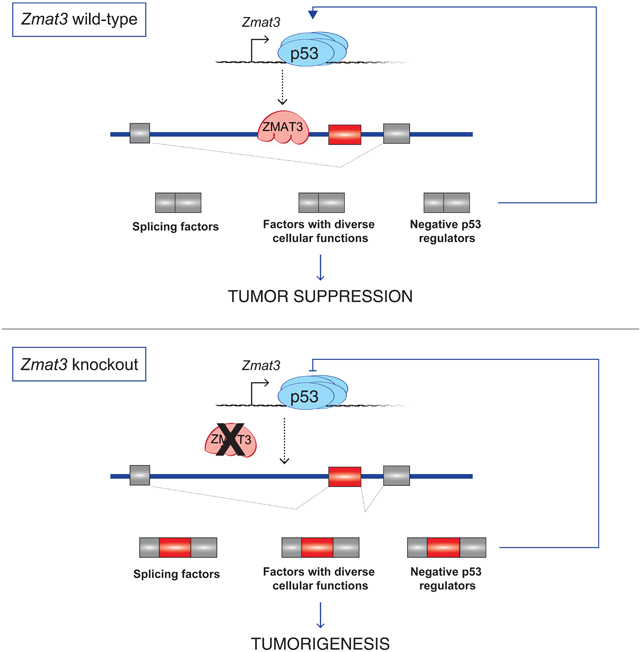
p53 is a critically important but incompletely understood tumor suppressor. Bieging-Rolett et al. identify the p53 target gene Zmat3, encoding an RNA-binding protein, as a key tumor suppressor downstream of p53 in a broad range of cancers, and uncover a role for ZMAT3 in regulating alternative RNA splicing.
Introduction
TP53 gene is the most commonly mutated gene in human cancers, underscoring its critical role in tumor suppression (Kandoth et al., 2013). p53 is a transcriptional activator that responds to diverse stress signals by regulating gene expression programs that limit neoplastic behavior (Bieging et al., 2014; Vousden and Prives, 2009). The best characterized p53 programs are in response to acute DNA damage, when p53 transcriptionally induces the p21 CDK inhibitor to trigger cell cycle arrest and DNA repair or pro-apoptotic BCL2 family members Puma and Noxa, to eradicate damaged cells through apoptosis. The ability of p53 to transactivate target genes is essential for tumor suppression, as TP53 mutations in humans compromise sequence-specific DNA binding and p53 target gene induction. Moreover, knock-in mice expressing a transcriptionally-dead p53 mutant with mutations in both transactivation domains (TADs) phenocopy p53 null mice in tumor predisposition (Brady et al., 2011; Jiang et al., 2011; Mello et al., 2017).
A variety of mutant mouse strains have been generated to illuminate the gene expression programs downstream of p53 most critical to tumor suppression. Analysis of a p53 TAD1 (p5325,26) mutant knock-in mouse strain revealed that p5325,26 is severely compromised in activating most p53 target genes - including many classical p53 target genes like p21, Puma, and Noxa - yet retains the ability to activate a small subset of primarily novel target genes (Brady et al., 2011). Interestingly, this mutant is fully competent for suppressing various cancers, including B and T-cell lymphomas, medulloblastoma, and lung adenocarcinoma (Brady et al., 2011; Jiang et al., 2011). These findings suggested that noncanonical p53 target genes may be critical for p53-mediated tumor suppression. Further support for this idea came from the analysis of mice expressing p533KR - an acetylation site mutant that cannot activate classical p53 target genes - and p21−/−;Puma−/−;Noxa−/− mice, neither of which are prone to spontaneous cancers (Li et al., 2012b; Valente et al., 2013). Collectively, these studies suggested that p53-mediated tumor suppression does not require classical p53 target genes, including p21, Noxa, and Puma, or that other genes can compensate for loss of these genes. These studies have thus prompted a renewed investigation of the transcriptional programs underlying p53-mediated tumor suppression (Bieging et al., 2014; Mello and Attardi, 2018).
Recent studies have implicated specific p53-inducible genes in p53-mediated tumor suppression in different settings. In Myc-induced hepatocellular carcinoma, p53 induction of Abca1 and suppression of the mevalonate pathway are important for tumor suppression (Moon et al., 2019b). The p53-regulated DNA repair gene Mlh1 contributes to the suppression of leukemia in an Eμ-Myc;Puma−/− background (Janic et al., 2018). In pancreatic cancer, a p53-PTPN14-YAP axis operates to suppress the development of this disease (Mello et al., 2017). Despite these recent advances, our understanding of p53 function in tumor suppression remains far from complete. It is unclear, for example, whether different p53 pathways are involved in distinct tumor types and in response to different oncogenic drivers or whether there are core p53 pathways critical for suppression of tumorigenesis in multiple contexts. It would therefore be enlightening to use an unbiased approach to identify p53-inducible genes most fundamental to tumor suppression.
Here, we investigate the p53 transcriptional programs critical for tumor suppression, which will be pivotal not only for understanding the molecular underpinnings of p53 function but also for ultimately gaining insights that would allow development of therapies aimed at the critically important but difficult-to-target p53 pathway. We leverage the tumor suppression-competent p5325,26 mutant to delineate p53 tumor suppression-associated genes (TSAGs) whose expression is tightly linked to tumor suppression, and we interrogate which TSAGs display tumor suppressor activity using both unbiased RNA interference and CRISPR/Cas9 pooled screens in vivo. These studies, coupled with autochthonous mouse model and human cancer genome analyses, unveil the RNA binding protein ZMAT3 as a key tumor suppressor downstream of p53. Molecular analyses reveal a novel function for ZMAT3 in RNA homeostasis via modulating alternative splicing, resulting in multifaceted effects on diverse pathways. These findings establish a ZMAT3-regulated splicing program, providing critical new insight into a core mediator of p53-dependent tumor suppression.
Results
Identification of p53 TSAGs
Identifying p53 target genes critical for tumor suppression has been challenging due to the vast number of p53-regulated genes, as illustrated by the observation that >1000 genes are induced by p53 in oncogene-expressing fibroblasts (Figure 1A, S1A) (Brady et al., 2011). To identify the most relevant p53-regulated genes for tumor suppression, we sought to pinpoint p53 target genes whose expression is tightly linked to tumor suppression. We leveraged the p5325,26 mutant, which activates only a subset of p53 target genes yet is fully competent for tumor suppression in multiple in vivo cancer models (Brady et al., 2011; Jiang et al., 2011). By uncovering the p53-dependent genes still induced by this mutant in neoplastic mouse embryonic fibroblasts (MEFs) expressing HrasG12V -one of the most commonly activated genes in human cancer- we generated a list of 87 genes, which we term p53 tumor suppression-associated genes (TSAGs; Figure 1A, 1B). The majority of p53 TSAGs have one or more p53-bound response elements (RE) near or within their gene body, suggesting that they are direct p53 targets (Table S1, see Methods). Moreover, many p53 TSAGs are p53-inducible in different cell types, including Eμ-Myc-driven lymphoma and KrasG12D-induced lung adenocarcinoma (LUAD) cells (Figure S1B, S1C). The robust expression of these genes during tumor suppression, coupled with their p53-inducibility in various contexts, supports their potential importance in the p53 tumor suppression program.
Figure 1: Identification and functional screening of p53 tumor suppression-associated genes (TSAGs).
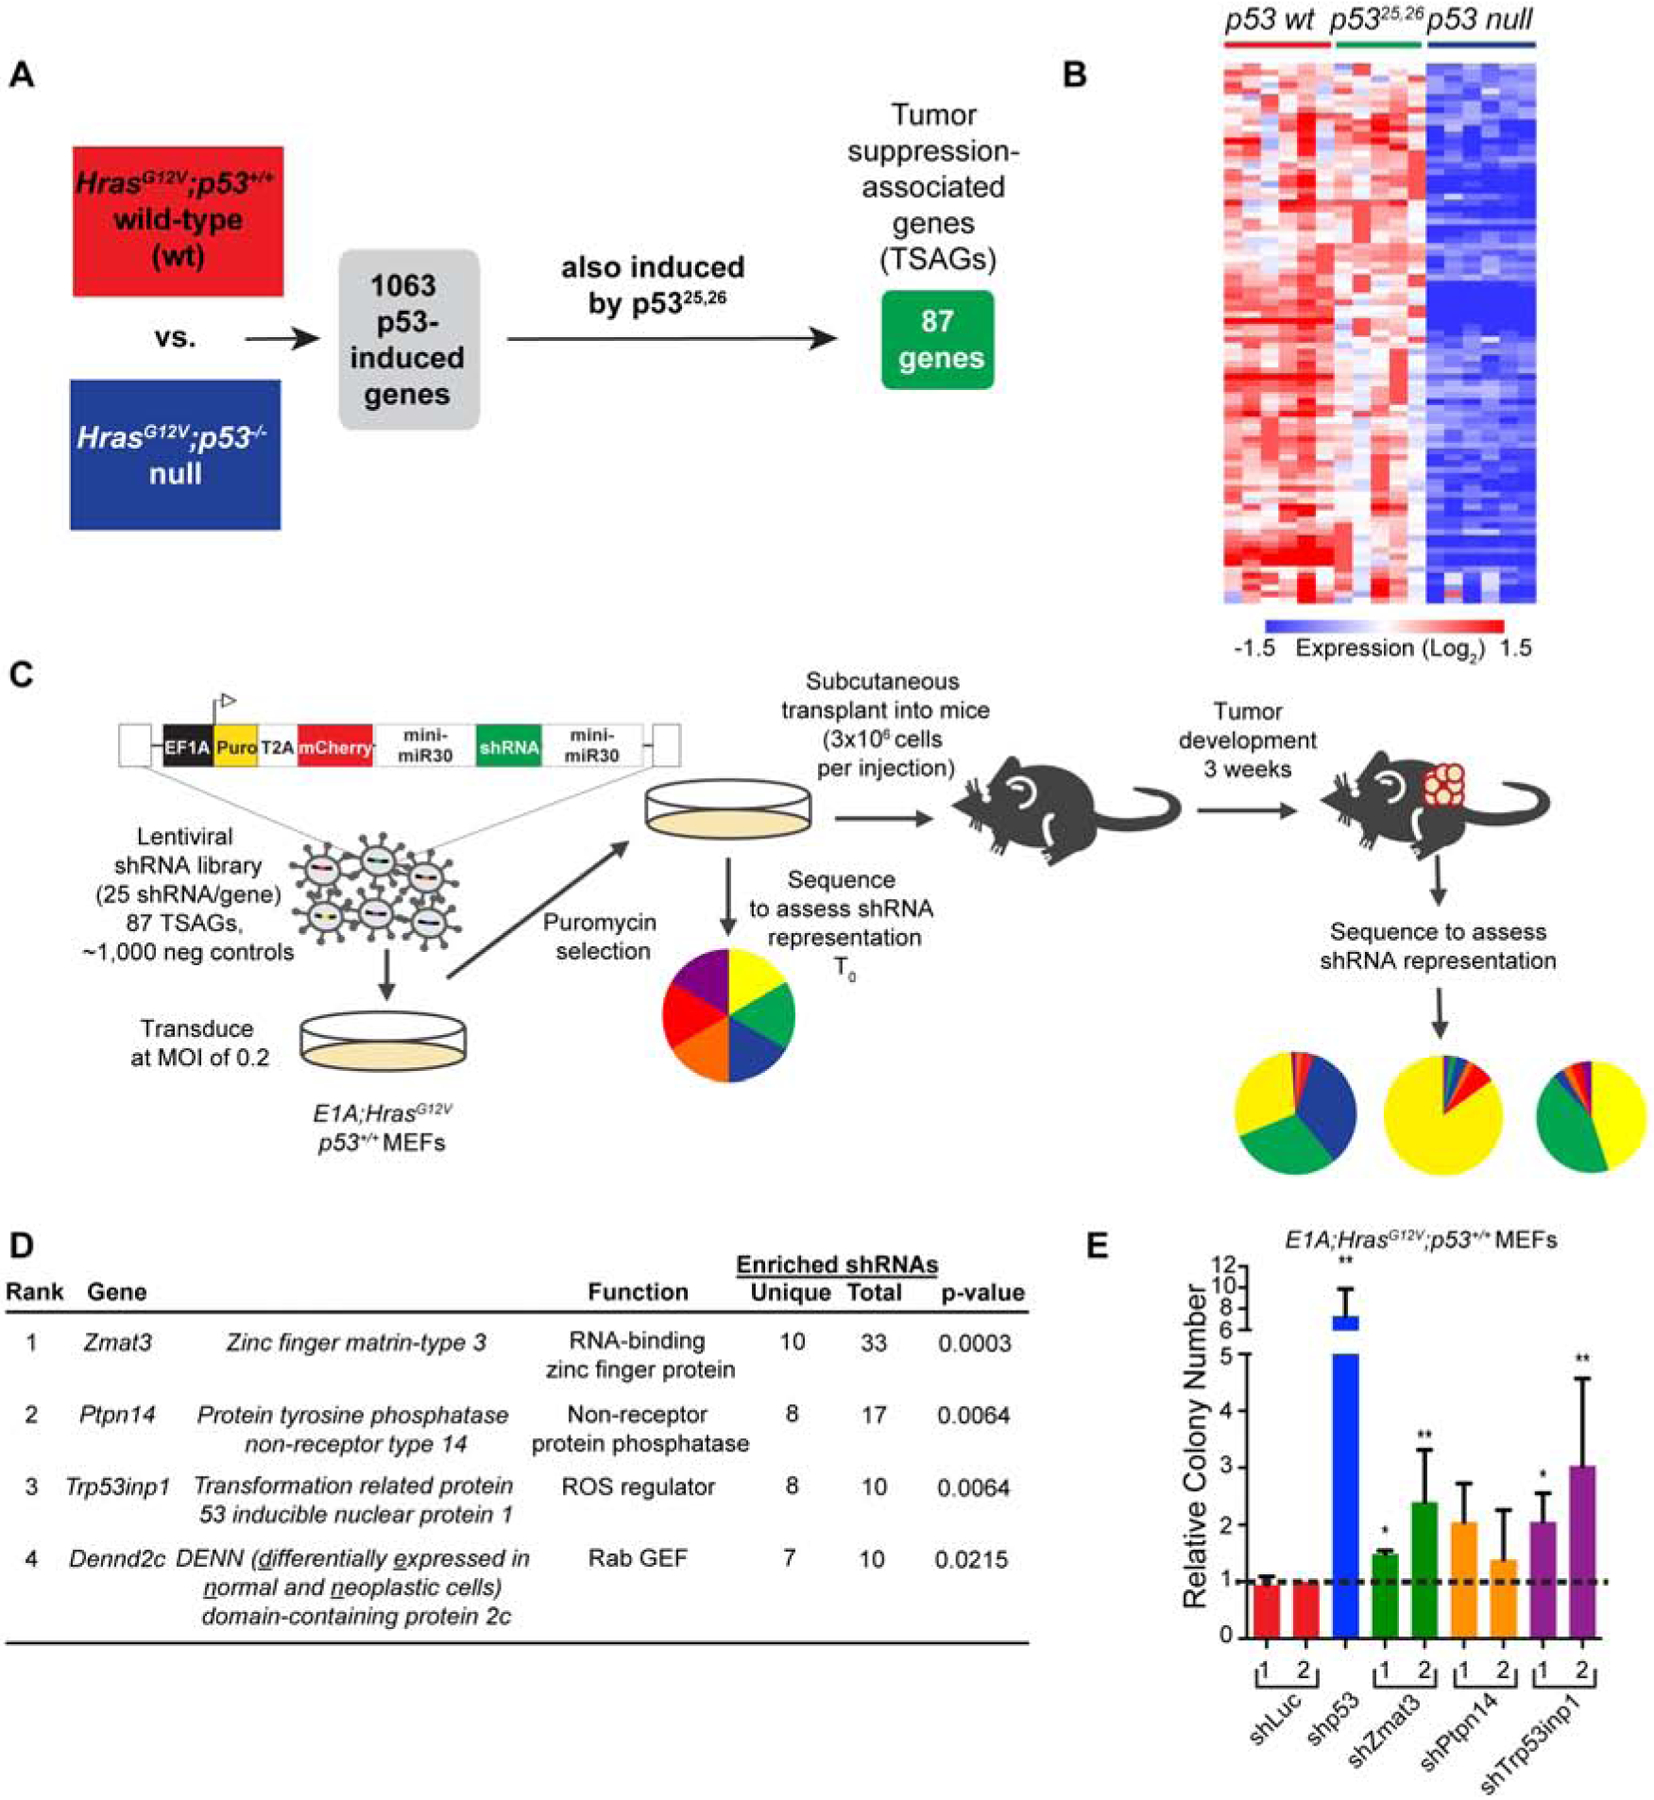
(A) Bioinformatics analyses reveal 1063 genes activated by p53 in HRasG12V MEFs, 87 of which are also activated by the p5325,26 mutant (TSAGs). (B) Heat map of expression of 87 p53 TSAGs in HRasG12V MEFs homozygous for p53wt, p5325,26, or p53 null alleles. Columns represent independent MEF lines. (C) E1A;HRasG12V;p53+/+ MEFs transduced with a lentiviral shRNA library were collected before transplantation (T0) and after 3 weeks of subcutaneous growth in Scid mice to assess shRNA representation. (D) Top TSAG hits (n=9 tumors). “Unique” refers to the number of unique shRNAs enriched relative to negative controls in the 9 tumors, “Total” accounts for the same shRNAs enriched in multiple tumors. p-values, hypergeometric test. (E) Soft agar assay. Mean colony number +/− s.d. of 3 independent E1A;HRasG12V;p53+/+ MEFs lines (each in triplicate) after expression of individual shRNAs. Data are relative to shLuc shRNAs. “*” indicates p< 0.05 and “**” indicates p<0.01, two-tailed paired t-test.
RNA Interference Screening for Functional Tumor Suppressors
To interrogate which of the 87 TSAGs are functionally important for tumor suppression, we first used an in vivo pooled shRNA genetic screening approach. We leveraged an in vivo tumor model based on subcutaneous growth of primary MEFs expressing both E1A and HrasG12V oncogenes (Jiang et al., 2011; Lowe et al., 1994). These cells provide a tractable model with an intact p19ARF-p53 tumor suppressor signaling pathway because they are derived from primary cells and cultured minimally. Importantly, p53 is critical for tumor suppression in this model (Lowe et al., 1994)(Figure S1D–S1F). We generated a lentiviral ultracomplex pooled shRNA library comprising 25 unique shRNAs targeting each TSAG, along with 1,000 negative control (NC) shRNAs (Bassik et al., 2009), a strategy that mitigates the effects of false negative and false positives to ensure sensitivity and efficacy (Figure 1C). After transduction, we subcutaneously injected E1A;HrasG12V MEFs into recipient mice and allowed 3 weeks for tumor formation. To identify genes with tumor suppressor function, we determined which shRNAs were enriched relative to the NC shRNAs in the tumors (Figure 1D, Table S2; see Methods). The gene represented by the highest number of enriched shRNAs (10) was Zmat3, followed by Ptpn14, Trp53inp1, and Dennd2c, with at least 7 shRNAs detected per gene (Figure 1D, Table S2). We validated these hits by expressing individual enriched shRNAs in E1A;HrasG12V MEFs, which increased anchorage-independent growth relative to control cells (Figure 1E, S1G, S1H), demonstrating that these genes suppress transformation. Interestingly, we recently independently identified Ptpn14 as a novel p53 target gene with tumor suppressor activity in pancreatic cancer (Mello et al., 2017), and Trp53inp1 has tumor suppressor activity in mouse models (Al Saati et al., 2013; Cano et al., 2009). Notably, the top hits encode proteins with diverse cellular functions: ZMAT3 encodes a zinc finger RNA-binding protein (RBP) (Israeli et al., 1997; Varmeh-Ziaie et al., 1997), PTPN14 is a protein tyrosine phosphatase that negatively regulates the YAP oncoprotein (Mello et al., 2017), TRP53INP1 is a negative regulator of reactive oxygen species (Cano et al., 2009), and DENND2C is a RAB-GEF (Yoshimura et al., 2010), supporting the idea that p53 modulates multiple distinct pathways to suppress cancer. Accordingly, no single gene knockdown had an effect as dramatic as p53 knockdown (Figure 1E), consistent with the notion that activation of a network of genes by p53 is critical for tumor suppression (Andrysik et al., 2017; Bieging et al., 2014). Overall, the success of the screen is underscored both by the unbiased identification of known tumor suppressors and the discovery of potential new tumor suppressors, including Zmat3 and Dennd2c.
CRISPR/Cas9 Screening for Functional Tumor Suppressors
While we identified several functional tumor suppressor genes using shRNA screening, we reasoned that a gene deletion screen using CRISPR/Cas9 technology could both reinforce our findings and unveil additional tumor suppressor genes (Morgens et al., 2016). We generated lentiviral libraries expressing 10 sgRNAs targeting each of the 87 TSAGs in two pools, with ~40–50 TSAGs and 250 NC sgRNAs per pool. Our screening approach was similar to that described above, except that we transduced E1A;HrasG12V-expressing MEFs derived from Cas9-transgenic mice (Chiou et al., 2015) with the lentiviral sgRNA libraries. We injected E1A;HrasG12V;Cas9 MEFs subcutaneously into recipient mice and allowed 3 weeks for tumor formation (Figure 2A). For each of the 2 libraries, we quantitatively measured enrichment of individual sgRNA elements in tumors relative to input cells to identify genes with significant tumor suppressor activity in individual tumors (Morgens et al., 2016). Strikingly, in tumors derived from pool 1, sgRNAs targeting Zmat3 dominated every tumor, bolstering our shRNA screen results (Figure 2B, S2A, S2C, Table S3). With pool 2, sgRNAs targeting Dennd2c were the most significantly enriched, again reinforcing the shRNA screen results (Figure 2C, S2B, S2D). Interestingly, while sgRNAs targeting other genes showed less enrichment, examination of sgRNA behavior across all tumors identified several additional putative tumor suppressors, such as Sytl1 and Gss, which encode a vesicle trafficking protein (Johnson et al., 2012) and glutathione synthetase (Oppenheimer et al., 1979), respectively (Figure 2D, S2C, S2D, Table S3).
Figure 2: Pooled CRISPR/Cas9 screen identifies functional tumor suppressors.
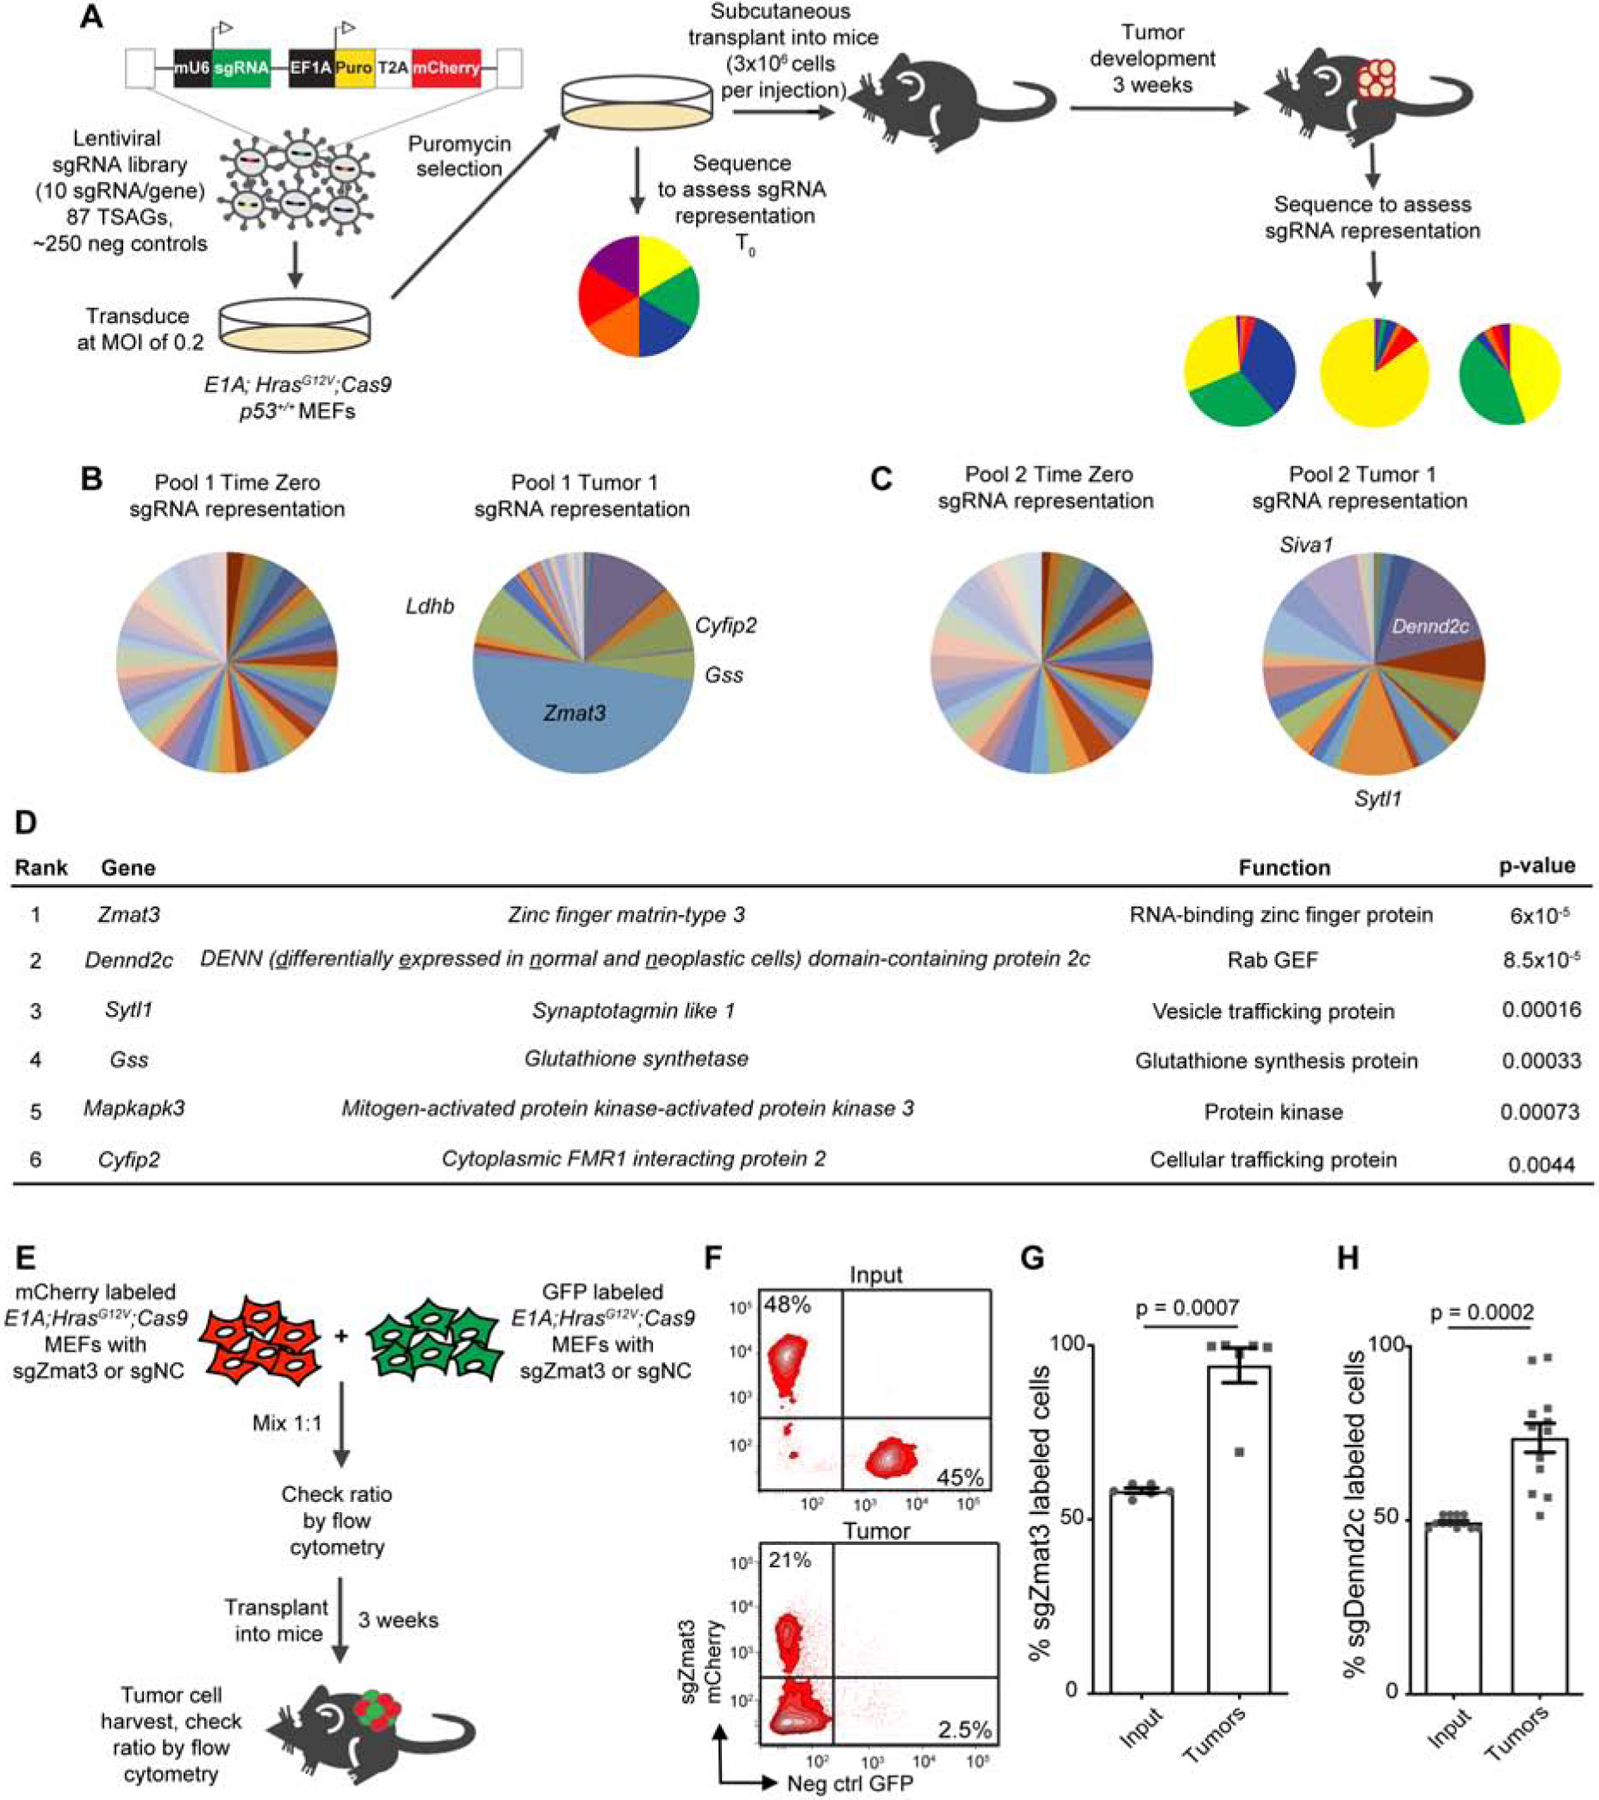
(A). E1A;HRasG12V;p53+/+;Cas9 MEFs transduced with lentiviral sgRNA libraries were collected before transplant at T0 and after 3 weeks of subcutaneous growth in Scid mice to assess sgRNA representation. (B) and (C) Pie charts show representation of sgRNAs (grouped by gene) in each pool at T0 and in example individual tumors. (D) Top TSAGs ranked by enrichment of sgRNAs in tumors relative to T0 (n=6 tumors). p-values, Mann-Whitney U test. (E) E1A;HRasG12V;p53+/+;Cas9 MEFs expressing fluorescent markers and sgZmat3 or negative control sgRNAs were mixed 1:1, injected subcutaneously into Scid mice, and grown for 3 weeks. Dissociated tumor cells were analyzed by FACS. (F) Representative FACS plots show input and tumor populations where the negative control sgRNA cells were labeled with GFP and the sgZmat3 cells with mCherry. (G) and (H) Plots show the mean percentages +/− SEM of cells expressing the sgZmat3 fluorescent label (G) or sgDennd2c fluorescent label (H) relative to all labeled cells (either GFP or mCherry) in both input and tumor populations; n=6 tumors in (G), n=12 in (H). p-values, two-tailed paired t-test.
As Zmat3 and Dennd2c were the most significant hits in independent screens using 2 technologies, we further probed their tumor suppressor capacity. We first performed in vivo competition experiments to quantitatively examine the growth advantage of Zmat3-deficient cells relative to control cells using E1A;HrasG12V;Cas9 MEFs. Individual Zmat3 or NC sgRNAs were expressed from vectors containing either a GFP or mCherry marker. Next, we mixed NC sgRNA and sgZmat3-expressing cells expressing different fluorophores 1:1, verified the mixed composition by flow cytometry, injected the cells subcutaneously into recipient mice, and analyzed the resulting tumors 3 weeks later by flow cytometry (Figure 2E, 2F, S2E). Zmat3-deficient cells consistently dominated the tumors, underscoring the in vivo growth advantage conferred by Zmat3 deficiency and its tumor suppressor activity (Figure 2F, 2G). Similar experiments with Dennd2c sgRNAs revealed that Dennd2c inactivation also conferred a clear growth advantage in vivo, confirming its tumor suppressor capacity (Figure 2H, S2F). Thus, the combined RNAi and CRISPR/Cas9 screening approach converged on 2 potent tumor suppressors, Zmat3 and Dennd2c.
Zmat3 expression is highly p53-dependent in mouse and human cells
We next sought to evaluate the role of Zmat3 and Dennd2c as central components of the p53 tumor suppressor network by assessing how universally p53 regulates them. In mouse cells, both Zmat3 and Dennd2c display p53-dependent expression in diverse cell types, including E1A;HrasG12V MEFs, Eμ-Myc lymphoma cells, and embryonic neural crest cells, and Zmat3 expression is p53-dependent in KrasG12D-driven LUAD cells (Figure 3A)(Bowen et al., 2019). Strikingly, in human fibroblasts and in many human cancer types - including breast (BRCA), lung (LUAD), and liver (LIHC) cancers - ZMAT3 expression is higher in p53-proficient samples than in p53-deficient samples, supporting the notion that ZMAT3 is broadly a p53 target (Figure 3B, 3C). DENND2C, while demonstrating clear p53-dependent expression in human fibroblasts, showed more tissue-specific p53 dependency across cancer types (Figure 3B, 3D, S3A). These findings suggest that DENND2C might play a more tissue-restricted role in p53-mediated tumor suppression.
Figure 3: ZMAT3 expression is highly p53-dependent in mouse and human.
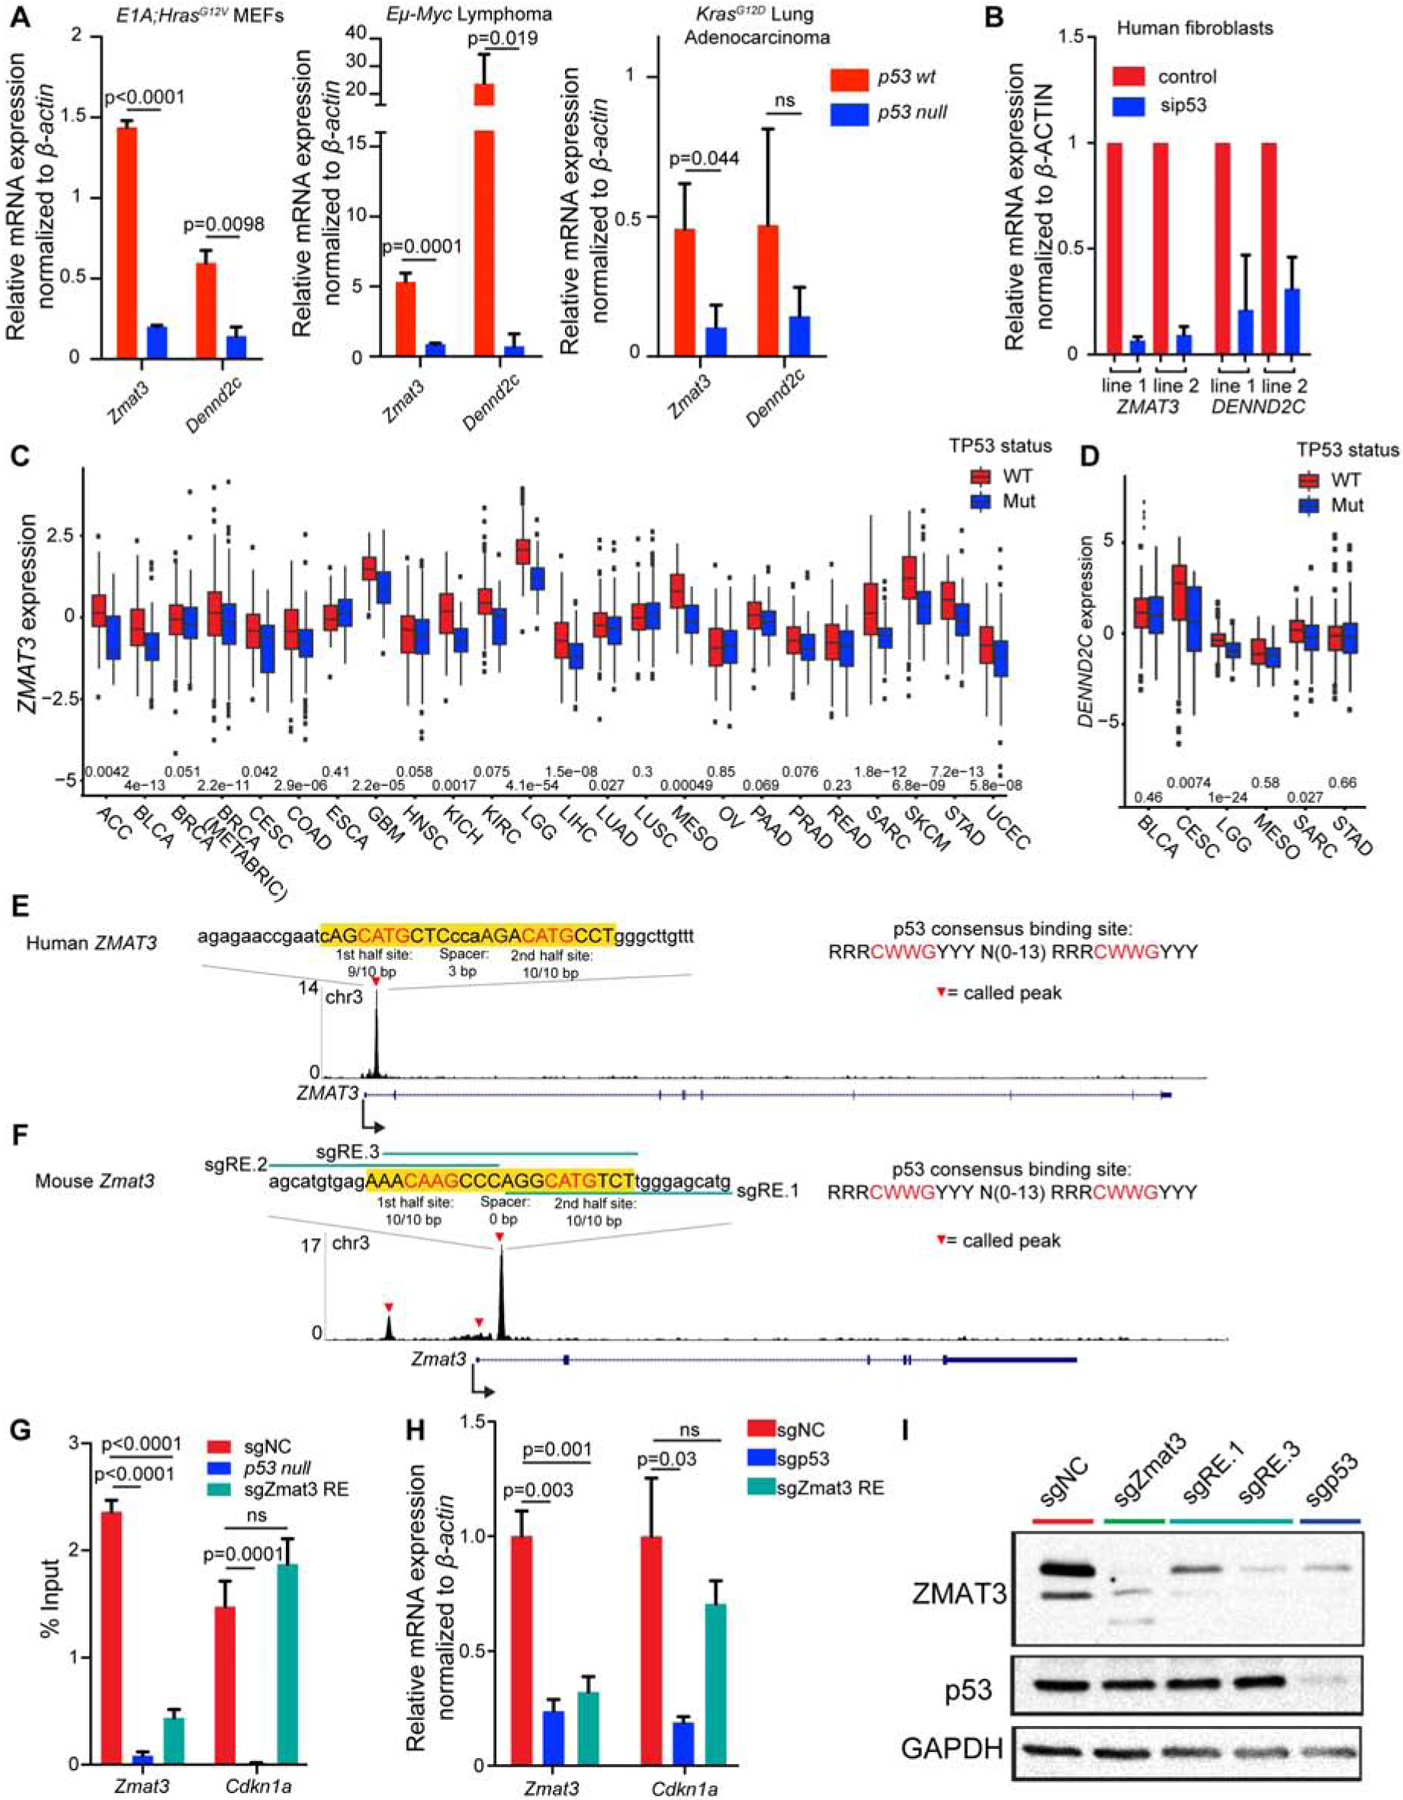
(A) qRT-PCR analysis of mean expression +/− s.d. of Zmat3 and Dennd2c in p53wt and p53 null E1A;HRasG12V MEFs, Eμ-Myc lymphoma cells, and KrasG12D LUAD cells, relative to β-actin. p-values, two-tailed unpaired t-test of different MEF lines (n=3), KrasG12D LUAD cell lines (n=3) or technical replicates (Eμ-Myc lymphoma cell line, n=1). (B) qRT-PCR analysis of mean expression +/− s.d. (technical replicates) of ZMAT3 and DENND2C in primary human fibroblasts transfected with sip53 or a non-targeting siRNA, relative to β-ACTIN. (C) and (D) ZMAT3 expression (C) or DENND2C expression (D) (adjusted for copy number) was mean-centered to zero to allow comparison of samples with wild-type or mutant TP53 in TCGA datasets. The upper and lower hinges correspond to the 1st and 3rd quartiles, the upper and lower whiskers show the 1.5 interquartile ranges, and the center line is the median. p-values, two-tailed t-test. (E) and (F) p53 binding profile from human fibroblast (E) and MEF (F) ChIP-seq data shows called peaks (red triangles). The p53 RE is highlighted in yellow, with the nucleotides exactly matching the consensus motif in capital letters and the core motif in red. (G-I) E1A;HRasG12V;p53+/+;Cas9 MEFs were transduced with the p53 RE, p53, Zmat3, or NC sgRNAs. Any of three sgRNAs were used to disrupt the p53 RE in the largest p53 binding peak [green lines in (F)]. (G) ChIP assays for p53 binding at the Zmat3 or Cdkn2a locus. Graph shows the mean percent of input recovered +/− SEM (n = 6–12 combined technical and biological replicates). p-values, two-tailed unpaired t-test. (H) qRT-PCR analysis of mean expression +/− s.d. of Zmat3 and Cdkn2a relative to β-actin (n ≥ 3 per line). p-values, two-tailed unpaired t-test. (I) ZMAT3 and p53 protein levels analyzed by Western blotting with GAPDH loading control (n ≥3).
The marked p53-dependent expression of ZMAT3 in many human cancer types prompted a deeper investigation of ZMAT3 regulation by p53. Our ChIP-seq data from both human and mouse cells indicated that the ZMAT3 locus is directly bound by p53 (Figure 3E, 3F) (Kenzelmann Broz et al., 2013; Younger et al., 2015). Although previous sequence analysis identified several p53 response elements (RE) in the mouse Zmat3 promoter (Wilhelm et al., 2002), our ChIP-seq analyses revealed a major p53-bound region containing a perfect p53 RE in the first intron of mouse Zmat3 and a near-perfect p53 RE in the first intron of human ZMAT3 (Figure 3E, 3F). To assess the importance of p53 regulation for Zmat3 expression, we designed sgRNAs to disrupt the p53 RE at the major p53-binding peak in mouse Zmat3 (Figure 3F). Perturbing this RE in E1A;HrasG12V;Cas9 MEFs significantly reduced p53 binding to Zmat3 but not to Cdkn1a in ChIP experiments (Figure 3G, S3B) and significantly decreased Zmat3 mRNA and protein levels similarly to p53 knockout (Figure 3H, 3I) suggesting that the RE is critical for p53 regulation of Zmat3. Together, these findings demonstrate that ZMAT3 is broadly regulated by p53 in numerous mouse and human cell types and that robust Zmat3 expression relies on direct induction by p53.
Zmat3 suppresses LUAD and HCC development
While the oncogene-expressing MEF discovery platform indicated the importance of Zmat3 in tumor suppression in one context, we sought to interrogate whether Zmat3 might be more broadly relevant as a tumor suppressor using in vivo carcinoma models. p53 plays a key tumor suppressive role in LUAD, with nearly half of human tumors carrying TP53 mutations (Kandoth et al., 2013). Moreover, both our cell culture data (Figure 3A) and in vivo data from mouse tumors (Figure 4A) (Feldser et al., 2010) indicate that Zmat3 is robustly induced by p53 in LUAD. We thus investigated the role of ZMAT3 as a tumor suppressor using CRISPR/Cas9-mediated genome editing in an autochthonous KrasG12D-driven mouse LUAD model (Jackson et al., 2001; Rogers et al., 2017). We induced tumors in KrasLSL-G12D/+;Rosa26LSL-tdTomato/LSL-tdTomato;H11LSL-Cas9/LSL-Cas9 (KT;H11LSL-Cas9) mice with lentiviruses expressing Cre recombinase and an sgRNA targeting p53, 1 of 3 sgRNAs targeting Zmat3, or either of 2 NC sgRNAs (Chiou et al., 2015) (Figure 4B). After transduction of lung epithelial cells, Cre excises the Lox-Stop-Lox cassettes, allowing KrasG12D, Cas9, and tdTomato reporter expression. As anticipated, Cas9-mediated inactivation of p53 led to significantly larger tumors and greater total tumor burden than in NC KT;H11LSL-Cas9 mice (Figure 4C, 4D, 4G). Interestingly, Cas9-induced Zmat3 inactivation also drove significantly larger tumors and increased tumor burden than in control mice (Figure 4E, 4F, 4H, S4A, S4B). The increase in LUAD growth observed with Zmat3 inactivation was less than with p53 inactivation, supporting the idea that Zmat3 is one critical component of the p53 tumor suppression program. Furthermore, we found that like p53, Zmat3 impeded proliferation without inducing apoptosis, suggesting that proliferation inhibition is a mechanism for suppressing LUAD growth (Figure 4I, 4J, S4C). We did not observe a similar increase in tumor size or total tumor burden when tumors were induced in p53-deficient KPT;H11LSL-Cas9 mice, suggesting that Zmat3 is most relevant in the context of an intact p53 pathway (Figure S4D).
Figure 4: Zmat3 suppresses KrasG12D-driven LUAD and HCC.
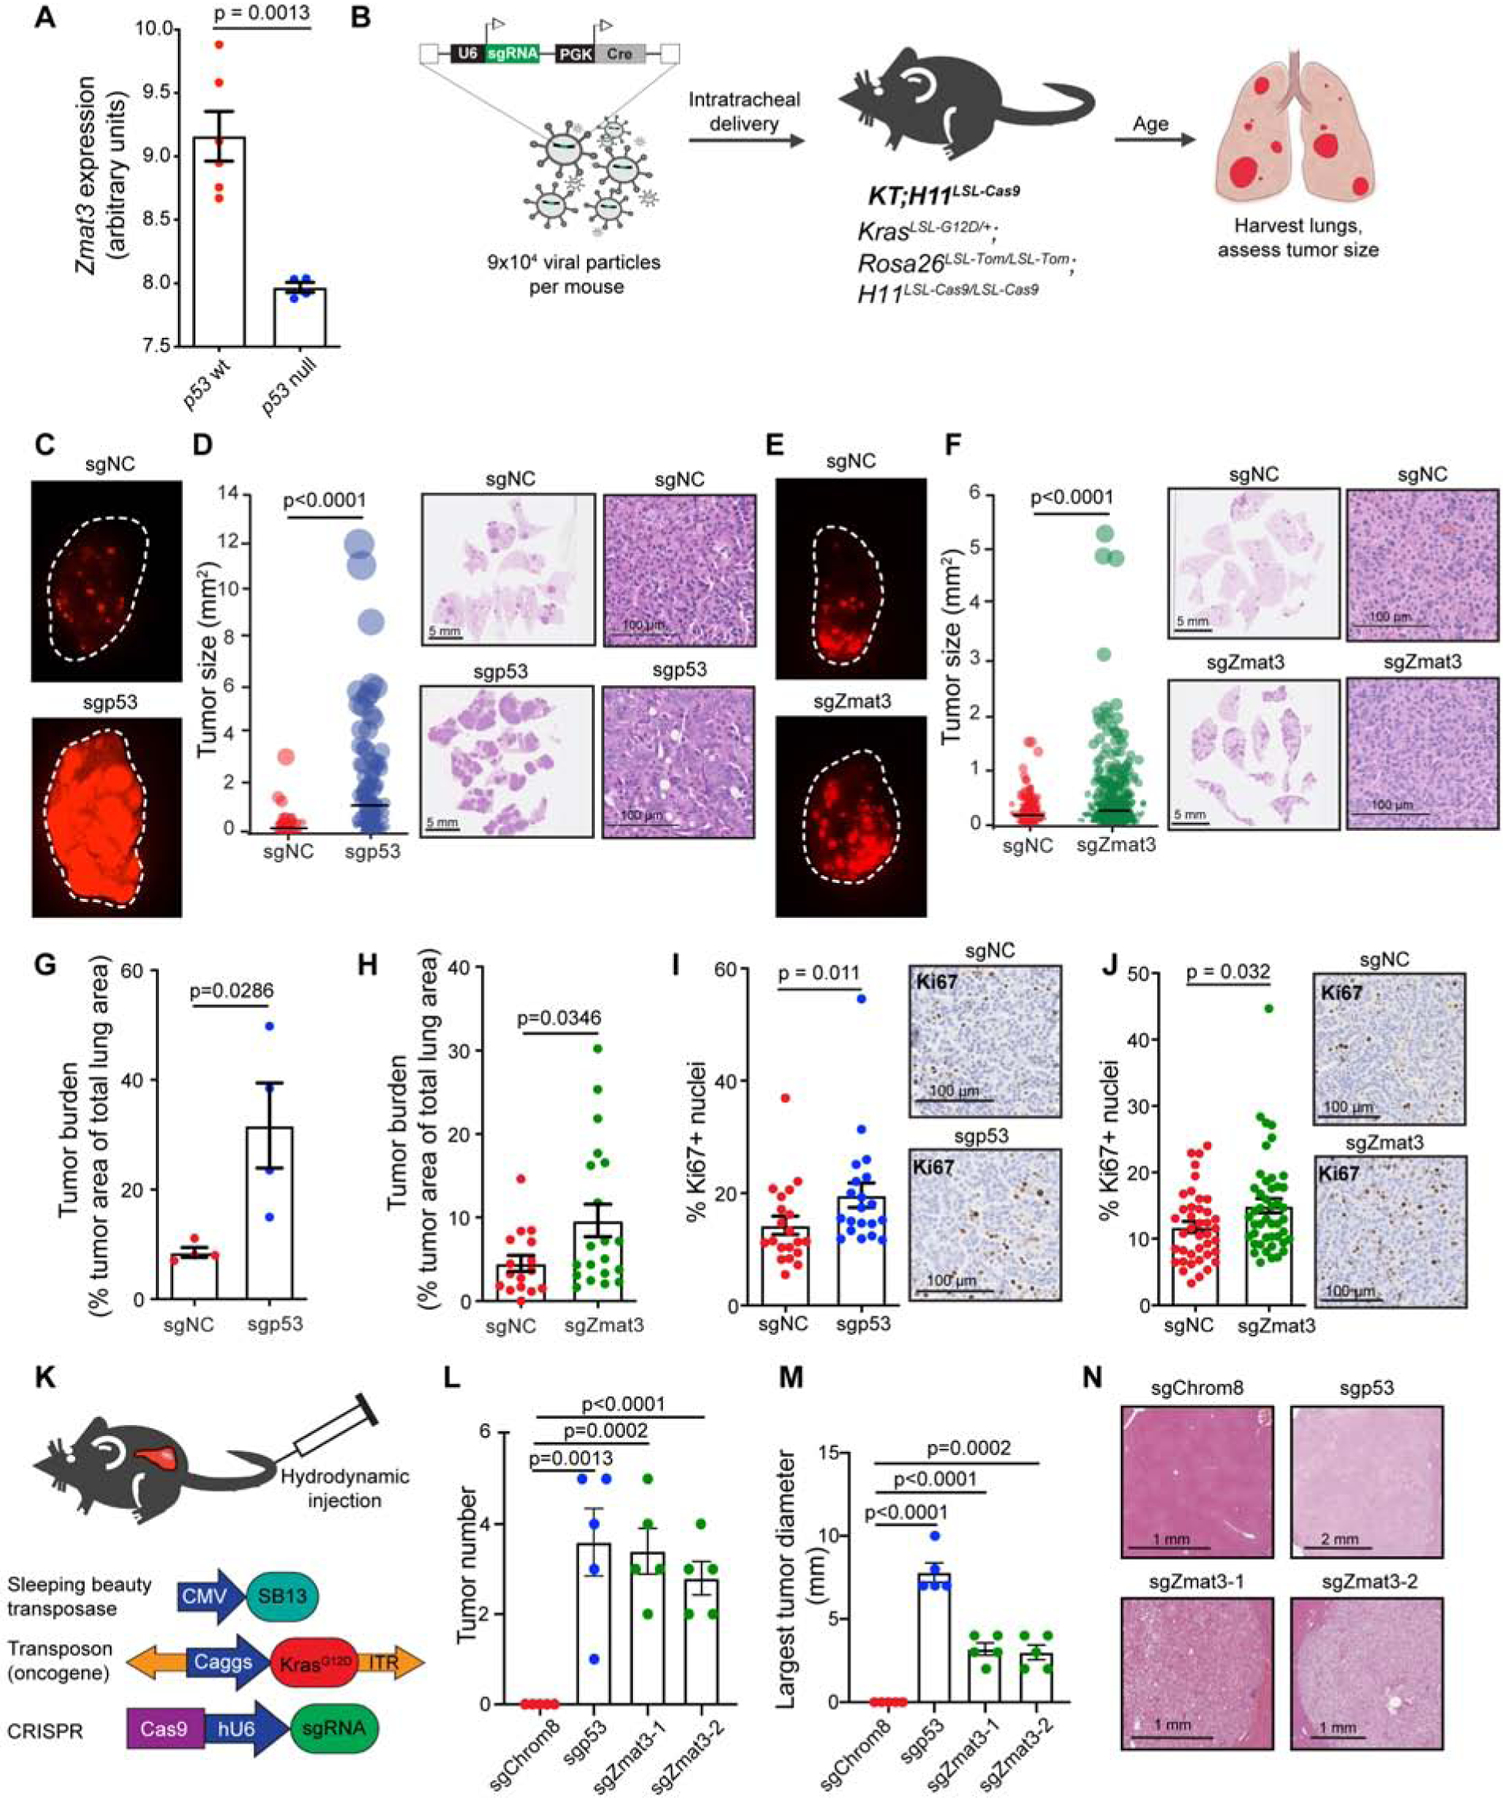
(A) Published microarray analyses of grade 3 KrasLA2/+;Trp53LSL/LSL;Rosa26CreERT2 tumors lacking or expressing p53 (Feldser et al., 2010). (B) Lentiviral vectors expressing Cre recombinase and p53, Zmat3 or NC sgRNAs were used to induce tumors in KT;H11LSL-Cas9 mice. Lungs were harvested after 17–20 weeks. (C) tdTomato expression in Lenti-sgNC/Cre or Lenti-sgp53/Cre mouse lungs. (D) Left, sizes of Lenti-sgp53/Cre and Lenti-sgNC/Cre tumors (n=4 mice/group; n=160 NC and 193 sgp53 tumors). Each dot represents a tumor, with area proportional to the tumor size. The bar is the mean, and p-values, two-tailed unpaired t-test. Right, representative H&E-stained lung sections. (E) tdTomato expression in Lenti-sgNC/Cre or Lenti-sgZmat3/Cre mouse lungs. (F) Left, sizes of Lenti-sgZmat3/Cre and Lenti-sgNC/Cre tumors (n=16–20 mice/group; n=546 negative control and 1059 sgZmat3 tumors). See plot description in (D). Right, representative H&E-stained lung sections. (G) and (H) Total tumor burden (% tumor area/total lung area) for Lenti-sgp53/Cre and Lenti-sgNC/Cre mice [(G) n=4 sgNC mice, 4 sgp53 mice] and Lenti-sgZmat3/Cre and Lenti-sgNC/Cre mice [(H) n=16 sgNC mice, 20 sgZmat3 mice]. Each dot represents a mouse, the bar is the mean. p-values, two-tailed unpaired t-test. (I) and (J) Left, Percentages of Ki67-positive nuclei in Lenti-sgp53/Cre and Lenti-sgNC/Cre tumors (I) and Lenti-sgZmat3/Cre and Lenti-sgNC/Cre tumors (J). Right, Representative IHC for Ki67 in tumors (n=20–45 tumors/group). Each dot represents a tumor and the bar is the mean. p-values, two-tailed unpaired t-test. (K) Hydrodynamic tail vein injection delivered Sleeping Beauty transposase, KrasG12D, Cas9, and NC (Chrom8), p53, or either of 2 different Zmat3 sgRNAs to mouse livers. Livers were harvested after 7–9 weeks (sgp53) or 14 weeks (sgChrom8 and sgZmat3). (L) and (M) Number of tumors per liver (L) and largest tumor diameter (M) in mice injected with sgChrom8, sgp53 or sgZmat3. Each dot is a mouse (n = 5 mice/group), and the bar is the mean +/− SEM. p-values, two-tailed unpaired t-test. (N) H&E of representative liver tumors or normal liver for sgChrom8.
To assess the importance of Zmat3 in suppressing tumorigenesis in an additional autochthonous carcinoma model, we used a mouse hepatocellular carcinoma (HCC) model in which p53 is tumor suppressive (Tschaharganeh et al., 2014). In this model, a recombinant transposon vector expressing KrasG12D, along with vectors expressing Cas9/sgRNAs and Sleeping Beauty transposase are introduced into hepatocytes via hydrodynamic tail vein injection (HTVI). We used the HTVI model to deliver sgRNAs targeting Chromosome 8 (negative control), p53 (positive control), or Zmat3 (Figure 4K). Interestingly, while no tumors developed in the sgChrom8 negative control group (0/5), 5/5 mice in both sgZmat3 cohorts and the sgp53 cohort developed tumors (Figure 4L). Although the penetrance of the tumor phenotype was equivalent in the sgp53 group and both sgZmat3 groups, the tumors in the sgp53 mice were larger than in the sgZmat3 mice, again suggesting that Zmat3 is one component downstream of p53 (Figure 4M–N). Together, these findings illuminate Zmat3 as a p53 target gene critical for carcinoma suppression in vivo.
ZMAT3 is a component of the p53 pathway in human carcinomas
Given the highly conserved regulation of ZMAT3 by p53 in human cells, and the clear tumor suppressor activity of Zmat3 in mice, we next sought to examine the role of ZMAT3 in the p53 tumor suppressor pathway in human cancer. We first queried the association between ZMAT3 expression and patient prognosis in human carcinomas. We analyzed a large cohort of breast cancer patients for whom long-term follow-up data (>15 years) are available and with nearly 2000 tumors for which TP53 status is known (Curtis et al., 2012; Pereira et al., 2016). We found that patients with tumors with relatively low ZMAT3 expression exhibited reduced disease-specific survival relative to those with higher ZMAT3 expression. Importantly, this association was only observed for patients with tumors of wild-type TP53 but not mutant TP53 status (Figure 5A–C). As predicted from our mouse studies, examination of TCGA LUAD and LIHC data revealed a similar survival pattern for patients with high and low ZMAT3 expression specifically in the context of wild-type TP53, although the survival difference in the LUAD data did not reach statistical significance (Figure 5D–F, S5A–S5C). These correlative findings further support a role for ZMAT3 particularly in cancers in which p53 is intact.
Figure 5: ZMAT3 has p53-dependent and -independent activities.
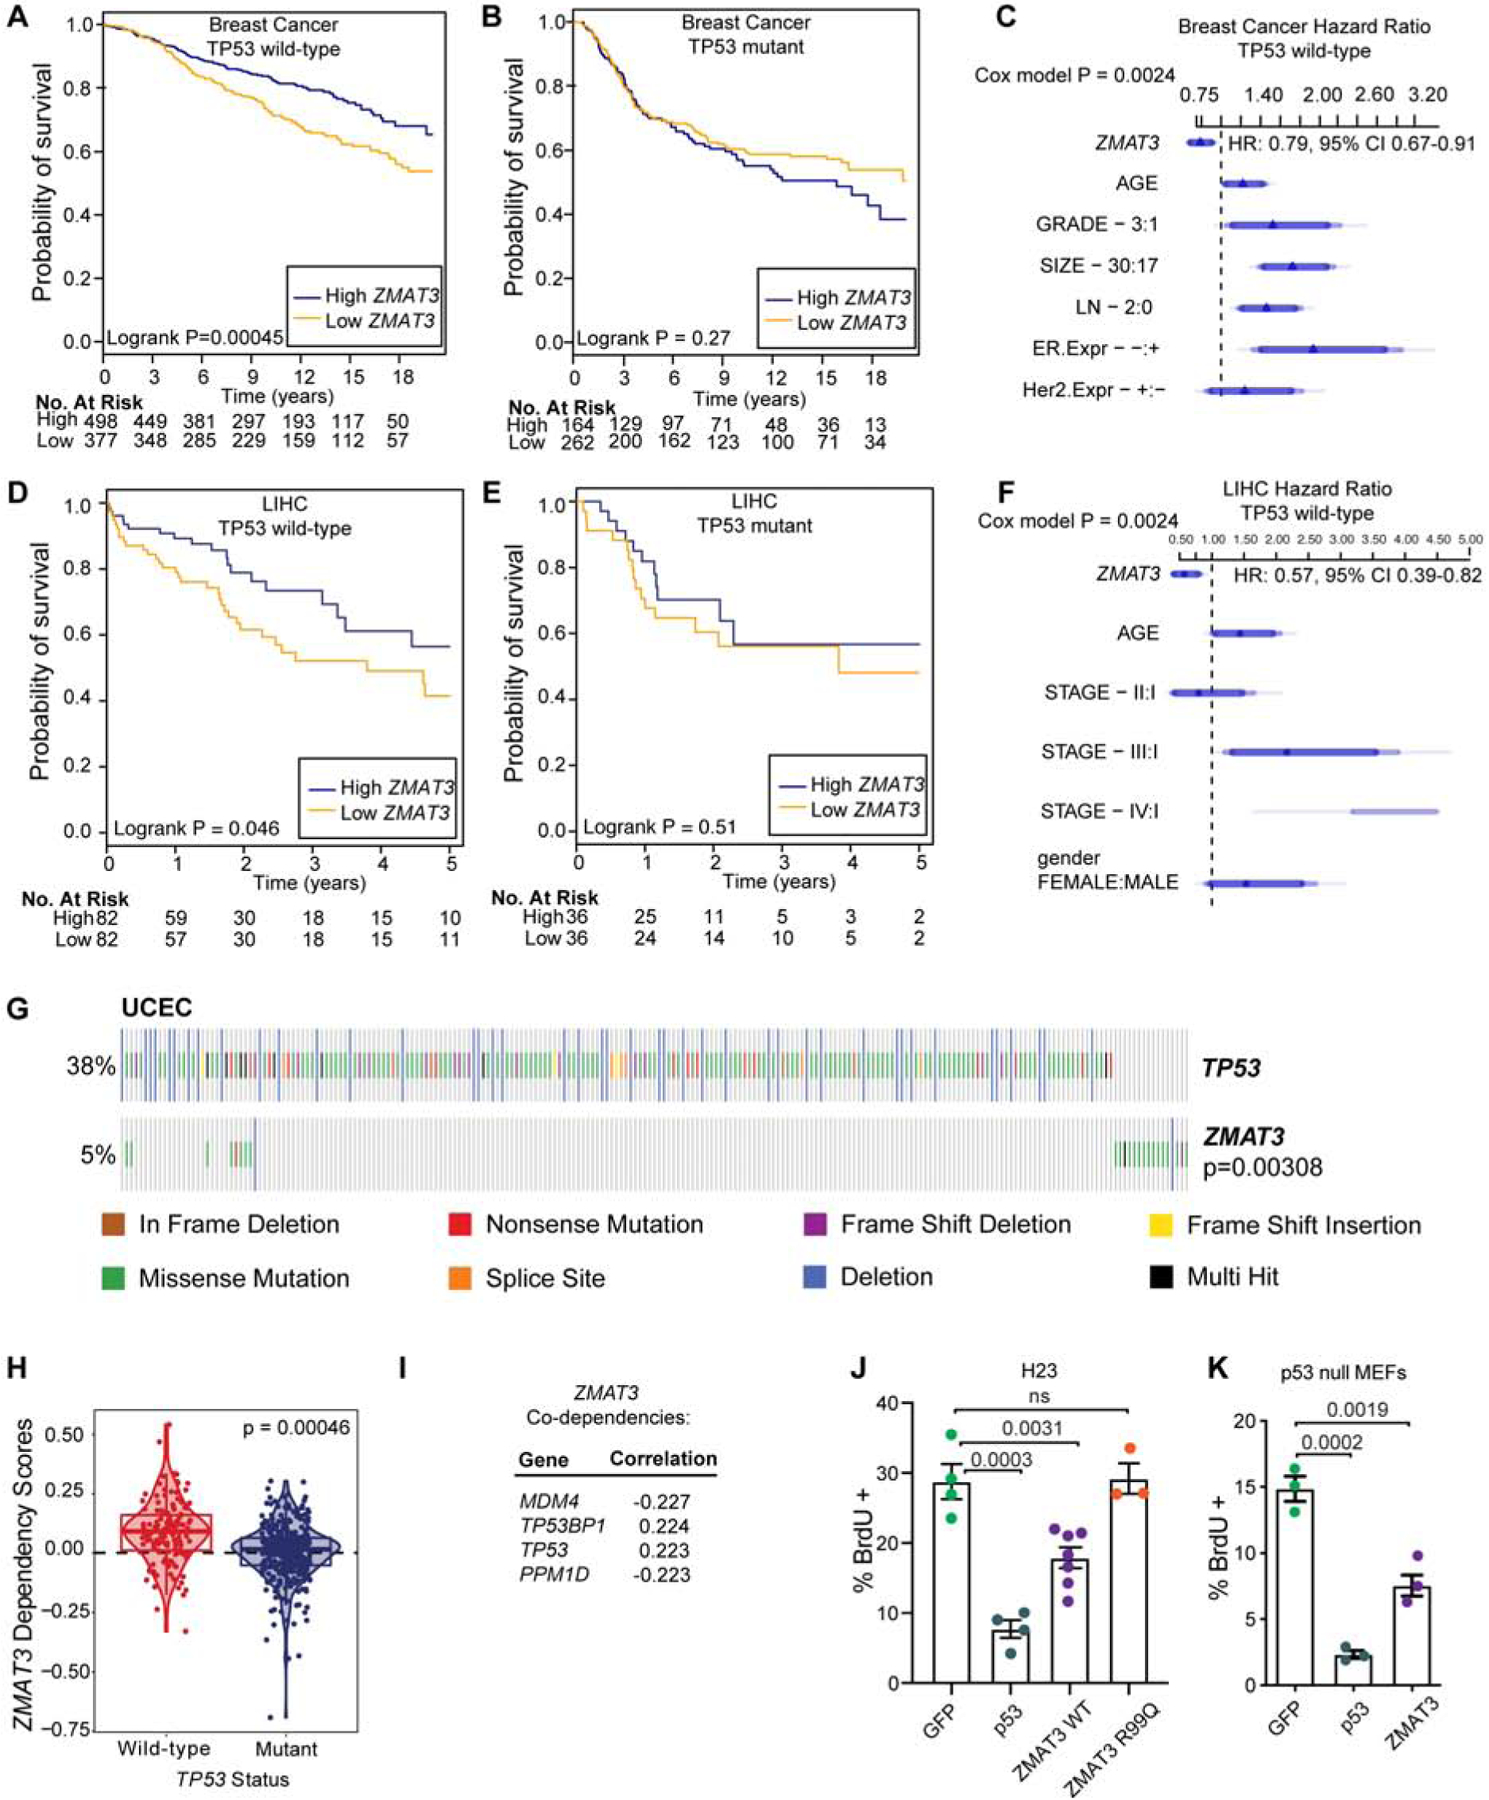
(A) and (B) Probability of disease-specific survival (DSS) in METABRIC breast cancer patients with wild-type TP53 (A) or mutant TP53 (B) and high (first tertile) or low (third tertile) expression of ZMAT3. (C) Cox Proportional Hazard ratio plot for DSS and ZMAT3 expression levels adjusted for age, grade, size, stage, and estrogen receptor (ER) and HER2 status in METABRIC. Cox Proportional Hazard p-value for ZMAT3 expression: p-value: 0.0024, HR: 0.7878, CI 95% 0.67–0.91. (D) and (E) Probability of survival in TCGA LIHC patients with wild-type TP53 (D) or mutant TP53 (E) and high (first tertile) or low (third tertile) expression of ZMAT3. (F) Cox Proportional Hazard ratio plot of the association between survival and ZMAT3 expression levels adjusted for age, stage, and gender in the TCGA LIHC dataset. Cox Proportional Hazard p-value for ZMAT3 expression: p-value: 0.0024, HR: 0.57, CI 95% 0.39–0.82. (G) Mutations in ZMAT3 are mutually exclusive with TP53 mutations in UCEC. p-value, DISCOVER mutual exclusivity test. (H) Project Achilles cell lines were parsed on TP53 status (wild-type or aberrant), and the CERES dependency score for ZMAT3 plotted for each. p-value, Benjamini-Hochberg two-tailed t-test. (I) Top co-dependencies for ZMAT3 in the CRISPR (Avana) Public 19Q4 dataset with Pearson correlations from DepMap. (J) and (K) H23 cells (J) or p53-null MEFs (K) expressing HA-tagged GFP, p53, wild-type ZMAT3 or ZMAT3 R99Q were analyzed for BrdU incorporation by immunofluorescence. Each dot represents a replicate and the bar is the mean. p-values, two-tailed t-test.
To further investigate the role for ZMAT3 in the human p53 tumor suppression program, we leveraged TCGA data to examine patterns of ZMAT3 mutation relative to TP53 mutations. While amplifications of chromosome 3q where ZMAT3 resides are observed in certain human cancers - potentially due to linkage to the PIK3CA oncogene - point mutations in ZMAT3 are also found in some cancers, such as uterine corpus endometrial carcinoma (UCEC)(Cerami et al., 2012; Gao et al., 2013). Interestingly, mutations and deletions in ZMAT3 are mutually exclusive with mutations and deletions in TP53 in UCEC, supporting the notion that ZMAT3 is a component of p53-mediated tumor suppression in humans (Figure 5G).
To examine the functional significance of the TP53-ZMAT3 axis in human cancer, we mined data from Project Achilles, a compilation of genome-scale pooled screens from 485 cell lines (Meyers et al., 2017). We specifically interrogated the functional effect of ZMAT3 knockout by CRISPR/Cas9 in human carcinoma cell lines. We parsed the cell lines based on TP53 status into either wild-type or aberrant and plotted the CERES dependency score (Meyers et al., 2017) for each group. Interestingly, we found a significant positive dependency score for ZMAT3 in cell lines with wild-type p53, suggesting faster growth of the cell lines with ZMAT3 knockout (Figure 5H). In contrast, cell lines with aberrant TP53 were unaffected by ZMAT3 perturbation. Furthermore, the top ZMAT3 co-dependencies not only include TP53 and the p53 positive regulator TP53BP1 (with dependency scores positively correlated with that of ZMAT3), but also p53 negative regulators - MDM4 and PPM1D (with dependency scores negatively correlated with that of ZMAT3; Figure 5I). These functional studies thus further emphasize a growth-suppressive role for ZMAT3 in human cells, particularly when p53 is intact.
ZMAT3 is sufficient to inhibit proliferation
Our findings suggesting that ZMAT3 is particularly important for tumor suppression in the context of intact p53 may be due to a requirement for p53 for efficient Zmat3 expression (Figure 3I), and therefore modulating ZMAT3 in a p53-deficient context where ZMAT3 expression is very low might have little effect. Moreover, ZMAT3 might have a more prominent role in the setting of an active p53 pathway based on its cooperation with other p53 target genes. Alternatively, ZMAT3 might act to reinforce p53 function, rendering ZMAT3 ineffective in a p53 null context. To distinguish these possibilities, we asked whether overexpression of ZMAT3 is sufficient to inhibit proliferation in the absence of p53. We overexpressed HA-tagged ZMAT3, p53 or GFP as a negative control in KrasG12C-expressing, p53-deficient H23 human LUAD cells and in p53-null untransformed MEFs and assessed proliferation by measuring BrdU incorporation. In both cell types, ZMAT3 overexpression inhibited proliferation, consistent with it acting downstream of p53 (Figure 5J, 5K, S5D). Importantly, one recurrent ZMAT3 mutation found in human cancers, R99Q, rendered ZMAT3 unable to inhibit proliferation, supporting the notion that ZMAT3 is functionally inactivated by point mutations found in human cancers (Figure 5J, S5D). Notably, the arrest caused by ZMAT3 overexpression is not as potent as that seen with p53 overexpression, suggesting that other factors also contribute to p53-mediated cell cycle arrest. These data demonstrate not only that ZMAT3 functions downstream of p53, but also that p53 is dispensable for ZMAT3 to inhibit proliferation.
Zmat3 is an alternative splicing regulator
Given the importance of ZMAT3 as a tumor suppressor, we next explored its mechanism of action. ZMAT3 contains 3 zinc fingers, the first 2 of which mediate RNA binding (Israeli et al., 1997; Mendez-Vidal et al., 2002). To identify RNAs directly bound by ZMAT3, we performed enhanced crosslinking and immunoprecipitation (eCLIP) with ZMAT3 antibodies followed by high-throughput sequencing (Van Nostrand et al., 2016). We identified hundreds of ZMAT3-binding peaks (Figure 6A, S6A, Table S4), and analysis of bound RNAs by functional annotation revealed several enriched gene ontology (GO) terms, including RNA binding and mRNA splicing (Figure 6B). To integrate ZMAT3 binding with effects on gene expression, we performed RNA-sequencing (RNA-seq) on E1A;HrasG12V;Cas9 MEFs expressing Zmat3 or NC sgRNAs (Figure S6B). Comparison of the gene expression profiles of sgNC and sgZmat3-expressing cells revealed 847 significantly differentially-expressed genes (Figure 6C, Table S5). GO term annotation again uncovered various categories related to RNA biology, such as RNA binding, ncRNA processing, and mRNA splicing, suggesting a fundamental role for ZMAT3 in RNA regulation (Figure 6D). Overlapping ZMAT3-bound and regulated transcripts revealed 95 transcripts, again associated with RNA-related processes, including RNA binding and mRNA splicing (Figure 6E). Together, these findings suggest a broad role for ZMAT3 in RNA homeostasis.
Figure 6: ZMAT3 is uniquely positioned near the 3’ splice site and drives alternative splicing.
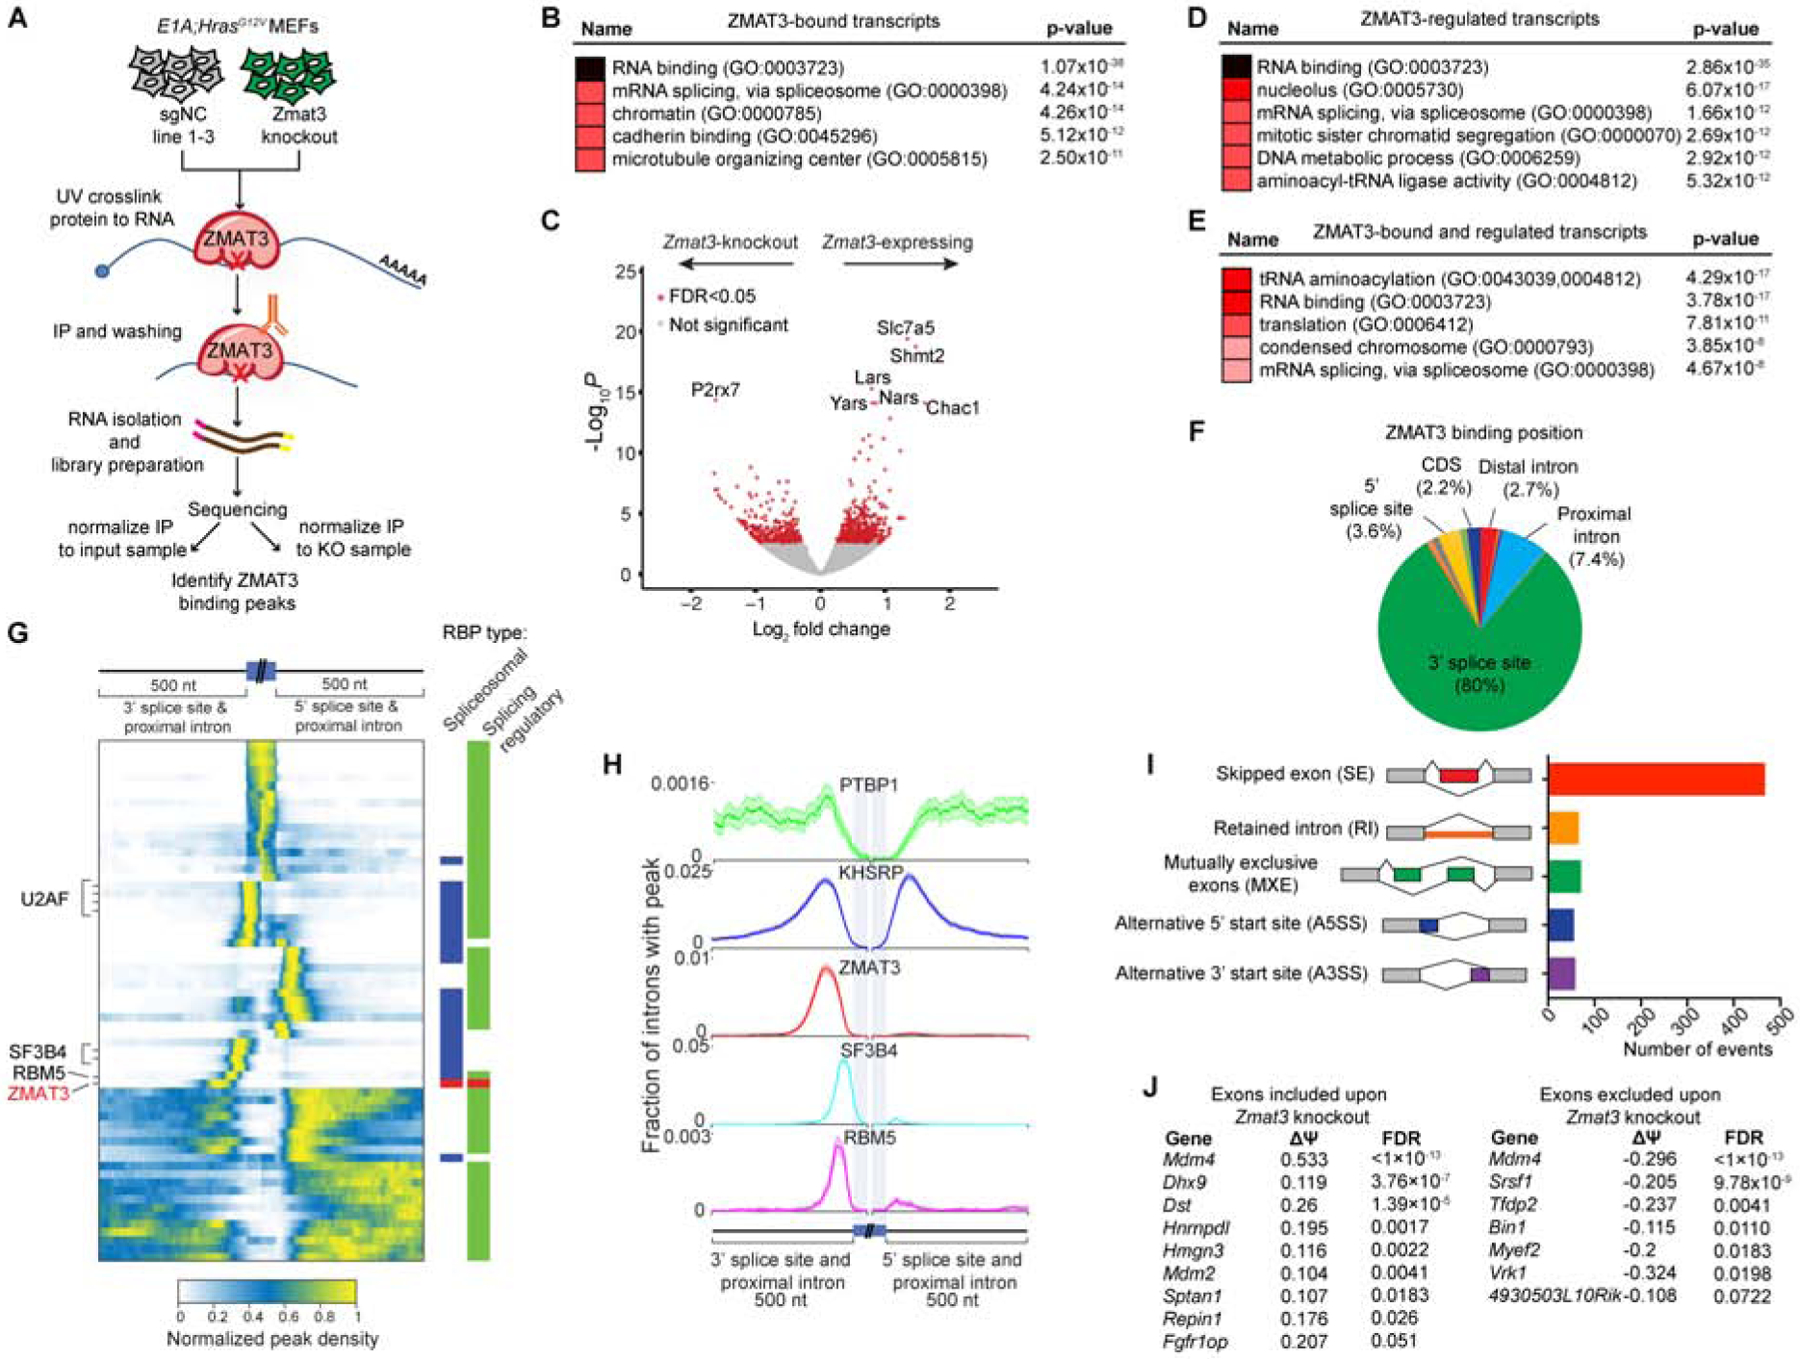
(A) Schematic for eCLIP experiment. (B) Enrichr analysis of top GO terms for the 825 unique transcripts with eCLIP ZMAT3 binding peaks by both input and knockout normalization. (C) Volcano plot of 847 differentially expressed genes identified by RNA-seq in E1A;HRasG12V MEFs expressing Zmat3 or NC sgRNAs, adjusted p-value < 0.05 (red dots). (D) and (E) Enrichr analysis of top GO terms for the 847 genes identified by RNA-seq (D), or the 95 genes on both the RNA-seq and eCLIP gene lists (E). (F) Percentage of eCLIP peaks positioned at the indicated locations of the bound RNA in sgNC sample 2. (G) Peak density heat map for ZMAT3 and other spliceosomal components and splicing regulators profiled by CLIP for ENCODE across a meta-mRNA splice junction. Profiles for specific RBPs are marked. Multiple rows for U2AF1 are different cell lines. Right bars mark spliceosomal RBPs (blue), splicing regulatory RBPs (green) and ZMAT3 (red). (H) Fraction of introns with a ZMAT3 or other RBP peak across a meta-mRNA splice junction. Shaded regions indicate 5th to 95th percentile from 100 random samplings with replacement. (I) rMATS analysis of RNA-seq data from E1A;HRasG12V MEFs expressing sgZmat3 or sgNC identifies 719 differential alternative splicing events. (J) ZMAT3-dependent alternative splicing events in ZMAT3-bound transcripts.
eCLIP data can provide key mechanistic insight into RBP function by revealing positional specificity of RBP binding. Analysis of ZMAT3 binding indicated a remarkable stereotypical positioning, centered 95 nt upstream of 3’ splice sites and 30–50 nt upstream of the branch point in the majority of bound transcripts (Figure 6F, 6G, 6H). Strikingly, this profile of ZMAT3 peaks is distinct from 150 RBPs profiled by the ENCODE consortium (Figure 6G, S6C). For example, maximal ZMAT3 peak density was detected upstream of annotated spliceosomal components, including the 3’ splice site factor U2AF2, which binds at the polypyrimidine tract, and branch point factors SF3B4 and RBM5 (Figure 6G, 6H). Moreover, alternative splicing regulatory RBPs PTBP1 and KHSRP, which also bound 100 nt upstream of the 3’ splice site, had far broader peak distributions and significant enrichment in 5’ splice site regions (Figure 6H). HOMER motif analysis revealed that a subset of the ZMAT3 peaks contain a CAG adjacent to a polypyrimidine tract, reminiscent of the 3’ splice site consensus sequence (Figure S6D).
The ZMAT3 binding position, along with the enrichment of genes involved in mRNA splicing in the ZMAT3-bound and regulated transcripts (Figure 6B, 6D, 6E) suggested that ZMAT3 might regulate splicing. Using rMATS analysis (Park et al., 2013) to compare splice variants in our RNA-seq data from ZMAT3-deficient and control MEFs, we identified 719 ZMAT3-dependent alternative splicing events. The majority of the alternative splicing events were skipped exon (SE) events, but we also found other types of alternative splicing events (Figure 6I, Table S6). Through this analysis, we identified alternative splicing events adjacent to ZMAT3-bound introns, including in transcripts encoding proteins involved in splicing (Hnrnpdl, Dhx9), p53 regulation (Mdm4 and Mdm2), and varied additional cellular functions (Dst, Sptan1, Bin1) (Kemmerer et al., 2018; Kunzli et al., 2016; Lee and Pelletier, 2016; Marine et al., 2006; Sakamuro et al., 1996; Wang et al., 2018) (Figure 6J). Interestingly, splicing map analysis did not reveal a consistent pattern of ZMAT3 binding across all ZMAT3-regulated differentially spliced exons (Figure S6E), and numerous alternatively spliced RNAs did not show ZMAT3 binding (e.g. Cask, Tia1), suggesting that ZMAT3 not only exerts direct effects on splicing, but also indirect downstream effects.
ZMAT3 regulates splicing of transcripts involved in diverse cellular processes
Of the significant ZMAT3-bound and alternatively spliced transcripts we identified, the p53 negative regulator Mdm4 is most prominent (Figure 6J). Interestingly, our data show that Zmat3 knockout cells are enriched for the full-length isoform of Mdm4 (Mdm4-FL), encoding the form that negatively regulates p53 by either directly blocking p53 transactivation or cooperating with the ubiquitin ligase MDM2 to promote p53 degradation (Marine et al., 2006; Toledo and Wahl, 2006) (Figure 7A–C). In contrast, the ZMAT3-expressing cells also express a short isoform of Mdm4 (Mdm4-S) in which exon 6 is skipped - an event known to introduce a premature termination codon and trigger nonsense-mediated mRNA decay (NMD) (Bardot et al., 2015) (Figure 7A–C). Therefore, the Mdm4-S transcript does not lead to stable MDM4 protein expression, and indeed, we observe less MDM4 protein in ZMAT3-expressing cells than in ZMAT3-deficient cells (Figure 7D). Notably, we also observe a decrease in Mdm4-S levels in p53-deficient cells, and in cells in which the p53 RE in Zmat3 is disrupted, suggesting that p53 activation of Zmat3 is required for the Mdm4 alternative splicing event (Figure 7D). Exclusion of exon 3 of Mdm2 - which is necessary for efficient binding to p53 – is also significantly greater in the presence of Zmat3 (Figure 7A–B) (Giglio et al., 2010; Perry et al., 2000). Although p53 protein accumulation is not clearly decreased by Zmat3 deficiency, expression of some p53 target genes, including Gtse1 and Eif4g3, is diminished (Figure 3I, S6B, S7A). Thus, these data suggest that one component of Zmat3 tumor suppressor function is to promote full p53 activity, but it does not fully account for Zmat3 function, as ZMAT3 clearly can impede proliferation in the absence of p53 (Figure 5J, 5K).
Figure 7: Multifaceted regulation of RNA splicing and stability by ZMAT3.
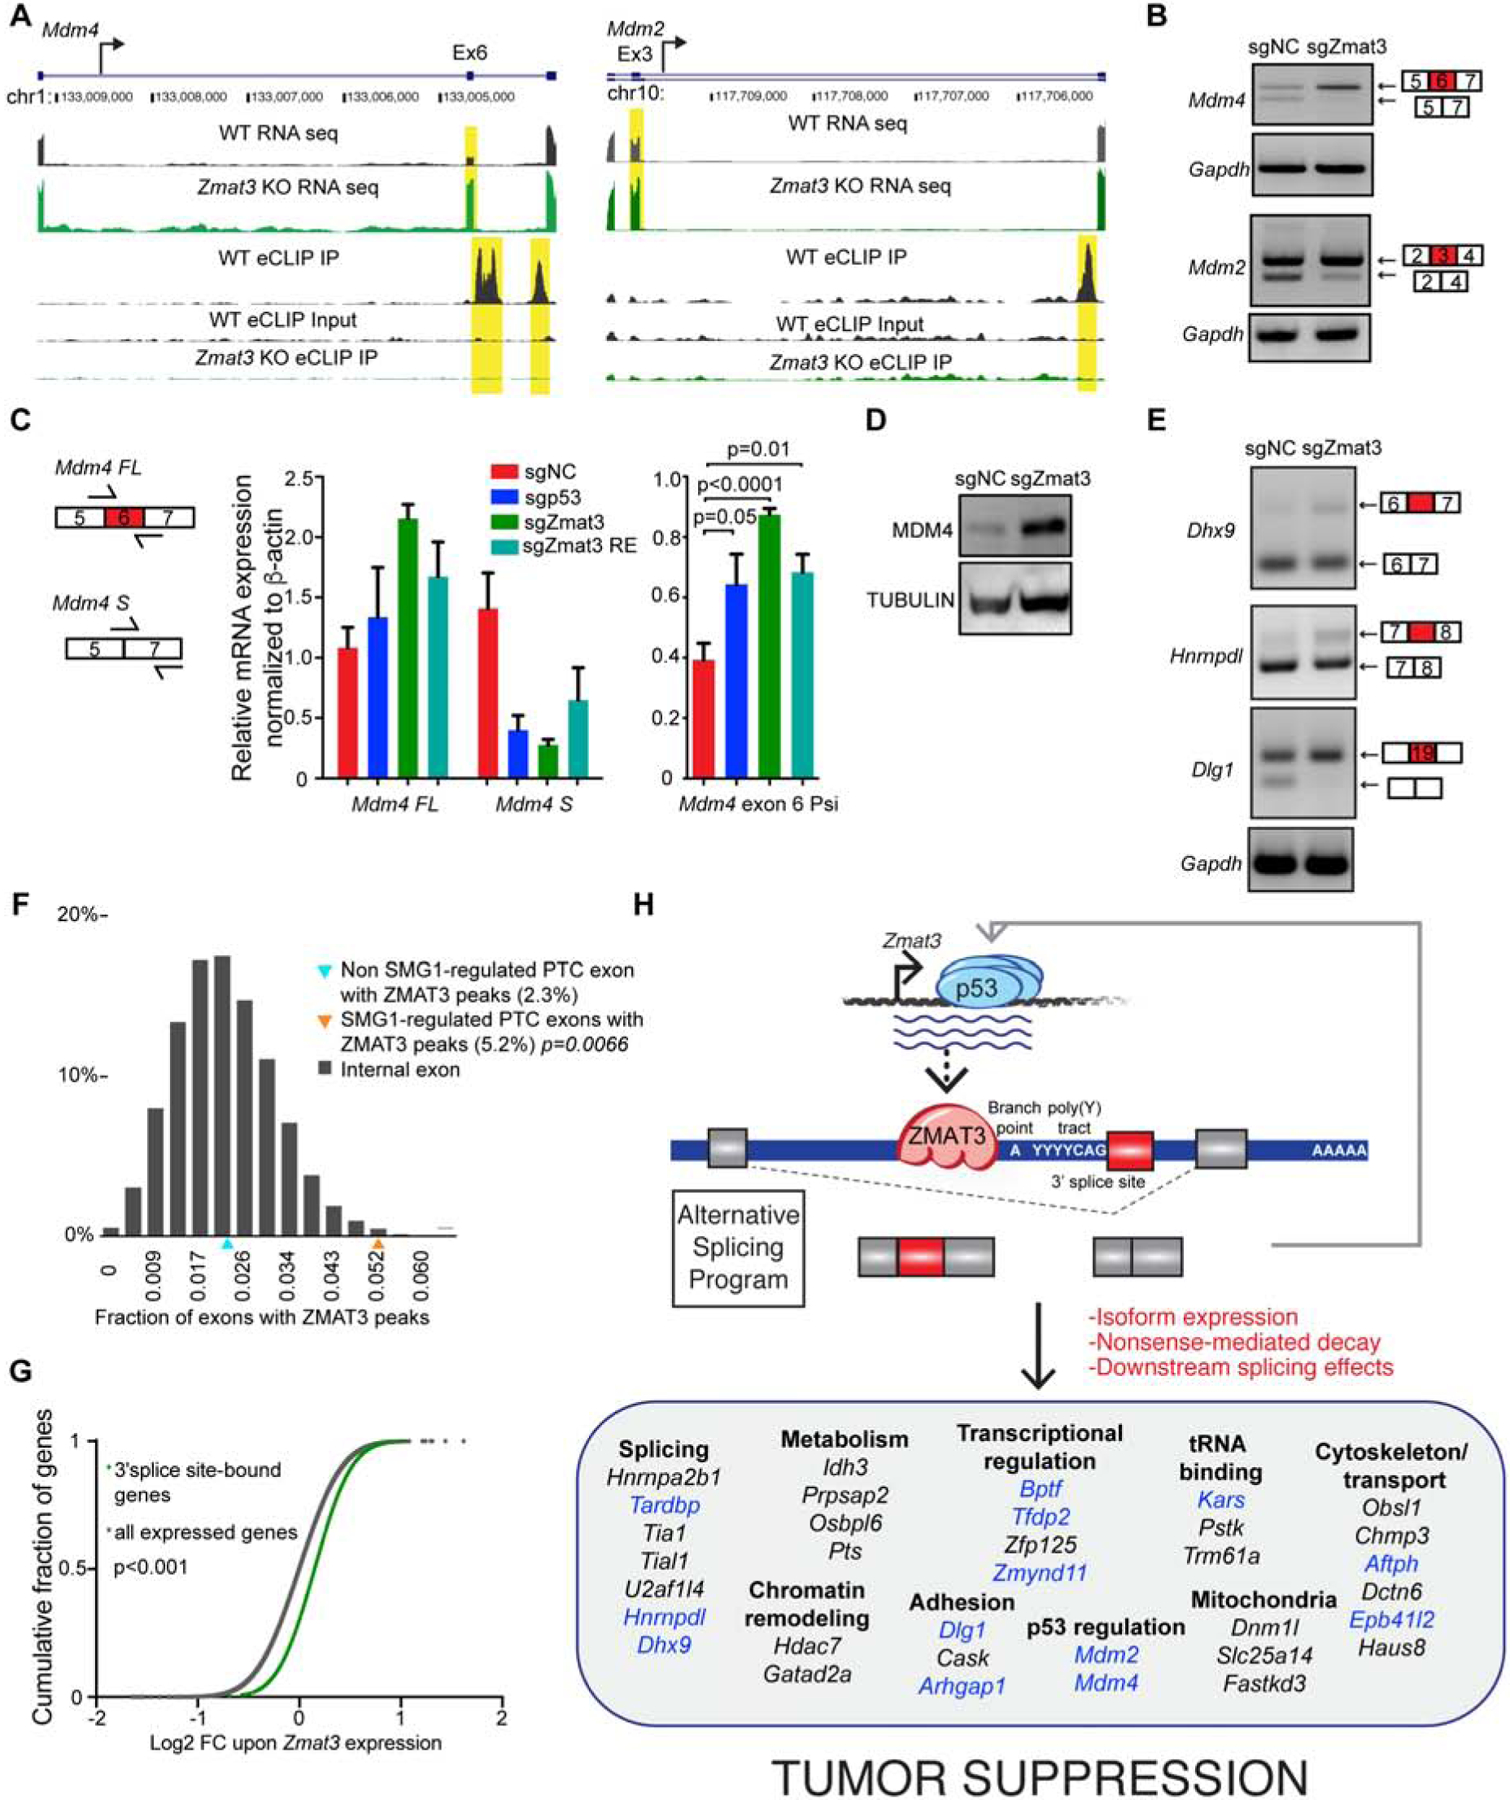
(A) Alternatively spliced exons (yellow) from the RNA-seq data (upper tracks) and ZMAT3-binding peaks (yellow) from the eCLIP data (lower tracks) in Mdm4 and Mdm2. (B) Semi-quantitative PCR analysis of the alternative splicing depicted in (A), with Gapdh control. Primers were designed to flank the alternatively spliced exon. (C) qRT-PCR analysis of Mdm4 exon 6 alternative splicing (mean +/− s.d.) in E1A;HrasG12V;Cas9 MEFs transduced with sgRNAs targeting Zmat3, p53, the Zmat3 p53 RE, or NC sgRNAs, relative to β-actin. p-value, 2-tailed unpaired t-test of different MEF lines (n=3–8). (D) Western blot analysis of MDM4 in E1A;HrasG12V;Cas9 MEFs expressing sgZmat3 or sgNC with α-TUBULIN loading control. (E) Semi-quantitative PCR analysis of alternative splicing in Dhx9, Hnrnpdl, and Dlg1 with Gapdh control. Primers were designed to flank the alternatively spliced exons. (F) Frequency of ZMAT3 binding peaks flanking SMG1-dependent exons (orange triangle), non SMG1-dependent exons (blue triangle), or random exons (gray bars). Significance based on comparison to random exons. (G) Cumulative fraction of changes in the log2 fold change for transcripts bound by ZMAT3 near a 3’ splice site (green line) or all expressed genes (gray line) in the RNA-seq data. p<0.001, Kolmogorov-Smirnov test. (H) Model for ZMAT3 action in tumor suppression. Transcripts in blue are ZMAT3-bound in eCLIP data, those in black are not bound, based on statistics.
Various other transcripts are bound and alternatively spliced by ZMAT3 (Figure 6J), including splicing regulators, such as Hnrnpdl - an hnRNP family member involved in alternative splicing (Kemmerer et al., 2018) - and Dhx9 - an RNA helicase that interacts with other splicing factors in pre-spliceosomes (Lee and Pelletier, 2016). Both transcripts are bound by ZMAT3 upstream of a 3’ splice site adjacent to alternatively spliced exons that are preferentially excluded in ZMAT3-expressing cells (Figure S7B–C, S7E, 7E). The excluded exon in Hnrnpdl can trigger NMD and transcript destabilization (Kemmerer et al., 2018), consistent with accumulation of this transcript in the presence of ZMAT3. Dhx9 transcript levels are also increased in ZMAT3-expressing cells (Figure S7B, Table S5), further suggesting that differential splicing could affect transcript stability. By binding transcripts encoding splicing regulators, ZMAT3 may indirectly regulate additional splicing events. ZMAT3 binding also affects splicing of RNAs encoding proteins with roles in various cellular processes, including adhesion, cytoskeletal function and polarity (Dst, Sptan, Dlg1; Figure 7E, S7C, S7D). Collectively, our findings show that ZMAT3 drives alternative splicing of transcripts involved in functionally distinct processes.
ZMAT3 binds Nonsense-Mediated Decay target transcripts
Alternative splicing has been reported to trigger NMD in ~30% of alternatively spliced transcripts (Lewis et al., 2003), prompting us to examine whether ZMAT3 preferentially regulates alternative splicing of known NMD targets. We compared the ZMAT3-bound transcripts with alternatively spliced transcripts from RNA-seq analysis of MEFs deficient in SMG1, a kinase that phosphorylates UPF1, a key regulator of NMD (McIlwain et al., 2010). Indeed, ZMAT3 preferentially binds introns flanking SMG1-regulated premature termination codon (PTC)-containing exons relative to non-SMG1 regulated PTC exons or random exons (Figure 7F, see methods). Thus at least a subset of ZMAT3 binding occurs on established splicing-regulated NMD targets, supporting the notion that ZMAT3 affects RNA stability through its ability to regulate alternative splicing. Interestingly, analysis of our RNA-seq data revealed significantly higher levels of ZMAT3-bound transcripts than all expressed transcripts with ZMAT3 expression, suggesting that ZMAT3 binding generally stabilizes mRNAs (Figure 7G).
Collectively, our findings support a model in which ZMAT3 binds transcripts upstream of 3’ splice sites, regulates splicing to affect both isoform expression and NMD, and broadly influences gene expression programs. In addition, ZMAT3 action triggers indirect, downstream splicing events. Importantly, given the range of transcripts either differentially expressed or alternatively spliced in the presence of ZMAT3, our findings suggest that the tumor suppressive effect of ZMAT3 is not likely to be explained by a particular bound or alternatively spliced target, but rather through a more complex impact impinging upon diverse cellular pathways (Figure 7H). These findings are in line with previous studies demonstrating that the oncogenic effects of mutations in splicing factors such as SF3B3 and SRSF2 are attributable to subtle splicing changes in a range of transcripts, rather than dramatic changes in splicing of a single transcript (Wang et al., 2016; Zhang et al., 2015).
Discussion
Here, we use a multidisciplinary approach to illuminate p53 transcriptional programs critical for p53 tumor suppressor function. By coupling unbiased ultracomplex RNA interference and CRISPR/Cas9 pooled screens in vivo, CRISPR/Cas9-mediated genome editing in autochthonous mouse cancer models, human cancer genome analysis, and integrative eCLIP-seq and RNA-seq analyses, we reveal an important branch of p53 tumor suppression involving an RNA splicing program. While recent studies have underscored the importance of dysregulated splicing for cancer development (Obeng et al., 2019; Zhang and Manley, 2013) and suggested a role for mutant p53 in regulating splicing in pancreas cancer (Escobar-Hoyos et al., 2020), a clear link to wild-type p53 has not been established. We show further that ZMAT3 is most active in the context of an intact p53 pathway, and that ZMAT3 controls p53 regulators, suggesting that feedback to p53 may account for some ZMAT3 tumor suppressor activity. However, ZMAT3 expression is sufficient to inhibit proliferation in p53-deficient cells, indicating that ZMAT3 can also employ p53-independent tumor suppressive mechanisms. Interestingly, a recent shRNA screen revealed that Zmat3 knockdown in hematopoietic stem cells deficient for the p53 target genes Puma and p21 promotes leukemia development (Janic et al., 2018). Together with our data revealing a tumor suppressor role for Zmat3 in E1A;HrasG12V MEFs, lung adenocarcinoma, and hepatocellular carcinoma, these observations support the idea that ZMAT3 represents a core component of p53 tumor suppression across various contexts.
Although ZMAT3 has been known as a p53 target gene for some time (Israeli et al., 1997; Varmeh-Ziaie et al., 1997), its physiological function and role in tumor suppression are not well understood. Previous studies have suggested that ZMAT3 is a double-stranded RBP that binds 3’ UTRs of various mRNAs to modulate RNA levels (Bersani et al., 2016; Bersani et al., 2014; Vilborg et al., 2009). Here, we used the highly sensitive eCLIP technique (Van Nostrand et al., 2016), coupled with RNA-seq, to understand ZMAT3 function. We identified hundreds of novel ZMAT3-bound transcripts, but only ~1% of ZMAT3 binding events were at the 3’ UTR. Instead, we observed dramatic enrichment of ZMAT3 binding upstream of the 3’ splice site of specific introns in the majority of transcripts, strongly suggesting that ZMAT3 functions to regulate splicing. Indeed, we observed ZMAT3-dependent regulation of alternative splicing of numerous transcripts. Notably, Zmat3 knockout affects splicing of select transcripts, suggesting that ZMAT3 is a regulator of alternative splicing rather than being a core splicing component. Intriguingly, we noted multiple instances of known ‘poison exons’ - regulated alternatively spliced exons containing stop codons that trigger NMD (Kurosaki et al., 2019). Depending on whether these exons are included or excluded, transcripts may be stabilized or destabilized by ZMAT3. Thus, there may be additional ZMAT3-regulated alternative splicing events that we failed to detect in our RNA-seq due to degradation of the alternative isoform.
Inclusion of cryptic exons - nonannotated exons defined by sequences similar to consensus motifs of canonical splice sites - occurs in human disease and can also trigger NMD (Sibley et al., 2016; Ule and Blencowe, 2019). Recent studies have suggested that suppression of cryptic splice site recognition is a key function of some RBPs, such as the ZMAT3-related protein MATRIN 3, which binds and blocks the use of cryptic splice sites in antisense LINE elements (Attig et al., 2018). As with MATRIN3, ZMAT3 knockdown causes a small but significant decrease in ZMAT3-bound transcript levels. Although we do not yet know the mechanism by which ZMAT3 recognizes its specific targets, motif enrichment analysis revealed ZMAT3 binding to sequences resembling the consensus 3’ splice site (CAG + polypyrimidine tract). Thus, ZMAT3 may maintain proper expression of its targets by suppressing the use of specific cryptic alternative 3’ splice sites.
The direct modulation of alternative splicing by ZMAT3 promotes alterations in the expression of genes involved in p53 regulation, various cellular processes, and splicing itself. Notably, we do not observe splicing changes in the Trp53 transcript (Figure S7F). The most dramatic effect is on the p53 inhibitor MDM4, for which different spliced isoforms have been described, including those expressing and lacking exon 6 (Bardot et al., 2015; Boutz et al., 2015). Critical evidence for the functional roles of the isoforms has come in part from mice expressing an Mdm4 allele lacking exon 6, which display embryonic lethality provoked by diminished Mdm4 expression and inappropriate p53 activation (Bardot et al., 2015). Moreover, inhibition of exon 6 inclusion using antisense oligonucleotides impairs melanoma growth in vivo (Dewaele et al., 2016). Thus, the main function of the alternative splicing event in Mdm4 that drives exon 6 skipping is to reduce the amount of full length Mdm4 produced and promote active p53. While specific regulators of splicing, such as SRSF proteins and PRMT5, have been genetically defined as modulators of Mdm4 exon 6 skipping (Dewaele et al., 2016; Fong et al., 2019), we propose that ZMAT3 binding to RNA directly dictates the occurrence of this event, as a means to maintain p53 activity.
Beyond driving this specific alternative splicing event, ZMAT3 likely impedes tumor development through combined effects on the various transcripts that it binds and directly regulates. Interestingly, ZMAT3 regulates splicing of transcripts encoding proteins involved in diverse cellular processes. For example, DST is a hemidesmosome component involved in epithelial cell-basement membrane adhesion (Kunzli et al., 2016), DLG1 is a cell polarity/signaling protein originally identified from a Drosophila larva overgrowth phenotype (Milgrom-Hoffman and Humbert, 2018), and SPTAN1 is a cytoskeletal scaffold protein (Ackermann and Brieger, 2019). Therefore, ZMAT3 regulation of such transcripts, by modulating isoform expression or levels, may influence tumorigenesis. In addition, our finding that some ZMAT3-bound and differentially spliced genes are themselves splicing regulators suggests that ZMAT3 also indirectly impinges on the alternative splicing of a broad network of transcripts. Indeed, rMATs analysis reveals hundreds of transcripts not clearly bound by ZMAT3 but nonetheless alternatively spliced in a ZMAT3-dependent fashion. Interestingly, these RNAs are involved in a wide range of cellular processes, suggesting how ZMAT3 could contribute to tumor suppression in a pleiotropic fashion.
Beyond Zmat3, our screening platform identified other tumor suppressor genes. Dennd2c is a DENN domain family member, which act as Rab-GEFs and regulate intracellular trafficking (Yoshimura et al., 2010). While not well studied, DENND2C may regulate autophagy, a process modulated by p53 and sometimes involved in tumor suppression (Jung et al., 2017; Kenzelmann Broz et al., 2013). The identification of Ptpn14, which we have shown suppresses both YAP and pancreatic cancer (Mello et al., 2017), as well as Trp53inp1, Ldhb, and Gss, which all encode metabolic regulators, highlight additional pathways that likely contribute to p53-mediated tumor suppression. The identification of such novel functional tumor suppressor genes is critical for helping to deconvolute human cancer genome sequencing data by unveiling genes with tumor suppressor activity and is a first step toward delineating the cooperating p53 programs involved in suppressing cancer. Ultimately, deconstructing the pathways through which p53 acts may lead to new opportunities for therapeutic intervention in cancer.
STAR Methods
RESOURCE AVAILABILITY
Lead Contact
Further information and requests for resources and reagents should be directed to the Lead Contact, Laura D. Attardi (attardi@stanford.edu).
Materials Availability
Plasmids generated by this study are available upon request.
Data and Code Availability
The microarray data were published previously (Brady et al., 2011) and are available in the Gene Expression Omnibus (GSE27901). The mouse and human ChIP-seq data were also published previously (Kenzelmann Broz et al., 2013; Younger et al., 2015) and are available in the Gene Expression Omnibus (GSE46240, GSE55727). The human cancer data that support the findings of this study are available from the Genomic Data Commons, https://gdc.cancer.gov, and the European Genome-Phenome Archive, https://ega-archive.org/dacs/EGAC00001000484. The Achilles DepMap dataset (CCLE_Depmap_18q3 release) is available from the DepMap portal, https://depmap.org/portal/download/. The Zmat3 RNA-seq (GSE145430) and eCLIP data (GSE14555) have been submitted to the Gene Expression Omnibus and will be made publicly available upon publication of the manuscript. Scripts for version 1.0 of casTLE (Morgens et al., 2016) are available at https://bitbucket.org/dmorgens/castle.
EXPERIMENTAL MODEL AND SUBJECT DETAILS
Subcutaneous tumor model
All animal experiments were in accordance with the Stanford University APLAC (Administrative Panel on Laboratory Animal Care). Cells were suspended in PBS at 3 million cells per 100 μl (library experiments) or 1 million cells per 100 μl (in vivo competition experiments). For the library experiments, cells were mixed 1:1 in Matrigel® (Corning). 100 μl (in vivo competition experiments) or 200 μl (library experiments) of cell suspension were injected under the skin on the right and left flanks of 6-week-old male ICR/Scid mice (Taconic). Tumors were harvested after three weeks of growth. For library experiments, frozen tumors were ground in liquid nitrogen, followed by genomic DNA preparation (Gentra Puregene). ICR/Scid mice were group-housed (up to 5 mice per cage), and irradiated chow and water were provided ad libitum.
Mouse lung adenocarcinoma study
All animal experiments were in accordance with the Stanford University APLAC (Administrative Panel on Laboratory Animal Care). Mice were group-housed (up to 5 mice per cage), and food and water were provided ad libitum. KrasLSL-G12D/+; Rosa26LSL-tdTomato/LSL-tdTomato;H11LSL-Cas9/LSL-Cas9 (KT;H11LSL-Cas9) and KrasLSL-G12D/+;p53flox/flox;Rosa26LSL-tdTomato/LSL-tdTomato;H11LSL-Cas9/LSL-Cas9 (KPT;H11LSL-Cas9) mice have been described (Chiou et al., 2015; Jackson et al., 2001; Madisen et al., 2010). Three unique sgRNAs targeting Zmat3 (selected from those used in the screen, sgZmat3.1: CTCCCCTGCCGTGGCAC, sgZmat3.2: CCACCACGCTGCTCACCC, sgZmat3.3: GGCTTACACAGCTCCTCCA), one previously characterized p53 sgRNA (AGGAGCTCCTGACACTCGGA), and two previously characterized negative control sgRNAs (sgNT.1: GCGAGGTATTCGGCTCCGCG, sgNT.2: CCGCGCCGTTAGGGAACGAG) were used for these experiments (Rogers et al., 2017). Lenti-sgRNA/Cre vectors were generated using standard methods (Chiou et al., 2015). Lung tumors were induced as previously described (DuPage et al., 2009). Specifically, 6–12 week old male and female KT;H11LSL-Cas9 or KPT;H11LSL-Cas9 mice were randomly assigned to experimental groups, and then anesthetized by intraperitoneal injection of Avertin (2-2-2 Tribromoethanol). 90,000 particles of Lenti-U6-sgRNA/PGK-Cre virus were suspended in 50 μl sterile PBS and delivered intratracheally. Lungs were harvested 17–20 weeks after infection and fixed in formalin for 24 hours before processing and H&E staining.
Mouse HCC study
The Memorial Sloan Kettering Cancer Center (MSKCC) Animal Care and Use Committee (protocol no. 11-06-011) approved all mouse experiments. Mice were maintained under specific pathogen-free conditions, and food and water were provided ad libitum. Liver tumorigenesis was induced by delivery of plasmids via hydrodynamic tail vein injection (Moon et al., 2019a). Specifically, a mixture of sterile 0.9% NaCl solution and plasmids containing pT3-Caggs-KrasG12D-IRES-GFP (5 μg), CRISPR plasmid px330 DNA (Cong et al., 2013) expressing Cas9 and a single guide RNA (sgRNA) targeting Chromosome 8 (negative control), p53 or Zmat3 (25 μg), and CMV-SB13 transposase (Huang et al., 2014) (6 μg) was prepared for each injection. sgRNA sequences used for cloning into pX330 are as follows: Chromosome 8 oligo (GACATTTCTTTCCCCACTGG); Trp53 oligo (GACCCTGTCACCGAGACCCC); Zmat3 oligo 1 (AGAGGATTTAGCTAAGAGAG); Zmat3 oligo 2 (GCCAGGGGGCAGGGTGATCC). Female C57BL/6 mice (6–8 weeks of age) from Charles River Laboratories were randomly assigned to experimental groups to be injected with the 0.9% NaCl solution/plasmid mix into the lateral tail vein, with a total volume corresponding to 10% of body weight in 5 to 7 seconds. Upon sacrifice, numbers and diameters of macroscopic liver tumors were recorded, and liver tissues were excised and fixed in formalin for 24 hours before processing and H&E staining.
Mouse cell culture and viral infections
MEFs were derived from E13.5 embryos (Brady et al., 2011). MEFs and 293T cells were cultured in DMEM with high glucose (Gibco) supplemented with 10% FBS. H11Cas9/+ MEFs were generated by crossing H11LSL-Cas9/LSL-Cas9 mice to CMV-Cre mice (Schwenk et al., 1995). To generate E1A;HRasG12V;p53+/+ or E1A;HRasG12V;p53+/+;Cas9 MEFs, wild-type or H11Cas9/+ MEFs were transduced with E1A and HrasGV12-expressing retroviruses (Brady et al., 2011). For library experiments, virus was produced in 15 cm plates, and target cells in 15 cm plates were transduced at a MOI of ~0.2, as measured by expression of the mCherry marker. Cells were selected in puromycin (2 μg/ml) for ~10 days prior to collection of time zero samples or injection into mice. Lung adenocarcinoma cell lines were generated from lung tumors dissected from 11-week-old KrasLA2/+;Trp53LSL-wt/LSL-wt mice. KrasLA2/+;Trp53LSL-wt/LSL-wt mice spontaneously recombine to express an oncogenic KrasG12D allele (Johnson et al., 2001). Cultures were established in N5 medium (Scheffler et al., 2005) supplemented with EGF (20 ng/ml) and FGF (20 ng/ml), then sorted by fluorescence-activated cell sorting (FACS) (Stanford Shared FACS facility) for EpCam positivity (BioLegend), and later switched to DMEM high-glucose media supplemented with 10% FBS. For Adenovirus infections, cells were seeded at 1 × 10⁵ cells/well in 6-well plates, then infected with either Ad5CMVempty (Ad-Empty, Cat# VVC-U of Iowa-272) or Ad5CMVCre (Ad-Cre, Cat# VVC-U of Iowa-5), obtained from the University of Iowa Viral Vector Core, at an MOI of 100. Cells were harvested for RNA preparation 48 hours after infection. Eμ-Myc lymphoma cells expressing a tamoxifen-inducible p53-Estrogen receptor fusion protein (Christophorou et al., 2005) (p53−/ER-TAM) were the kind gift of Lin He. Cells were grown on a feeder layer (irradiated 3T3 cells) and treated with 1 μM 4-hydroxytamoxifen (4OHT) or Ethanol (vehicle) and harvested for RNA preparation after 6 hours. Unless otherwise indicated, all cells were maintained in DMEM high-glucose media supplemented with 10% FBS at 37°C and 5%CO2.
The sex of the mouse cell lines was not determined as it was not expected to impact the results. Cell line authentication was not applicable.
Human cell culture
Human fibroblasts were obtained from Coriell Cell Repositories (GM00011, GM06170) and maintained in DMEM high-glucose media supplemented with 15% FBS at 37°C and 5%CO2. H23 human lung adenocarcinoma cells were maintained in DMEM high-glucose media supplemented with 10% FBS at 37°C and 5%CO2. All human cell lines are male and were not authenticated.
METHOD DETAILS
TSAG identification
Using microarray data from mouse embryonic fibroblasts (MEFs) expressing oncogenic HrasG12V (Brady et al., 2011), we compared the expression profiles of cells expressing p53 TAD mutants active in tumor suppression (wild-type p53, p5353,54, and p5325,26) with expression profiles of cells expressing p53 mutants inactive in tumor suppression (p5325,26,53,54 and p53 null), and identified genes induced at least 2-fold in the active group, yielding a list of 55 activated genes. We also identified a list of 58 genes induced 2-fold or greater in HrasG12V p5325,26-expressing MEFs relative to HrasG12V p53 null MEFs and at least 70% as well as by wild-type p53 relative to p53 null cells. These combined lists comprise 87 TSAGs. To determine whether the TSAGs are direct p53 targets, they were analysis for p53-bound response elements (RE) near or within their gene body using ChIP-seq datasets from mouse embryonic fibroblasts, stem cells, or splenocytes (Brady et al., 2011; Kenzelmann Broz et al., 2013; Lee et al., 2010; Li et al., 2012a; Tonelli et al., 2015) (Table S1).
Library design, amplification, and sequencing
25 shRNAs targeting each TSAG were drawn from a previously validated shRNA library (Kampmann et al., 2015), along with 1000 non-targeting shRNAs, and used as single library. 10 sgRNAs targeting each TSAG were drawn from a previously designed mouse-targeting library (Morgens et al., 2017); the guides were split into two pools along with 250 negative control safe-harbor sgRNAs each, which target predicted non-functional regions in the mouse genome to replicate the effects of DNA damage (Morgens et al., 2017). This resulted in two separate sgRNA libraries, each targeting a different set of genes but containing the same negative controls. shRNA and sgRNA libraries were synthesized and cloned (Kampmann et al., 2015; Morgens et al., 2017). The composition of the shRNA and sgRNA libraries were monitored by amplicon sequencing on a MiSeq (for shRNA libraries) and on a NextSeq (for sgRNA libraries) (Deans et al., 2016).
Analysis of shRNA library screens
Due to the size of the shRNA library, we relied on the observation of multiple, independent shRNAs highly represented relative to negative control shRNAs in a given tumor. The 22 base pairs of each shRNA were aligned to a library index using Bowtie (Langmead et al., 2009) with zero mismatches allowed. shRNAs were then tested for enrichment over the negative controls in each individual tumor. First, shRNAs with zero or one count were removed. Then, shRNAs with a greater number of counts than at least 95% of the remaining non-targeting controls detected were considered enriched in that tumor. This analysis was repeated for each tumor, and for each gene, the number of shRNAs targeting that gene that were enriched in at least one tumor were counted. Note that shRNAs that were enriched in multiple tumors were not counted multiple times. This number of enriched shRNAs targeting each gene was then compared to the total number of shRNAs targeting that gene detected. In order to calculate significance, a similar analysis was performed with the non-targeting controls, where the top 5% of non-targeting controls from each tumor were counted (again not counting the same control shRNA multiple times) and compared to the total number of non-targeting controls detected across all tumors. The number of enriched shRNAs targeting each gene was then compared to the fraction of enriched non-targeting controls using a hypergeometric test (i.e. sampling without replacement) to calculate a p-value.
Analysis of CRISPR/Cas9 library screens
The first 17 base pairs of the reads were aligned to the sgRNA library using Bowtie (Langmead et al., 2009) with zero mismatches allowed. Enrichment of each element was then calculated as a log base 2 ratio of the fraction of the counts in the tumor versus the time zero sample. Gene level data were then calculated with the safe-targeting guides as negative controls using version 1.0 of casTLE (Morgens et al., 2016). To identify consistent results across all 6 biological replicates for each library, the estimated casTLE effects for each gene from all 6 tumors were compared to a background of estimated casTLE effects of all genes from all 6 tumors. A Mann-Whitney U test was then used to calculate p-values.
Transformation assays
Anchorage-independent growth assays were performed by plating 3,000 cells per well in triplicate in 6-well plates. Cells were plated in phenol red-free DMEM containing 10% FBS, 50 U/ml penicillin/streptomycin and 0.3% agarose, on a layer of media containing DMEM with 10% FBS, 50 U/ml penicillin/streptomycin and 0.5% agarose, and grown for three weeks. After three weeks, cells were stained using a Giemsa solution (0.02% in PBS) and scored using ImageJ software.
In vivo competition assay
E1A;HrasG12V;p53+/+;Cas9 MEFs were transduced with lentiviruses expressing Zmat3, Dennd2c, or negative control sgRNAs along with GFP (Hess et al., 2016) or mCherry (Han et al., 2017) fluorescent markers. Cells with sgZmat3 or sgDennd2c and GFP or mCherry were mixed 1:1 with cells expressing a negative control sgRNA and the opposite marker. This input mixture of cells was analyzed for the GFP to mCherry ratio by flow cytometery (LSR Fortessa, BD Biosciences). Cells were then injected into mice and grown as subcutaneous tumors as described above. After three weeks, tumors were harvested and incubated in RPMI media with Liberase (20 μg/ml, Roche) and DNase (400 μg/ml, Roche) enzymes, then filtered, centrifuged with 30% Percoll (Sigma), washed in RPMI and analyzed for GFP and mCherry expression by flow cytometry (LSR Fortessa, BD Biosciences).
Analysis of CRISPR indels
Genomic DNA was extracted from E1A;HrasG12V;Cas9 MEFs expressing sgRNAs using the DNeasy Blood and Tissue kit (Qiagen). The intended sgRNA target sites were PCR amplified using primers designed to flank the site. PCR products were separated on agarose gels and the amplified products extracted using a Gel Extraction Kit (Qiagen). The DNA fragments were Sanger sequenced by Quintara Biosciences (Berkeley, CA). Sequencing files were submitted to ICE v2 CRISPR analysis tool (Synthego, Menlo Park, CA).
qRT-PCR and Semi-quantitative PCR
Trizol reagent (Invitrogen) was used for RNA preparation, and reverse transcription was performed with MMLV reverse transcriptase (Invitrogen). Quantitative PCR was performed in triplicate using gene-specific primers and SYBR green (Life Technologies) in a 7900HT Fast Real-Time PCR machine (Applied Biosystems). Changes in transcript abundance were calculated using the standard curve method. Semi-quantitative PCR was performed for 27, 32, or 35 cycles (45 s 95°C; 30 s at 58°C; 40 s at 72°C) using a ~34-ng cDNA template. Products were visualized on a 2% agarose gel. Primer sequences are in Table S7.
ChIP
E1A;HrasG12V;Cas9 MEFs were seeded at 7.5 × 10⁶ cells per 10-cm dish and ChIP was performed the following day. Briefly, cells were crosslinked at room temperature by treatment with DMEM media with 1% formaldehyde, and the reaction was quenched by addition of glycine to a final concentration of 0.125 M. After washing with cold 1X PBS, cells were harvested by scraping in lysis buffer (5 mM PIPES pH 8.0, 85 mM KCl, 0.5% NP-40) and pelleted. Cell pellets were processed by passage through a 21-gauge needle 20 times. Lysates were pelleted and resuspended in RIPA buffer. Sonication was performed in a Bioruptor sonicator (Diagenode) to shear chromatin to a size range of ~200–700 bp. Anti-p53 antibody (CM5, Leica Novocastra) was coupled to ChIP-grade protein A/G magnetic beads (Thermo Scientific) overnight. After saving 10% for an input sample, samples were immunoprecipitated for one hour at room temperature and one hour at 4°C, and washes were performed two times with low-salt wash buffer (0.1% SDS, 1% Triton X-100, 2 mM EDTA, 20 mM Tris-HCl at pH 8.1, 150 mM NaCl), three times with high-salt wash buffer (0.1% SDS, 1% Triton X-100, 2 mM EDTA, 20 mM Tris-HCl at pH 8.1, 500 mM NaCl), and four times with LiCl wash buffer (0.25 M LiCl, 1% IGEPAL CA630, 1% deoxycholic acid sodium salt, 1 mM EDTA, 10 mM Tris at pH 8.1). Input was reverse crosslinked by treatment with ProK, RNAse A, and incubation at 65°C. All samples were purified by PCR Purification Kit (Qiagen). Chromatin-immunoprecipitated DNA was quantified by qPCR using SYBR Green (SA-Biosciences) and a 7900HT Fast Real-Time PCR machine (Applied Biosystems).
Western blots
Western blots were performed according to standard protocols. Briefly, cells were lysed in RIPA buffer, extracts were run on SDS-PAGE gels, gels were transferred to PVDF membrane (Immobilon, Millipore), and membranes were blocked with 5% milk and probed with antibodies directed against Zmat3 (1:100, Santa Cruz), p53 (CM5, 1:500 Leica Novocastra), Ptpn14 (1:100, Santa Cruz), or Gapdh (1:15,000, Fitzgerald), followed by anti-mouse or anti-rabbit HRP-conjugated secondary antibodies (Vector Laboratories). Blots were developed with ECL Prime (Amersham) and imaged using a ChemiDoc XRS+ (BioRad).
Immunohistochemistry
Hematoxylin and eosin (H&E) staining and immunohistochemistry were performed on paraffin-embedded lungs using standard protocols. Immunohistochemistry was performed using antibodies directed against Ki67 (1:100, BD Biosciences,) and Cleaved caspase 3 (1:400, Cell Signaling Technologies). Briefly, paraffin sections were re-hydrated, unmasked in 10mM Sodium Citrate buffer with 0.05% Tween 20 in a pressure cooker for 10 minutes, the peroxidase was quenched for 15 minutes in 3% H2O2, sections were blocked for 30 minutes in TBS with 0.025% Triton X-100 supplemented with 10% serum and 1% BSA, and incubated overnight at 4°C with primary antibody. On the next day, the sections were incubated for 30 minutes with biotinylated antibody compatible with the primary antibody used (1:1000, Vector Laboratories) and were subsequently incubated with VECTASTAIN Elite ABC HRP Kit (Vector Laboratories), according to manufacturer’s instructions. The sections were washed with TBS in between steps. Staining was performed using the DAB peroxidase kit (Vector Laboratories) and hematoxylin (H-3401, Vector Laboratories) for counter-staining. A Leica DM6000B microscope (Leica Microsystems) or NanoZoomer 2.0-RS slide scanner (Hamamatsu) was used for imaging.
Overexpression and immunofluorescence
Overexpression experiments for BrdU incorporation analysis were performed using constructs in which Zmat3 cDNA was cloned into a pCDNA vector carrying an HA-tag. The pcDNA3.1–3XHA-Zmat3 construct was generated by PCR amplification and insertion of the cDNA into AscI and PacI restriction sites in pcDNA3.1–3XHA plasmid (gift of S. Artandi). The pcDNA3.1–3XHA-p53 and pcDNA3.1–3XHA-GFP constructs have been described (Brady et al., 2011). The pcDNA3.1–3XHA-Zmat3 plasmid was used as a template for site-directed mutagenesis to generate pcDNA3.1–3XHA-Zmat3R99Q. KOD Xtreme Hot Start DNA Polymerase (71975-M, Sigma-Aldrich) was used to amplify the template with a pair of primers (forward primer 5’-catggcaagaaactacaaaattattacgcagct-3’; and reverse primer: 5’-agctgcgtaataattttgtagtttcttgccatg −3’), and the mutation was verified by Sanger sequencing. p53 null MEFs and H23 cells were transfected with the constructs using Lipofectamine 2000 (Invitrogen), according to manufacturer instructions. Twenty-four hours later, cells were pulsed with 3 μg/ml BrdU for 4 hours, fixed in 4% paraformaldehyde for 15 minutes, washed in PBS, permeabilized in PBS + 0.25 % Triton X-100 for 15 minutes, washed in PBS, incubated with anti-HA (1:400, Cell Signaling Technologies) antibody overnight at 4°C, washed in PBS, and subsequently incubated with anti-rabbit fluorescein-labeled secondary antibody (1:200, Vector Laboratories) for 1 hour. The cells were then post fixed with 4% paraformaldehyde, washed and treated with hydrochloric acid (1.5 N) for DNA denaturation. Next, the cells were washed in PBS, incubated with anti-BrdU antibody (1:50, BD Pharmingen), washed in PBS, and incubated with anti-mouse Alexafluor 546-labeled secondary antibody (1:200, Invitrogen). Images were taken using a Leica DM6000B microscope (Leica Microsystems).
Human cancer data analysis
Expression of ZMAT3 was evaluated in human tumors with wild-type or mutant TP53 using TCGA data available via the Genomic Data Portal (gdc.cancer.gov) and the METABRIC breast cancer dataset (Curtis et al., 2012; Pereira et al., 2016) (www.ebi.ac.uk/ega/studies/EGAS00000000083). ZMAT3 expression was adjusted by copy number status to control for the effect of amplifications caused by the proximity of ZMAT3 to PIK3CA, a known driver of tumorigenesis, to ensure that we examined the effect of ZMAT3 expression and not PI3KCA amplification. Samples were stratified based on TP53 status. Confidence intervals were calculated at 95%. Clinical outcome analyses were generated based on disease-specific survival for the METABRIC breast cancer dataset. A log rank test measuring the difference in survival between samples with high expression (1st tertile) and low expression (3rd tertile) of ZMAT3 or DENND2C was performed. Additionally, a Cox Proportional Hazard model was built to evaluate the association between expression and outcome while adjusting for age, grade, size, lymph node number and ER and HER2 status in the breast cancer analysis and age, gender and stage in the LIHC and LUAD analysis. Mutual exclusivity between TP53 and ZMAT3 or DENND2C mutations was evaluated in uterine (UCEC) cancer using data from TCGA. The DISCOVER method, which robustly controls the false positive rate (Canisius et al., 2016), was used to test for mutual exclusivity, and the accompanying p-value is reported. For survival analysis, the packages “survival”, “rms” and “survcomp” were used (Schroder et al., 2011). Oncoplots were generated with package “maftools” (Mayakonda, 2016).
ZMAT3 eCLIP and data analysis
ZMAT3 eCLIP was performed by Eclipse BioInnovations Inc (San Diego) with slight modifications to the published seCLIP protocol. Polyclonal populations of E1A;HrasG12V;Cas9 MEFs expressing one of three different NC sgRNAs and one E1A;HrasG12V Zmat3-knockout MEF sample (Janic et al., 2018) were used for the experiment. Briefly, 20 million cells were UV crosslinked (254nM, 400 mJ/cm2) and lysed in 1 mL of 4°C eCLIP lysis buffer (50 mM TrisHCl pH 7.4, 100 mM NaCl, 1% NP-40, 0.1% SDS, 0.5% sodium deoxycholate, 1:200 Protease Inhibitor Cocktail III [EMD Millipore], 440 U Murine RNase Inhibitor (Vilborg et al.)). The extract was sonicated (Qsonica Q800R2, 15 cycles of 20s on/40s off), incubated with 40 U of RNase I (Ambion) and 4 U Turbo DNase (ThermoFisher) for 5 min at 37°C, and clarified by centrifugation (15k g, 15 min at 4°C). Anti-ZMAT3 antibody (10504–1-AP, Proteintech) was pre-coupled to sheep anti-rabbit IgG Dynabeads (ThermoFisher) and added to clarified lysate followed by incubation overnight at 4°C with rotation. 2% of lysate was removed as paired input, and the remainder was washed with eCLIP high- and low-salt wash buffers. Dephosphorylation (FastAP, ThermoFisher and T4 PNK, NEB) treatment and high efficiency ligation of InvRiL19 (/5Phos/rArGrArUrCrGrGrArArGrArGrCrArCrArCrGrUrC/3SpC3/) RNA adapter (T4 RNA Ligase I (NEB)) was performed as previously described. After one additional high salt buffer wash and two additional wash buffer washes, samples were denatured in 1X NuPAGE buffer with 0.1 M DTT. For chemiluminescent imaging, 10% of ZMAT3 IP and 1% of input were run on NuPAGE 4–12% Bis-Tris protein gels, transferred to PVDF membrane, probed with ZMAT3 antibody (1:1000, sc398712, Santa Cruz) and 1:8,000 EasyBlot anti Mouse IgG (HRP) (GeneTex), and imaged with C300 Imager using Azure Radiance ECL. For RNA extraction, 80% of ZMAT3 IP and 50% of input were run on NuPAGE 4–12% Bis-Tris protein gels, transferred to nitrocellulose membrane, and the region from 35 to 110 kDa (protein size to 75kDa above) was isolated from the membrane, finely fragmented, and treated with 20 μL Proteinase K (NEB) plus 130 μL PKS buffer (10 mM TrisHCl pH 7.4, 50 mM NaCl, 10 mM EDTA, 0.2% SDS). An additional 55 μL of water was added, and RNA was then purified by RNA Clean & Concentrator column cleanup (Zymo). Reverse transcription was performed with 120 U Superscript III (ThermoFisher) with InvAR17 primer (CAGACGTGTGCTCTTCCGA) at 55°C for 20 min, followed by addition of 2.5 μL ExoSAP-IT and incubation at 37°C for 15 min. After addition of 1 μL 0.5M ETDA, RNA was removed by addition of 3 μL 1M NaOH and incubation at 70°C for 10 min. 3 μL of 1M HCl was added to normalize pH, and RNA was purified with MyOne Silane beads (ThermoFisher). Ligation of InvRand3Tr3 adapter (/5Phos/NNNNNNNNNNAGATCGGAAGAGCGTCGTGT/3SpC3/) to the 5’ end of cDNA was performed with T4 RNA Ligase plus the addition of 15 U 5’ Deadenylase (NEB). After RNA purification with MyOne Silane beads (ThermoFisher), PCR amplification (Q5 Master Mix, NEB) was performed with standard Illumina multiplexing indexes, and samples were sequenced on the HiSeq4000 platform.
Analysis of eCLIP data was performed as previously described (Van Nostrand et al., 2016), using the UCSC GRCm38/mm10 genome build with GENCODE Release M20 (GRCh38.p6) transcript annotations. For each sample (sgNC1, sgNC2, sgNC3), ZMAT3-bound RNAs were identified by calculating enrichment of sequencing reads in the eCLIP sample relative to the reads in the input and the ZMAT3-deficient sample. Meta-exon maps were generated as previously described (Van Nostrand, 2019). Briefly, for each gene in Gencode v19, the transcript with the highest abundance in the three control E1A;HrasG12V;Cas9 sgNC RNA-seq datasets was chosen as the representative transcript, and genes with representative transcript with TPM < 1 were discarded. Next, for all internal exons (excluding the first and last exons), the region from 500nt upstream to 500nt downstream (for introns less than 1000nt, the region was split, with half assigned to the upstream exon and half to the downstream exon) was queried for the presence of significant peaks. Finally, the number of peaks at each position was averaged over all events to obtain the final meta-exon value. To generate confidence intervals, bootstrapping was performed by randomly selecting (with replacement) the same number of transcripts and calculating the average position-level peak coverage as above, with the 5th and 95th percentiles (out of 100 permutations) shown. Human comparison eCLIP meta-exon plots were obtained from published data (Van Nostrand, 2019).
RNA-seq
E1A;HrasG12V;Cas9 MEFs were transduced with lentiviruses expressing one of three unique Zmat3 or one of three unique negative control sgRNAs, selected in puromycin for 3 days, and cultured an additional 10 days. RNA was extracted from cultured cells using RNeasy Mini kit (QIAGEN). RNA-seq libraries were prepared using the Illumina TruSeq Kit (v.2), according to the manufacturer’s instructions. RNA-seq reads were aligned to the mouse genome (mm10) and analyzed using the public server Galaxy (usegalaxy.org,(Afgan et al., 2018)), which employs the STAR aligner (Dobin et al., 2013) and DESeq2 (Love et al., 2014) for differential expression analysis. Significantly differentially expressed transcripts were identified using an adjusted p-value cutoff of <0.05. Enrichr (https://maayanlab.cloud/Enrichr/) was used to identify enriched gene ontology (GO) terms (Kuleshov et al., 2016).
RNA-seq alternative splicing analysis
First, fastq files were processed using cutadapt (1.14.0) (Martin, 2011) to trim adapters and low quality sequences. Next, trimmed reads were first aligned using STAR (2.4.0i) (Dobin et al., 2013) against repeat elements (RepBase 18.05) with aligning reads removed from further analysis. Remaining non-repeat reads were then mapped against the mouse assembly (mm10) to generate corresponding bam files. Bigwigs were generated using an in-house script (https://github.com/yeolab/makebigwigfiles) which uses bedtools (2.26.0) genomecov to generate normalized density tracks. For analysis of alternative splicing, triplicates of the Zmat3 knockouts (E1A;HrasG12V;Cas9 MEF lines transduced with lentiviruses expressing one of three unique Zmat3 sgRNAs) were compared against WT controls (E1A;HrasG12V;Cas9 MEF lines transduced with lentiviruses expressing one of three unique NC sgRNAs) using rMATS (3.2.5) with Gencode (vM15) annotations. Featurecounts (1.5.3) (Liao et al., 2014)was used to count reads mapping to known transcripts using the same vM15 annotations. Differential alternative splicing events were defined by a <5% change in exon inclusion (PSI or percent-spliced-in >0.05) and a p-value <0.05.
Comparing ZMAT3 peaks & SMG1-regulated exons
To determine whether ZMAT3 binding is enriched at NMD switch exons, the frequency of ZMAT3 binding peaks was determined for a list of alternative splicing events in SMG1 wild-type and knockout MEFs that were predicted to introduce premature termination codons (PTC) (McIlwain et al., 2010) by identifying the percentage of exons that contain a ZMAT3 peak (sample WT2) anywhere in the region starting at the upstream exon and ending at the downstream exon of the queried exon. This percentage was calculated for PTC-containing exons that are ≥5% differentially spliced in the direction that would include the PTC in SMG1 wild-type versus knockout MEFs (SMG1-regulated PTC exon). As one control, the set of PTC-containing exons that are <1% differentially spliced was similarly compared against ZMAT3 peaks. As another control, sets of 232 internal exons with similar expression levels to the SMG1 regulated exons were randomly selected 10,000 times and compared against ZMAT3 peaks. Significance was calculated by identifying the number of times this random selection identified an equal or greater number of events with overlapping ZMAT3 peaks.
Analysis of DepMap samples
To evaluate genotype-specific dependencies of human cell lines, we categorized all cell lines (including breast, lung, liver, and colon cancer lines) in the Achilles DepMap dataset (CCLE_Depmap_18q3 release) into two categories: TP53 aberrant or TP53 wild-type. Cell lines were considered “TP53 aberrant” if they fulfilled at least one of the following criteria: (1) mRNA expression of TP53 was at least one standard deviation below the mean of all cell lines tested; AND/OR (2) cell lines were previously annotated as TP53-mutant (“is Deleterious” criteria could be either TRUE or FALSE) (n= 350 TP53-aberrant cell lines). Cell lines were considered “TP53 wild-type” if they fulfilled both of these criteria: (1) mRNA expression of TP53 was greater than one standard deviation above the mean of all cell lines tested; AND (2) cell lines were not previously annotated as having a mutation in TP53 (n=135 TP53 wild-type cell lines). We then calculated the mean dependency scores for each gene in the genome for all TP53 aberrant lines and all TP53 wild-type lines. We performed two-tailed t-tests evaluating the differences in mean dependency scores for each gene and then adjusted the P-values with the Benjamini-Hochberg procedure for multiple comparison testing (generating FDR values). Genes with FDR values < 0.1 were considered significant.
QUANTIFICATION AND STATISTCAL ANALYSIS
A hypergeometric test (i.e. sampling without replacement) was used to calculate significance in the shRNA screen. A Mann-Whitney U test was used to calculate significance in the sgRNA screen. A log-rank test and Cox Proportional Hazard model were used to calculate significance in the survival analyses. The DISCOVER method was used to test for mutual exclusivity. The Benjamini-Hochberg procedure for multiple comparison testing was used to calculate significance in the analysis of DepMap samples. The unpaired two-tailed Student’s t-test was used for all the other statistical analyses. Error bars represent standard deviation or standard error of the mean (see figure legends). Significance was defined as a p value≤0.05, unless otherwise stated. Details and significance values can be found in the figure legends.
Supplementary Material
Supplemental Table 4: ZMAT3 binding peaks. (Related to Figure 6). ZMAT3 binding peaks from eCLIP data are reported for 3 samples (sgNC1, sgNC2, sgNC3) normalized to the Zmat3 knockout sample and normalized to the input sample.
Supplemental Table 5: Differentially expressed genes in Zmat3-deficient versus negative control MEFs (Related to Figure 6). Gene list was generated by comparison of RNA-seq data from three E1A;HrasG12V;Cas9 MEF lines transduced with lentiviruses expressing unique Zmat3 sgRNAs and three E1A;HrasG12V;Cas9 MEF lines transduced with lentiviruses expressing unique NC sgRNAs (FDR<0.05).
Supplemental Table 6: rMATs analysis of differential splicing events in Zmat3-deficient versus negative control MEFs (Related to Figure 6). Sample 1 is based on three E1A;HrasG12V;Cas9 MEF lines transduced with lentiviruses expressing unique Zmat3 sgRNAs and sample 2 is based on three E1A;HrasG12V;Cas9 MEF lines transduced with lentiviruses expressing unique NC sgRNAs.
KEY RESOURCES TABLE
| REAGENT or RESOURCE | SOURCE | IDENTIFIER |
|---|---|---|
| Antibodies | ||
| p53 antibody (CM5) | Leica (Novocastra) | NCL-L-p53-CM5p RRID:AB_563933 |
| Zmat3/Wig1 antibody | Santa Cruz | sc-398712 |
| Zmat3 antibody | Proteintech | 10504–1-AP RRID:AB_2217579 |
| Ptpn14/Pez (F-12) antibody | Santa Cruz | sc-373766 RRID:AB_10917236 |
| BrdU antibody | Becton Dickinson | 555627 RRID:AB_10015222 |
| Mdm4 antibody | Sigma-Aldrich | M0445 RRID:AB_532256 |
| HA antibody | Cell Signaling Technologies | #3724 RRID:AB_1549585 |
| Ki67 antibody | BD Biosciences | 550609 RRID:AB_393778 |
| Cleaved Caspase 3 antibody | Cell Signaling Technologies | #9664 RRID:AB_2070042 |
| Goat-anti-rabbit HRP antibody | Jackson Immuno Research | 11-035-144 RRID:AB_11035144 |
| Goat-anti-mouse HRP antibody | Jackson Immuno Research | 115-035-146 RRID:AB_2307392 |
| Goat biotinylated anti rabbit IgG | Vector Labs | BA-1000 RRID:AB_2313606 |
| Horse biotinylated anti mouse IgG | Vector Labs | BA-2000 RRID:AB_2313581 |
| Anti-mouse Alexafluor 546-labeled secondary antibody | Vector Labs | A11003 RRID:AB_141370 |
| Anti-rabbit fluorescein-labeled secondary antibody | Vector Labs | FI-1000 RRID:AB_2336197 |
| Gapdh antibody | Fitzgerald | 10R-G109A RRID:AB_1285808 |
| Alpha-Tubulin antibody | Sigma-Aldrich | T6074 RRID:AB_477582 |
| Bacterial and Virus Strains | ||
| Ad-Cre or Ad5CMVCre | University of Iowa | VVC-U of Iowa-5 |
| Ad-empty or Ad5CmVempty | University of Iowa | VVC-U of Iowa-272 |
| Biological Samples | ||
| Chemicals, Peptides, and Recombinant Proteins | ||
| 5-Bromo-2’-deoxyuridine (BrdU) | Millipore Sigma | 203806 |
| Lipofectamine 2000 | ThermoFisher | 11668019 |
| Critical Commercial Assays | ||
| TruSeq RNA Library Prep Kit (v.2) | Illumina | RS-122–2001 |
| POWER SYBR Green PCR Master Mix | ThermoFisher | 4367660 |
| TRIzol reagent | ThermoFisher | 15596026 |
| M-MLV Reverse Transcriptase | ThermoFisher | 28025013 |
| DAB Peroxidase (HRP) Substrate Kit (with Nickel), 3,3’-diaminobenzidine | Vector Laboratories | SK-4100 |
| VECTASTAIN Elite ABC HRP Kit (Peroxidase, Standard) | Vector Laboratories | PK-6100 |
| ECL prime Western Blotting System | Millipore Sigma | GERPN2232 |
| Deposited Data | ||
| HrasV12-expressing MEFs homozygous for different Trp53 alleles | Brady et al., 2011 | GSE27901 |
| Mouse p53 ChIP-seq | Kenzelmann Broz et al., 2013 | GSE46240 |
| Human p53 ChIP-seq | Younger et al., 2015 | GSE55727 |
| TCGA human cancer data | Genomic Data Commons | https://gdc.cancer.gov |
| METABRIC human breast cancer data | European Genome-Phenome Archive | https://ega-archive.org/dacs/EGAC00001000484 |
| Achilles DepMap (CCLE_Depmap_18q3 release) | Meyers et al., 2017 | https://depmap.org/portal/download/ |
| Zmat3 RNA-seq | This paper | GSE145430 |
| Zmat3 eCLIP | This paper | GSE14555 |
| Experimental Models: Cell Lines | ||
| Mouse: p53WT MEFs | Laboratory of Laura Attardi | |
| Mouse: H11Cas9/Cas9; p53WT/WT MEFs | Laboratory of Laura Attardi | |
| Mouse: p53−/− MEFs | Laboratory of Laura Attardi | |
| Mouse: Zmat3−/− MEFs | Laboratory of Andreas Strasser | |
| Mouse: p53WT non-small cell lung cancer cell line: KrasLA2/+;Trp53LSL-WT/LSL-WT | Laboratory of Laura Attardi | |
| Mouse: Eμ-Myc B cell lymphoma cells: Eμ-myc;Trp53ER/- | Laboratory of Lin He | |
| Human: H23 lung adenocarcinoma | ATCC | CRL-5800 |
| Human: Fibroblasts | Coriell Cell Repositories | GM00011, GM06170 |
| Experimental Models: Organisms/Strains | ||
| Mouse: ICR-Scid: IcrTac:ICR-Prkdcscid | Taconic | ICRSC-M |
| Mouse: KrasLSL-G12D mice: B6.129S4-Krastm4Tyj | Laboratory of Tyler Jacks | |
| Mouse: Trp53flox mice: B6.129P2-Trp53tm1Brn/J | The Jackson Laboratory | 008462 |
| Mouse: Rosa26LSL-tdTomato | Madisen et al., 2010 | |
| Mouse: H11LSL-Cas9: B6;129-Igs2tm1(CAG-cas9+)Mmw/J | Chiou et al 2015, The Jackson Laboratory | 026816 |
| Mouse: CMV-Cre: B6.C-Tg(CMV-cre)1Cgn/J | Schwenk et al., 1995 The Jackson Laboratory | 006054 |
| Mouse: C57BL/6 | Charles River Laboratories | C57BL/6NCrl |
| Oligonucleotides | ||
| See Table S7 for primers. | ||
| Recombinant DNA | ||
| Lentiviral shRNA TSAG library | This manuscript | |
| Lentiviral sgRNA TSAG library- Pool 1 | This manuscript | |
| Lentiviral sgRNA TSAG library- Pool 2 | This manuscript | |
| Lentiviral sgRNA mouse safe harbor library (250) | Laboratory of Michael Bassik | |
| pMCB246 shRNA vector with shRNAs targeting Luciferase, Trp53, Zmat3, Ptpn14, Trp53inp1 | Laboratory of Michael Bassik, this manuscript | |
| pMCB320 sgRNA vector with sgRNAs targeting p53, Zmat3, Dennd2c, Zmat3 RE, or safe harbor controls | Han et al., 2017, this manuscript | Addgene: 89359 |
| pGH020 sgRNA vector with sgRNAs targeting Zmat3, Dennd2c, or safe harbor controls | Hess et al., 2016, this manuscript | Addgene: 85405 |
| Lenti-pLL3.3: sgNT1/Cre | Laboratory of Monte Winslow | Addgene: 66895 |
| Lenti-pLL3.3: sgNT3/Cre | Laboratory of Monte Winslow | Addgene: 89654 |
| Lenti-pLL3.3 sgp53 | This manuscript | |
| Lenti-pLL3.3 sgZmat3 (1–3) | This manuscript | |
| pT3-Caggs-Kras G12D-IRES-EGFP | This manuscript | |
| CMV-SB13 transposase | Huang et al., 2014 | |
| px330-U6-sgRNA-CMV-spCas9 | Cong et al., 2013 | Addgene: 42230 |
| pcDNA3.1–3XHA-GFP | Brady et al., 2011 | |
| pcDNA3.1–3XHA-p53 | Brady et al., 2011 | |
| pcDNA3.1–3XHA-Zmat3 | This manuscript | |
| pcDNA3.1–3XHA-Zmat3R99Q | This manuscript | |
| Software and Algorithms | ||
| Enrichr | Kuleshov et al., 2016 | amp.pharm.mssm.edu/Enrichr/ |
| Survcomp | Schroder et al., 2001 | http://bioconductor.org/packages/release/bioc/html/survcomp.html |
| Galaxy | Afgan et al., 2018 | usegalaxy.org |
| DEseq2 | Love et al, 2014 | https://bioconductor.org/packages/release/bioc/html/DESeq2.html |
| DISCOVER package | Canisius et al., 2016 | http://ccb.nki.nl/software/discover/ |
| Maftools | Mayakonda et al., 2016 | https://www.bioconductor.org/packages/release/bioc/html/maftools.html |
| CasTLE | Morgens et al., 2016 | https://bitbucket.org/dmorgens/castle. |
| Cutadapt (1.14.0) | Martin, 2011 | http://code.google.com/p/cutadapt/ |
| STAR (2.4.0i) | Dobin et al., 2013 | https://github.com/alexdobin/STAR/releases/tag/STAR_2.4.0i |
| makebigwigfiles | Laboratory of Gene Yeo | https://github.com/yeolab/makebigwigfiles |
| rMATS (3.2.5) | Park et al., 2013 | http://rnaseq-mats.sourceforge.net/ |
| Featurecounts (1.5.3) | Liao et al., 2014 | http://bioinf.wehi.edu.au/subread-package/ |
| Image J | NIH | imagej.nih.gov |
| ICE v2 CRISPR analysis | Synthego | https://www.synthego.com/products/bioinformatics/crispr-analysis |
Highlights:
RNAi and CRISPR screens in vivo reveal p53 targets with tumor suppressor activity
Zmat3 is a tumor suppressor in mouse lung and liver cancers and human carcinomas
Zmat3 binds RNA with unique positional specificity to regulate RNA splicing
Zmat3 RNA splicing affects transcripts involved in a variety of cellular processes
Acknowledgments
We thank Laurakay Bruhn, Steven Altschuler, Ben Borgo, Peter Sheffield and Carsten Carstens of Agilent Inc. for oligonucleotide synthesis and helpful discussions. We thank Lin He for the Eμ-Myc lymphoma cells, Andreas Strasser and Ana Janic for the Zmat3 null MEFs, and Julien Sage and Aaron Gitler for critical reading of the manuscript. This work was supported by NIH R35 grant CA197591 and Tobacco-Related Disease Research Program grant 28IP-0037 to L.D.A. and an American Cancer Society Postdoctoral Fellowship PF-12-195-01-TGB and National Research Service Award F32 CA162681-02 to K.T.B-R.
Footnotes
Publisher's Disclaimer: This is a PDF file of an unedited manuscript that has been accepted for publication. As a service to our customers we are providing this early version of the manuscript. The manuscript will undergo copyediting, typesetting, and review of the resulting proof before it is published in its final form. Please note that during the production process errors may be discovered which could affect the content, and all legal disclaimers that apply to the journal pertain.
Declaration of Interests
ELVN is co-founder, member of the Board of Directors, on the SAB, equity holder, and paid consultant for Eclipse BioInnovations. GWY is co-founder, member of the Board of Directors, on the SAB, equity holder, and paid consultant for Locana and Eclipse BioInnovations. GWY is a visiting professor at the National University of Singapore. Dr. Yeo’s interest(s) have been reviewed and approved by UCSD in accordance with its conflict of interest policies. The authors declare no other competing financial interests.
References
- Ackermann A, and Brieger A (2019). The Role of Nonerythroid Spectrin alphaII in Cancer. J Oncol 2019, 7079604. [DOI] [PMC free article] [PubMed] [Google Scholar]
- Afgan E, Baker D, Batut B, van den Beek M, Bouvier D, Cech M, Chilton J, Clements D, Coraor N, Gruning BA, et al. (2018). The Galaxy platform for accessible, reproducible and collaborative biomedical analyses: 2018 update. Nucleic acids research 46, W537–W544. [DOI] [PMC free article] [PubMed] [Google Scholar]
- Al Saati T, Clerc P, Hanoun N, Peuget S, Lulka H, Gigoux V, Capilla F, Beluchon B, Couvelard A, Selves J, et al. (2013). Oxidative stress induced by inactivation of TP53INP1 cooperates with KrasG12D to initiate and promote pancreatic carcinogenesis in the murine pancreas. The American journal of pathology 182, 1996–2004. [DOI] [PubMed] [Google Scholar]
- Andrysik Z, Galbraith MD, Guarnieri AL, Zaccara S, Sullivan KD, Pandey A, MacBeth M, Inga A, and Espinosa JM (2017). Identification of a core TP53 transcriptional program with highly distributed tumor suppressive activity. Genome Res 27, 1645–1657. [DOI] [PMC free article] [PubMed] [Google Scholar]
- Attig J, Agostini F, Gooding C, Chakrabarti AM, Singh A, Haberman N, Zagalak JA, Emmett W, Smith CWJ, Luscombe NM, et al. (2018). Heteromeric RNP Assembly at LINEs Controls Lineage-Specific RNA Processing. Cell 174, 1067–1081 e1017. [DOI] [PMC free article] [PubMed] [Google Scholar]
- Bardot B, Bouarich-Bourimi R, Leemput J, Lejour V, Hamon A, Plancke L, Jochemsen AG, Simeonova I, Fang M, and Toledo F (2015). Mice engineered for an obligatory Mdm4 exon skipping express higher levels of the Mdm4-S isoform but exhibit increased p53 activity. Oncogene 34, 2943–2948. [DOI] [PubMed] [Google Scholar]
- Bassik MC, Lebbink RJ, Churchman LS, Ingolia NT, Patena W, LeProust EM, Schuldiner M, Weissman JS, and McManus MT (2009). Rapid creation and quantitative monitoring of high coverage shRNA libraries. Nature methods 6, 443–445. [DOI] [PMC free article] [PubMed] [Google Scholar]
- Bersani C, Huss M, Giacomello S, Xu LD, Bianchi J, Eriksson S, Jerhammar F, Alexeyenko A, Vilborg A, Lundeberg J, et al. (2016). Genome-wide identification of Wig-1 mRNA targets by RIP-Seq analysis. Oncotarget 7, 1895–1911. [DOI] [PMC free article] [PubMed] [Google Scholar]
- Bersani C, Xu LD, Vilborg A, Lui WO, and Wiman KG (2014). Wig-1 regulates cell cycle arrest and cell death through the p53 targets FAS and 14-3-3sigma. Oncogene 33, 4407–4417. [DOI] [PMC free article] [PubMed] [Google Scholar]
- Bieging KT, Mello SS, and Attardi LD (2014). Unravelling mechanisms of p53-mediated tumour suppression. Nature reviews Cancer 14, 359–370. [DOI] [PMC free article] [PubMed] [Google Scholar]
- Boutz PL, Bhutkar A, and Sharp PA (2015). Detained introns are a novel, widespread class of post-transcriptionally spliced introns. Genes & development 29, 63–80. [DOI] [PMC free article] [PubMed] [Google Scholar]
- Bowen ME, McClendon J, Long HK, Sorayya A, Van Nostrand JL, Wysocka J, and Attardi LD (2019). The Spatiotemporal Pattern and Intensity of p53 Activation Dictates Phenotypic Diversity in p53-Driven Developmental Syndromes. Dev Cell 50, 212–228 e216. [DOI] [PMC free article] [PubMed] [Google Scholar]
- Brady CA, Jiang D, Mello SS, Johnson TM, Jarvis LA, Kozak MM, Kenzelmann Broz D, Basak S, Park EJ, McLaughlin ME, et al. (2011). Distinct p53 transcriptional programs dictate acute DNA-damage responses and tumor suppression. Cell 145, 571–583. [DOI] [PMC free article] [PubMed] [Google Scholar]
- Canisius S, Martens JW, and Wessels LF (2016). A novel independence test for somatic alterations in cancer shows that biology drives mutual exclusivity but chance explains most co-occurrence. Genome biology 17, 261. [DOI] [PMC free article] [PubMed] [Google Scholar]
- Cano CE, Gommeaux J, Pietri S, Culcasi M, Garcia S, Seux M, Barelier S, Vasseur S, Spoto RP, Pebusque MJ, et al. (2009). Tumor protein 53-induced nuclear protein 1 is a major mediator of p53 antioxidant function. Cancer research 69, 219–226. [DOI] [PubMed] [Google Scholar]
- Cerami E, Gao J, Dogrusoz U, Gross BE, Sumer SO, Aksoy BA, Jacobsen A, Byrne CJ, Heuer ML, Larsson E, et al. (2012). The cBio cancer genomics portal: an open platform for exploring multidimensional cancer genomics data. Cancer discovery 2, 401–404. [DOI] [PMC free article] [PubMed] [Google Scholar]
- Chiou SH, Winters IP, Wang J, Naranjo S, Dudgeon C, Tamburini FB, Brady JJ, Yang D, Gruner BM, Chuang CH, et al. (2015). Pancreatic cancer modeling using retrograde viral vector delivery and in vivo CRISPR/Cas9-mediated somatic genome editing. Genes & development 29, 1576–1585. [DOI] [PMC free article] [PubMed] [Google Scholar]
- Christophorou MA, Martin-Zanca D, Soucek L, Lawlor ER, Brown-Swigart L, Verschuren EW, and Evan GI (2005). Temporal dissection of p53 function in vitro and in vivo. Nature genetics 37, 718–726. [DOI] [PubMed] [Google Scholar]
- Cong L, Ran FA, Cox D, Lin S, Barretto R, Habib N, Hsu PD, Wu X, Jiang W, Marraffini LA, et al. (2013). Multiplex genome engineering using CRISPR/Cas systems. Science 339, 819–823. [DOI] [PMC free article] [PubMed] [Google Scholar]
- Curtis C, Shah SP, Chin SF, Turashvili G, Rueda OM, Dunning MJ, Speed D, Lynch AG, Samarajiwa S, Yuan Y, et al. (2012). The genomic and transcriptomic architecture of 2,000 breast tumours reveals novel subgroups. Nature 486, 346–352. [DOI] [PMC free article] [PubMed] [Google Scholar]
- Deans RM, Morgens DW, Okesli A, Pillay S, Horlbeck MA, Kampmann M, Gilbert LA, Li A, Mateo R, Smith M, et al. (2016). Parallel shRNA and CRISPR-Cas9 screens enable antiviral drug target identification. Nature chemical biology 12, 361–366. [DOI] [PMC free article] [PubMed] [Google Scholar]
- Dewaele M, Tabaglio T, Willekens K, Bezzi M, Teo SX, Low DH, Koh CM, Rambow F, Fiers M, Rogiers A, et al. (2016). Antisense oligonucleotide-mediated MDM4 exon 6 skipping impairs tumor growth. The Journal of clinical investigation 126, 68–84. [DOI] [PMC free article] [PubMed] [Google Scholar]
- Dobin A, Davis CA, Schlesinger F, Drenkow J, Zaleski C, Jha S, Batut P, Chaisson M, and Gingeras TR (2013). STAR: ultrafast universal RNA-seq aligner. Bioinformatics 29, 15–21. [DOI] [PMC free article] [PubMed] [Google Scholar]
- DuPage M, Dooley AL, and Jacks T (2009). Conditional mouse lung cancer models using adenoviral or lentiviral delivery of Cre recombinase. Nature protocols 4, 1064–1072. [DOI] [PMC free article] [PubMed] [Google Scholar]
- Escobar-Hoyos LF, Penson A, Kannan R, Cho H, Pan CH, Singh RK, Apken LH, Hobbs GA, Luo R, Lecomte N, et al. (2020). Altered RNA Splicing by Mutant p53 Activates Oncogenic RAS Signaling in Pancreatic Cancer. Cancer cell 38, 198–211 e198. [DOI] [PMC free article] [PubMed] [Google Scholar]
- Feldser DM, Kostova KK, Winslow MM, Taylor SE, Cashman C, Whittaker CA, Sanchez-Rivera FJ, Resnick R, Bronson R, Hemann MT, et al. (2010). Stage-specific sensitivity to p53 restoration during lung cancer progression. Nature 468, 572–575. [DOI] [PMC free article] [PubMed] [Google Scholar]
- Fong JY, Pignata L, Goy PA, Kawabata KC, Lee SC, Koh CM, Musiani D, Massignani E, Kotini AG, Penson A, et al. (2019). Therapeutic Targeting of RNA Splicing Catalysis through Inhibition of Protein Arginine Methylation. Cancer cell 36, 194–209 e199. [DOI] [PMC free article] [PubMed] [Google Scholar]
- Gao J, Aksoy BA, Dogrusoz U, Dresdner G, Gross B, Sumer SO, Sun Y, Jacobsen A, Sinha R, Larsson E, et al. (2013). Integrative analysis of complex cancer genomics and clinical profiles using the cBioPortal. Sci Signal 6, pl1. [DOI] [PMC free article] [PubMed] [Google Scholar]
- Giglio S, Mancini F, Pellegrino M, Di Conza G, Puxeddu E, Sacchi A, Pontecorvi A, and Moretti F (2010). Regulation of MDM4 (MDMX) function by p76(MDM2): a new facet in the control of p53 activity. Oncogene 29, 5935–5945. [DOI] [PubMed] [Google Scholar]
- Han K, Jeng EE, Hess GT, Morgens DW, Li A, and Bassik MC (2017). Synergistic drug combinations for cancer identified in a CRISPR screen for pairwise genetic interactions. Nature biotechnology 35, 463–474. [DOI] [PMC free article] [PubMed] [Google Scholar]
- Hess GT, Fresard L, Han K, Lee CH, Li A, Cimprich KA, Montgomery SB, and Bassik MC (2016). Directed evolution using dCas9-targeted somatic hypermutation in mammalian cells. Nature methods 13, 1036–1042. [DOI] [PMC free article] [PubMed] [Google Scholar]
- Huang CH, Lujambio A, Zuber J, Tschaharganeh DF, Doran MG, Evans MJ, Kitzing T, Zhu N, de Stanchina E, Sawyers CL, et al. (2014). CDK9-mediated transcription elongation is required for MYC addiction in hepatocellular carcinoma. Genes & development 28, 1800–1814. [DOI] [PMC free article] [PubMed] [Google Scholar]
- Israeli D, Tessler E, Haupt Y, Elkeles A, Wilder S, Amson R, Telerman A, and Oren M (1997). A novel p53-inducible gene, PAG608, encodes a nuclear zinc finger protein whose overexpression promotes apoptosis. The EMBO journal 16, 4384–4392. [DOI] [PMC free article] [PubMed] [Google Scholar]
- Jackson EL, Willis N, Mercer K, Bronson RT, Crowley D, Montoya R, Jacks T, and Tuveson DA (2001). Analysis of lung tumor initiation and progression using conditional expression of oncogenic K-ras. Genes & development 15, 3243–3248. [DOI] [PMC free article] [PubMed] [Google Scholar]
- Janic A, Valente LJ, Wakefield MJ, Di Stefano L, Milla L, Wilcox S, Yang H, Tai L, Vandenberg CJ, Kueh AJ, et al. (2018). DNA repair processes are critical mediators of p53-dependent tumor suppression. Nature medicine 24, 947–953. [DOI] [PubMed] [Google Scholar]
- Jiang D, Brady CA, Johnson TM, Lee EY, Park EJ, Scott MP, and Attardi LD (2011). Full p53 transcriptional activation potential is dispensable for tumor suppression in diverse lineages. Proceedings of the National Academy of Sciences of the United States of America 108, 17123–17128. [DOI] [PMC free article] [PubMed] [Google Scholar]
- Johnson JL, Monfregola J, Napolitano G, Kiosses WB, and Catz SD (2012). Vesicular trafficking through cortical actin during exocytosis is regulated by the Rab27a effector JFC1/Slp1 and the RhoA-GTPase-activating protein Gem-interacting protein. Mol Biol Cell 23, 1902–1916. [DOI] [PMC free article] [PubMed] [Google Scholar]
- Johnson L, Mercer K, Greenbaum D, Bronson RT, Crowley D, Tuveson DA, and Jacks T (2001). Somatic activation of the K-ras oncogene causes early onset lung cancer in mice. Nature 410, 1111–1116. [DOI] [PubMed] [Google Scholar]
- Jung J, Nayak A, Schaeffer V, Starzetz T, Kirsch AK, Muller S, Dikic I, Mittelbronn M, and Behrends C (2017). Multiplex image-based autophagy RNAi screening identifies SMCR8 as ULK1 kinase activity and gene expression regulator. eLife 6. [DOI] [PMC free article] [PubMed] [Google Scholar]
- Kampmann M, Horlbeck MA, Chen Y, Tsai JC, Bassik MC, Gilbert LA, Villalta JE, Kwon SC, Chang H, Kim VN, et al. (2015). Next-generation libraries for robust RNA interference-based genome-wide screens. Proceedings of the National Academy of Sciences of the United States of America 112, E3384–3391. [DOI] [PMC free article] [PubMed] [Google Scholar]
- Kandoth C, McLellan MD, Vandin F, Ye K, Niu B, Lu C, Xie M, Zhang Q, McMichael JF, Wyczalkowski MA, et al. (2013). Mutational landscape and significance across 12 major cancer types. Nature 502, 333–339. [DOI] [PMC free article] [PubMed] [Google Scholar]
- Kemmerer K, Fischer S, and Weigand JE (2018). Auto- and cross-regulation of the hnRNPs D and DL. RNA 24, 324–331. [DOI] [PMC free article] [PubMed] [Google Scholar]
- Kenzelmann Broz D, Spano Mello S, Bieging KT, Jiang D, Dusek RL, Brady CA, Sidow A, and Attardi LD (2013). Global genomic profiling reveals an extensive p53-regulated autophagy program contributing to key p53 responses. Genes & development 27, 1016–1031. [DOI] [PMC free article] [PubMed] [Google Scholar]
- Kuleshov MV, Jones MR, Rouillard AD, Fernandez NF, Duan Q, Wang Z, Koplev S, Jenkins SL, Jagodnik KM, Lachmann A, et al. (2016). Enrichr: a comprehensive gene set enrichment analysis web server 2016 update. Nucleic acids research 44, W90–97. [DOI] [PMC free article] [PubMed] [Google Scholar]
- Kunzli K, Favre B, Chofflon M, and Borradori L (2016). One gene but different proteins and diseases: the complexity of dystonin and bullous pemphigoid antigen 1. Exp Dermatol 25, 10–16. [DOI] [PubMed] [Google Scholar]
- Kurosaki T, Popp MW, and Maquat LE (2019). Quality and quantity control of gene expression by nonsense-mediated mRNA decay. Nat Rev Mol Cell Biol 20, 406–420. [DOI] [PMC free article] [PubMed] [Google Scholar]
- Langmead B, Trapnell C, Pop M, and Salzberg SL (2009). Ultrafast and memory-efficient alignment of short DNA sequences to the human genome. Genome biology 10, R25. [DOI] [PMC free article] [PubMed] [Google Scholar]
- Lee KH, Li M, Michalowski AM, Zhang X, Liao H, Chen L, Xu Y, Wu X, and Huang J (2010). A genomewide study identifies the Wnt signaling pathway as a major target of p53 in murine embryonic stem cells. Proceedings of the National Academy of Sciences of the United States of America 107, 69–74. [DOI] [PMC free article] [PubMed] [Google Scholar]
- Lee T, and Pelletier J (2016). The biology of DHX9 and its potential as a therapeutic target. Oncotarget 7, 42716–42739. [DOI] [PMC free article] [PubMed] [Google Scholar]
- Lewis BP, Green RE, and Brenner SE (2003). Evidence for the widespread coupling of alternative splicing and nonsense-mediated mRNA decay in humans. Proceedings of the National Academy of Sciences of the United States of America 100, 189–192. [DOI] [PMC free article] [PubMed] [Google Scholar]
- Li M, He Y, Dubois W, Wu X, Shi J, and Huang J (2012a). Distinct regulatory mechanisms and functions for p53-activated and p53-repressed DNA damage response genes in embryonic stem cells. Molecular cell 46, 30–42. [DOI] [PMC free article] [PubMed] [Google Scholar]
- Li T, Kon N, Jiang L, Tan M, Ludwig T, Zhao Y, Baer R, and Gu W (2012b). Tumor suppression in the absence of p53-mediated cell-cycle arrest, apoptosis, and senescence. Cell 149, 1269–1283. [DOI] [PMC free article] [PubMed] [Google Scholar]
- Liao Y, Smyth GK, and Shi W (2014). featureCounts: an efficient general purpose program for assigning sequence reads to genomic features. Bioinformatics 30, 923–930. [DOI] [PubMed] [Google Scholar]
- Love MI, Huber W, and Anders S (2014). Moderated estimation of fold change and dispersion for RNA-seq data with DESeq2. Genome biology 15, 550. [DOI] [PMC free article] [PubMed] [Google Scholar]
- Lowe SW, Jacks T, Housman DE, and Ruley HE (1994). Abrogation of oncogene-associated apoptosis allows transformation of p53-deficient cells. Proceedings of the National Academy of Sciences of the United States of America 91, 2026–2030. [DOI] [PMC free article] [PubMed] [Google Scholar]
- Madisen L, Zwingman TA, Sunkin SM, Oh SW, Zariwala HA, Gu H, Ng LL, Palmiter RD, Hawrylycz MJ, Jones AR, et al. (2010). A robust and high-throughput Cre reporting and characterization system for the whole mouse brain. Nature neuroscience 13, 133–140. [DOI] [PMC free article] [PubMed] [Google Scholar]
- Marine JC, Francoz S, Maetens M, Wahl G, Toledo F, and Lozano G (2006). Keeping p53 in check: essential and synergistic functions of Mdm2 and Mdm4. Cell death and differentiation 13, 927–934. [DOI] [PubMed] [Google Scholar]
- Martin M (2011). Cutadapt Removes Adapter Sequences From High-Throughput Sequencing Reads. EMBnetjournal 17, 10–12. [Google Scholar]
- Mayakonda A.a.K., P.H. (2016). Maftools: Efficient analysis, visualization, and summarization of MAF files from large-scale cohort based cancer studies. BioRxiv. [Google Scholar]
- McIlwain DR, Pan Q, Reilly PT, Elia AJ, McCracken S, Wakeham AC, Itie-Youten A, Blencowe BJ, and Mak TW (2010). Smg1 is required for embryogenesis and regulates diverse genes via alternative splicing coupled to nonsense-mediated mRNA decay. Proceedings of the National Academy of Sciences of the United States of America 107, 12186–12191. [DOI] [PMC free article] [PubMed] [Google Scholar]
- Mello SS, and Attardi LD (2018). Deciphering p53 signaling in tumor suppression. Current opinion in cell biology 51, 65–72. [DOI] [PMC free article] [PubMed] [Google Scholar]
- Mello SS, Valente LJ, Raj N, Seoane JA, Flowers BM, McClendon J, Bieging-Rolett KT, Lee J, Ivanochko D, Kozak MM, et al. (2017). A p53 Super-tumor Suppressor Reveals a Tumor Suppressive p53-Ptpn14-Yap Axis in Pancreatic Cancer. Cancer cell 32, 460–473 e466. [DOI] [PMC free article] [PubMed] [Google Scholar]
- Mendez-Vidal C, Wilhelm MT, Hellborg F, Qian W, and Wiman KG (2002). The p53-induced mouse zinc finger protein wig-1 binds double-stranded RNA with high affinity. Nucleic acids research 30, 1991–1996. [DOI] [PMC free article] [PubMed] [Google Scholar]
- Meyers RM, Bryan JG, McFarland JM, Weir BA, Sizemore AE, Xu H, Dharia NV, Montgomery PG, Cowley GS, Pantel S, et al. (2017). Computational correction of copy number effect improves specificity of CRISPR-Cas9 essentiality screens in cancer cells. Nature genetics 49, 1779–1784. [DOI] [PMC free article] [PubMed] [Google Scholar]
- Milgrom-Hoffman M, and Humbert PO (2018). Regulation of cellular and PCP signalling by the Scribble polarity module. Semin Cell Dev Biol 81, 33–45. [DOI] [PubMed] [Google Scholar]
- Moon SH, Huang CH, Houlihan SL, Regunath K, Freed-Pastor WA, Morris J.P.t., Tschaharganeh DF, Kastenhuber ER, Barsotti AM, Culp-Hill R, et al. (2019a). p53 Represses the Mevalonate Pathway to Mediate Tumor Suppression. Cell 176, 564–580.e519. [DOI] [PMC free article] [PubMed] [Google Scholar]
- Moon SH, Huang CH, Houlihan SL, Regunath K, Freed-Pastor WA, Morris J.P.t., Tschaharganeh DF, Kastenhuber ER, Barsotti AM, Culp-Hill R, et al. (2019b). p53 Represses the Mevalonate Pathway to Mediate Tumor Suppression. Cell 176, 564–580 e519. [DOI] [PMC free article] [PubMed] [Google Scholar]
- Morgens DW, Deans RM, Li A, and Bassik MC (2016). Systematic comparison of CRISPR/Cas9 and RNAi screens for essential genes. Nature biotechnology 34, 634–636. [DOI] [PMC free article] [PubMed] [Google Scholar]
- Morgens DW, Wainberg M, Boyle EA, Ursu O, Araya CL, Tsui CK, Haney MS, Hess GT, Han K, Jeng EE, et al. (2017). Genome-scale measurement of off-target activity using Cas9 toxicity in high-throughput screens. Nature communications 8, 15178. [DOI] [PMC free article] [PubMed] [Google Scholar]
- Obeng EA, Stewart C, and Abdel-Wahab O (2019). Altered RNA Processing in Cancer Pathogenesis and Therapy. Cancer discovery 9, 1493–1510. [DOI] [PMC free article] [PubMed] [Google Scholar]
- Oppenheimer L, Wellner VP, Griffith OW, and Meister A (1979). Glutathione synthetase. Purification from rat kidney and mapping of the substrate binding sites. The Journal of biological chemistry 254, 5184–5190. [PubMed] [Google Scholar]
- Park JW, Tokheim C, Shen S, and Xing Y (2013). Identifying differential alternative splicing events from RNA sequencing data using RNASeq-MATS. Methods Mol Biol 1038, 171–179. [DOI] [PubMed] [Google Scholar]
- Pereira B, Chin SF, Rueda OM, Vollan HK, Provenzano E, Bardwell HA, Pugh M, Jones L, Russell R, Sammut SJ, et al. (2016). The somatic mutation profiles of 2,433 breast cancers refines their genomic and transcriptomic landscapes. Nature communications 7, 11479. [DOI] [PMC free article] [PubMed] [Google Scholar]
- Perry ME, Mendrysa SM, Saucedo LJ, Tannous P, and Holubar M (2000). p76(MDM2) inhibits the ability of p90(MDM2) to destabilize p53. The Journal of biological chemistry 275, 5733–5738. [DOI] [PubMed] [Google Scholar]
- Rogers ZN, McFarland CD, Winters IP, Naranjo S, Chuang CH, Petrov D, and Winslow MM (2017). A quantitative and multiplexed approach to uncover the fitness landscape of tumor suppression in vivo. Nature methods 14, 737–742. [DOI] [PMC free article] [PubMed] [Google Scholar]
- Sakamuro D, Elliott KJ, Wechsler-Reya R, and Prendergast GC (1996). BIN1 is a novel MYC-interacting protein with features of a tumour suppressor. Nature genetics 14, 69–77. [DOI] [PubMed] [Google Scholar]
- Scheffler B, Walton NM, Lin DD, Goetz AK, Enikolopov G, Roper SN, and Steindler DA (2005). Phenotypic and functional characterization of adult brain neuropoiesis. Proceedings of the National Academy of Sciences of the United States of America 102, 9353–9358. [DOI] [PMC free article] [PubMed] [Google Scholar]
- Schroder MS, Culhane AC, Quackenbush J, and Haibe-Kains B (2011). survcomp: an R/Bioconductor package for performance assessment and comparison of survival models. Bioinformatics 27, 3206–3208. [DOI] [PMC free article] [PubMed] [Google Scholar]
- Schwenk F, Baron U, and Rajewsky K (1995). A cre-transgenic mouse strain for the ubiquitous deletion of loxP-flanked gene segments including deletion in germ cells. Nucleic acids research 23, 5080–5081. [DOI] [PMC free article] [PubMed] [Google Scholar]
- Sibley CR, Blazquez L, and Ule J (2016). Lessons from non-canonical splicing. Nature reviews Genetics 17, 407–421. [DOI] [PMC free article] [PubMed] [Google Scholar]
- Toledo F, and Wahl GM (2006). Regulating the p53 pathway: in vitro hypotheses, in vivo veritas. Nature reviews Cancer 6, 909–923. [DOI] [PubMed] [Google Scholar]
- Tonelli C, Morelli MJ, Bianchi S, Rotta L, Capra T, Sabo A, Campaner S, and Amati B (2015). Genome-wide analysis of p53 transcriptional programs in B cells upon exposure to genotoxic stress in vivo. Oncotarget 6, 24611–24626. [DOI] [PMC free article] [PubMed] [Google Scholar]
- Tschaharganeh DF, Xue W, Calvisi DF, Evert M, Michurina TV, Dow LE, Banito A, Katz SF, Kastenhuber ER, Weissmueller S, et al. (2014). p53-dependent Nestin regulation links tumor suppression to cellular plasticity in liver cancer. Cell 158, 579–592. [DOI] [PMC free article] [PubMed] [Google Scholar]
- Ule J, and Blencowe BJ (2019). Alternative Splicing Regulatory Networks: Functions, Mechanisms, and Evolution. Molecular cell 76, 329–345. [DOI] [PubMed] [Google Scholar]
- Valente LJ, Gray DH, Michalak EM, Pinon-Hofbauer J, Egle A, Scott CL, Janic A, and Strasser A (2013). p53 efficiently suppresses tumor development in the complete absence of its cell-cycle inhibitory and proapoptotic effectors p21, Puma, and Noxa. Cell reports 3, 1339–1345. [DOI] [PubMed] [Google Scholar]
- Van Nostrand EL, Pratt GA, Shishkin AA, Gelboin-Burkhart C, Fang MY, Sundararaman B, Blue SM, Nguyen TB, Surka C, Elkins K, et al. (2016). Robust transcriptome-wide discovery of RNA-binding protein binding sites with enhanced CLIP (eCLIP). Nature methods 13, 508–514. [DOI] [PMC free article] [PubMed] [Google Scholar]
- Van Nostrand EL, Pratt GA, Yee BA, Wheeler E, Blue SM, Mueller J, Park SS, Garcia KE, Gelboin-Brukhart C, Nguyen TB, Rabano I, Stanton R, Sundararaman B, Wang R, Fu X-D, Graveley BR, Yeo GW (2019). Principles of RNA processing from analysis of enhanced CLIP maps for 150 RNA binding proteins. bioRxiv. [DOI] [PMC free article] [PubMed] [Google Scholar]
- Varmeh-Ziaie S, Okan I, Wang Y, Magnusson KP, Warthoe P, Strauss M, and Wiman KG (1997). Wig-1, a new p53-induced gene encoding a zinc finger protein. Oncogene 15, 2699–2704. [DOI] [PubMed] [Google Scholar]
- Vilborg A, Glahder JA, Wilhelm MT, Bersani C, Corcoran M, Mahmoudi S, Rosenstierne M, Grander D, Farnebo M, Norrild B, et al. (2009). The p53 target Wig-1 regulates p53 mRNA stability through an AU-rich element. Proceedings of the National Academy of Sciences of the United States of America 106, 15756–15761. [DOI] [PMC free article] [PubMed] [Google Scholar]
- Vousden KH, and Prives C (2009). Blinded by the Light: The Growing Complexity of p53. Cell 137, 413–431. [DOI] [PubMed] [Google Scholar]
- Wang L, Brooks AN, Fan J, Wan Y, Gambe R, Li S, Hergert S, Yin S, Freeman SS, Levin JZ, et al. (2016). Transcriptomic Characterization of SF3B1 Mutation Reveals Its Pleiotropic Effects in Chronic Lymphocytic Leukemia. Cancer cell 30, 750–763. [DOI] [PMC free article] [PubMed] [Google Scholar]
- Wang Y, Ji T, Nelson AD, Glanowska K, Murphy GG, Jenkins PM, and Parent JM (2018). Critical roles of alphaII spectrin in brain development and epileptic encephalopathy. The Journal of clinical investigation 128, 760–773. [DOI] [PMC free article] [PubMed] [Google Scholar]
- Wilhelm MT, Mendez-Vidal C, and Wiman KG (2002). Identification of functional p53-binding motifs in the mouse wig-1 promoter. FEBS letters 524, 69–72. [DOI] [PubMed] [Google Scholar]
- Yoshimura S, Gerondopoulos A, Linford A, Rigden DJ, and Barr FA (2010). Family-wide characterization of the DENN domain Rab GDP-GTP exchange factors. The Journal of cell biology 191, 367–381. [DOI] [PMC free article] [PubMed] [Google Scholar]
- Younger ST, Kenzelmann-Broz D, Jung H, Attardi LD, and Rinn JL (2015). Integrative genomic analysis reveals widespread enhancer regulation by p53 in response to DNA damage. Nucleic acids research 43, 4447–4462. [DOI] [PMC free article] [PubMed] [Google Scholar]
- Zhang J, Lieu YK, Ali AM, Penson A, Reggio KS, Rabadan R, Raza A, Mukherjee S, and Manley JL (2015). Disease-associated mutation in SRSF2 misregulates splicing by altering RNA-binding affinities. Proceedings of the National Academy of Sciences of the United States of America 112, E4726–4734. [DOI] [PMC free article] [PubMed] [Google Scholar]
- Zhang J, and Manley JL (2013). Misregulation of pre-mRNA alternative splicing in cancer. Cancer discovery 3, 1228–1237. [DOI] [PMC free article] [PubMed] [Google Scholar]
Associated Data
This section collects any data citations, data availability statements, or supplementary materials included in this article.
Supplementary Materials
Supplemental Table 4: ZMAT3 binding peaks. (Related to Figure 6). ZMAT3 binding peaks from eCLIP data are reported for 3 samples (sgNC1, sgNC2, sgNC3) normalized to the Zmat3 knockout sample and normalized to the input sample.
Supplemental Table 5: Differentially expressed genes in Zmat3-deficient versus negative control MEFs (Related to Figure 6). Gene list was generated by comparison of RNA-seq data from three E1A;HrasG12V;Cas9 MEF lines transduced with lentiviruses expressing unique Zmat3 sgRNAs and three E1A;HrasG12V;Cas9 MEF lines transduced with lentiviruses expressing unique NC sgRNAs (FDR<0.05).
Supplemental Table 6: rMATs analysis of differential splicing events in Zmat3-deficient versus negative control MEFs (Related to Figure 6). Sample 1 is based on three E1A;HrasG12V;Cas9 MEF lines transduced with lentiviruses expressing unique Zmat3 sgRNAs and sample 2 is based on three E1A;HrasG12V;Cas9 MEF lines transduced with lentiviruses expressing unique NC sgRNAs.
Data Availability Statement
The microarray data were published previously (Brady et al., 2011) and are available in the Gene Expression Omnibus (GSE27901). The mouse and human ChIP-seq data were also published previously (Kenzelmann Broz et al., 2013; Younger et al., 2015) and are available in the Gene Expression Omnibus (GSE46240, GSE55727). The human cancer data that support the findings of this study are available from the Genomic Data Commons, https://gdc.cancer.gov, and the European Genome-Phenome Archive, https://ega-archive.org/dacs/EGAC00001000484. The Achilles DepMap dataset (CCLE_Depmap_18q3 release) is available from the DepMap portal, https://depmap.org/portal/download/. The Zmat3 RNA-seq (GSE145430) and eCLIP data (GSE14555) have been submitted to the Gene Expression Omnibus and will be made publicly available upon publication of the manuscript. Scripts for version 1.0 of casTLE (Morgens et al., 2016) are available at https://bitbucket.org/dmorgens/castle.