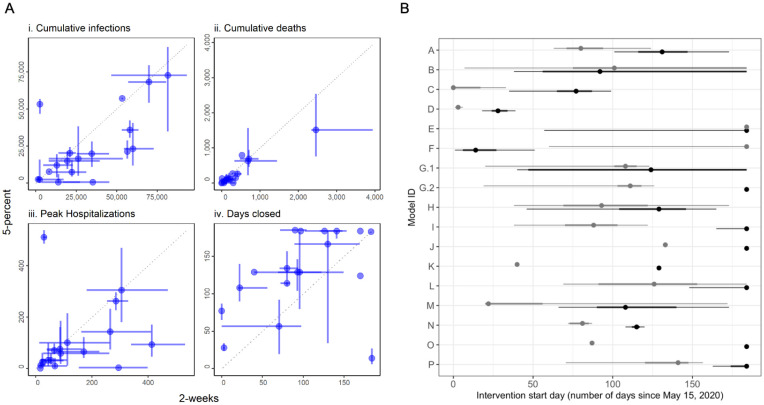
Fig. 4: Comparison between the 2-week and 5-percent interventions.
A) Medians (points) and 50% PIs (lines) displayed pairwise by intervention and for the following objectives: i) cumulative infections, ii) cumulative deaths, iii) peak hospitalizations, and iv) days closed for each model. B) Comparison of intervention start dates for 2-week (grey) vs. 5-percent (black) interventions for each model, where the start date is computed as the number of days from May 15 until the intervention is enacted. Intervention start times of 184 days indicate that the intervention was never triggered in that model. All plots display median (points) and 5th to 95th quantiles (lines) for each intervention. The 2-week intervention trigger to open is the first day for which the 7-day trailing moving average of the number of new daily reported cases has been lower than the maximum for at least 14 days, and has shown a day-to-day decline in smoothed case data for at least 10 of the last 14 days (or, there have been 7 days without any new cases). The 5-percent intervention trigger to open is the first day for which the 7-day trailing moving average of the number of new daily reported cases drops below 5% of the maximum.

