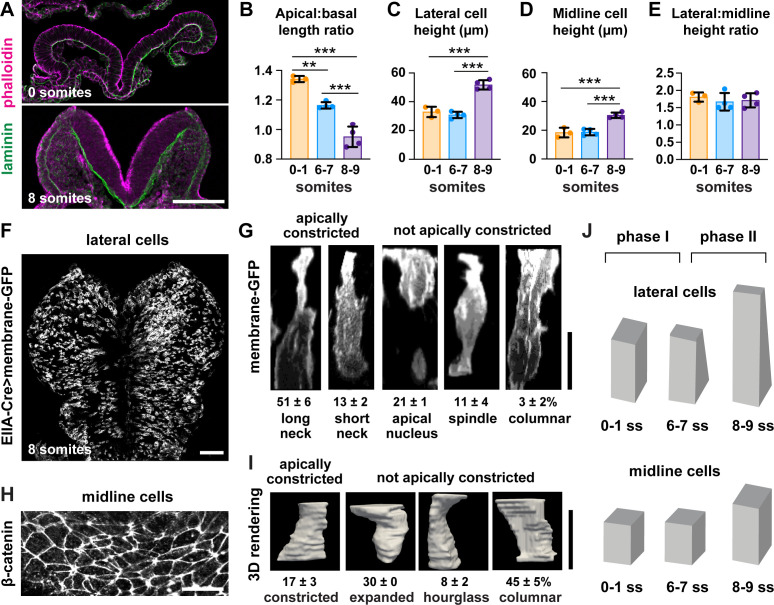
Figure 3. Lateral cells, but not midline cells, apically constrict.
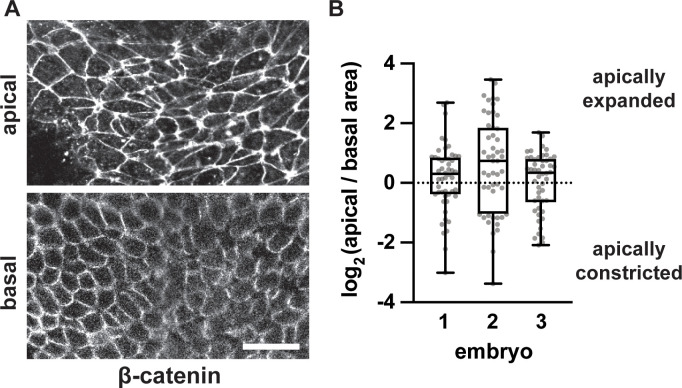
(A) Transverse sections of the cranial neural plate. Phalloidin and laminin show the apical and basal surfaces of the neuroepithelium, respectively. (B) The ratio of the apical span to the basal span of the neural plate decreases during elevation, flipping the cranial neural plate from convex (>1) to concave (<1). (C–E) Cell height in lateral (C) and midline (D) regions increases after the seven somite stage, but the ratio (E) does not change. (F) Mosaic expression of membrane-GFP using the EIIA-Cre driver. (G) 3D projections of membrane-GFP signal from individual lateral cells. (H) Midline cells labeled with β-catenin. (I) 3D surface renderings of manually segmented midline cells. (J) Midbrain neural fold elevation occurs in two phases. Early elevation (0–6 somites) is driven by apical constriction in lateral cells without a change in cell height. At later stages (7–9 somites), both midline and lateral cells undergo significant apicobasal cell elongation. A single value was obtained for each embryo and the mean ± SD between embryos is shown, n = 3–4 embryos/stage in (B–E), 408 cells in three embryos in (G), 60 cells in three embryos in (I), **p<0.01, ***p<0.001 (one-way ANOVA test). See Supplementary file 1 for n and p values. Apical up in (A), (G), and (I), anterior up in (F) and (H). Bars, 100 μm (A,F), 20 μm (G–I).
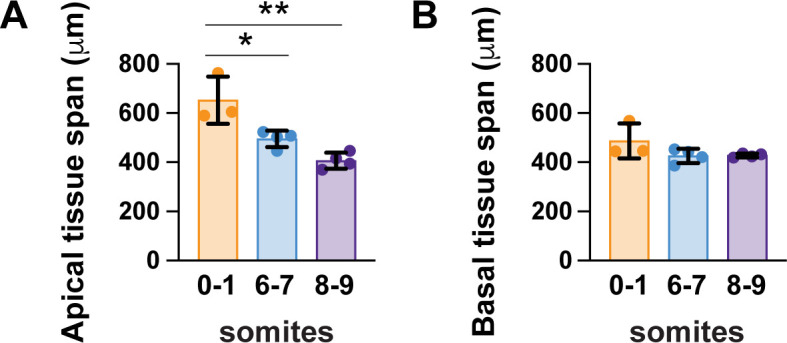
Figure 3—figure supplement 1. The cranial neural plate transitions from convex to concave during elevation.


