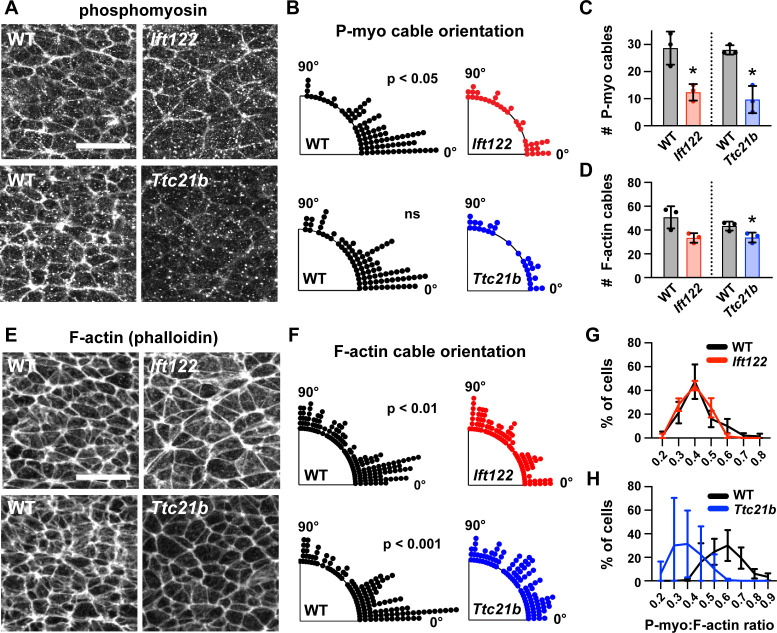
Figure 6. Actomyosin organization is disrupted in IFT-A mutants.
(A,E) Localization of phosphorylated myosin II (phosphomyosin) (A) and F-actin (E) in lateral cells of Ift122 and Ttc21b mutants and wild-type littermate controls (WT). (B,F) Orientation of apical phosphomyosin (P-myo) cables (B) and F-actin cables (F) in Ift122 and Ttc21b mutants and WT controls. (C,D) The number of phosphomyosin cables (C) and F-actin cables (D) per embryo in two 100 μm x 100 μm lateral regions in Ift122 and Ttc21b mutants. (G,H) The ratio of phosphomyosin to F-actin at cell-cell junctions was shifted to lower values in Ttc21b mutants. A single value was obtained from each embryo and the mean ± SD between embryos is shown, n = 29–86 phosphomyosin cables and 100–151 F-actin cables from three embryos/genotype in (A–F), 50 cells from three embryos/genotype (G,H), *p<0.05, Welch’s t-test in (C,D), Watson two-sample test for homogeneity (B,F). See Supplementary file 1 for n and p values. Embryos are 7-8 somites. Anterior up. Bars, 20 μm.

