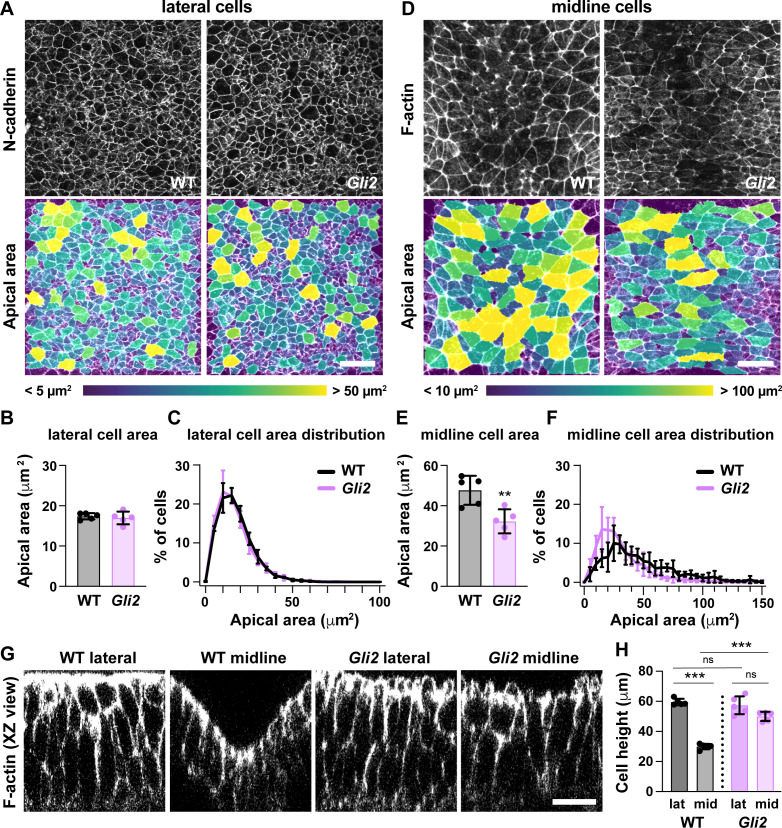
Figure 8. Loss of Gli2 disrupts midline but not lateral cell shape.
(A,D) Lateral (A) and midline (D) cells in Gli2 mutant embryos and wild-type littermate controls (WT). Cells are labeled with N-cadherin or phalloidin (top) and color coded by apical area (bottom). (B,C,E,F) Average apical cell area (B,E) and apical area distributions (C,F) of lateral and midline cells from WT and Gli2 mutant embryos. (G) XZ reconstructions of lateral and midline cells labeled with F-actin in WT and Gli2 mutant embryos. (H) Cell height in lateral and midline cells in WT and Gli2 mutant embryos. A single value was obtained for each embryo and the mean ± SD is shown. n = 5 embryos/genotype, **p<0.01, ***p<0.001, Welch’s t-test (B,E) or Brown-Forsythe one-way ANOVA test (H). See Supplementary file 1 for n and p values. Embryos are 7–9 somites. Anterior up in (A,D), apical up in (G). Bars, 20 μm.


