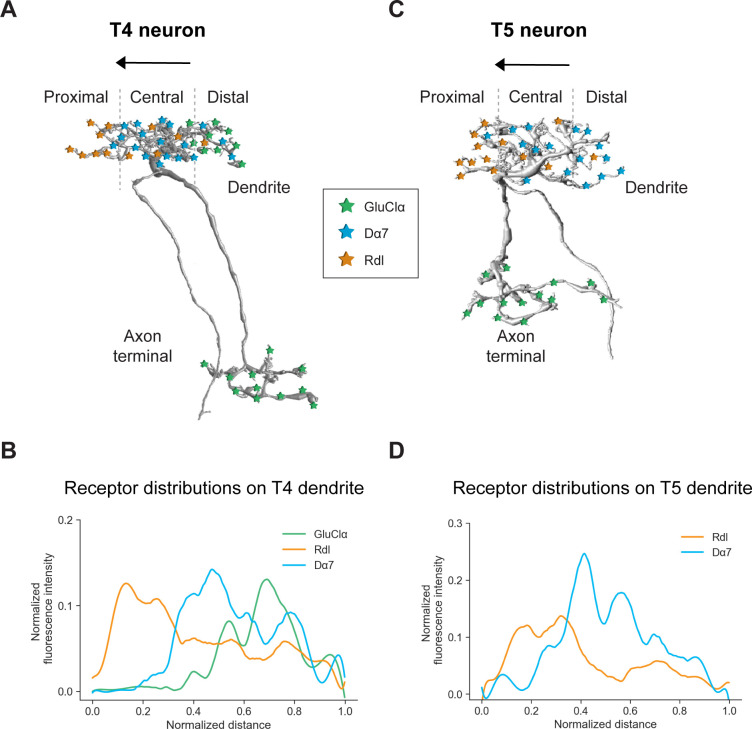
Figure 7. Summary of the receptor distributions of GluClα, Rdl and Dα7 in T4 and T5 neurons.
(A) Scheme of EM-reconstructed T4 neuron with distribution of receptors on dendrite and axon terminal (image extracted from Seven medulla column connectome dataset, https://emdata.janelia.org/#/repo/medulla7column, #3b548, Janelia Research Campus). (B) Quantification of GluClα (green), Rdl (orange) and Dα7 (blue) distribution over the whole dendritic length (distance) averaged across several T4 from all subtypes (combined data from Figures 4D and 5D). All dendrites were aligned pointing to the right with the most proximal point at 0.0 and the most distal point at 1.0. (C) Scheme of EM-reconstructed T5 neuron with distribution of receptors on dendrite and axon terminal (image extracted from Seven medulla column connectome dataset, https://emdata.janelia.org/#/repo/medulla7column, #3b548, Janelia Research Campus). (D) Rdl (orange) and Dα7 (blue) distribution over the whole dendritic length (normalized distance) averaged across several T5 from all subtypes (combined data from Figures 3D and 4D). All dendrites were aligned pointing to the right with the most proximal point at 0.0 and the most distal point at 1.0.

