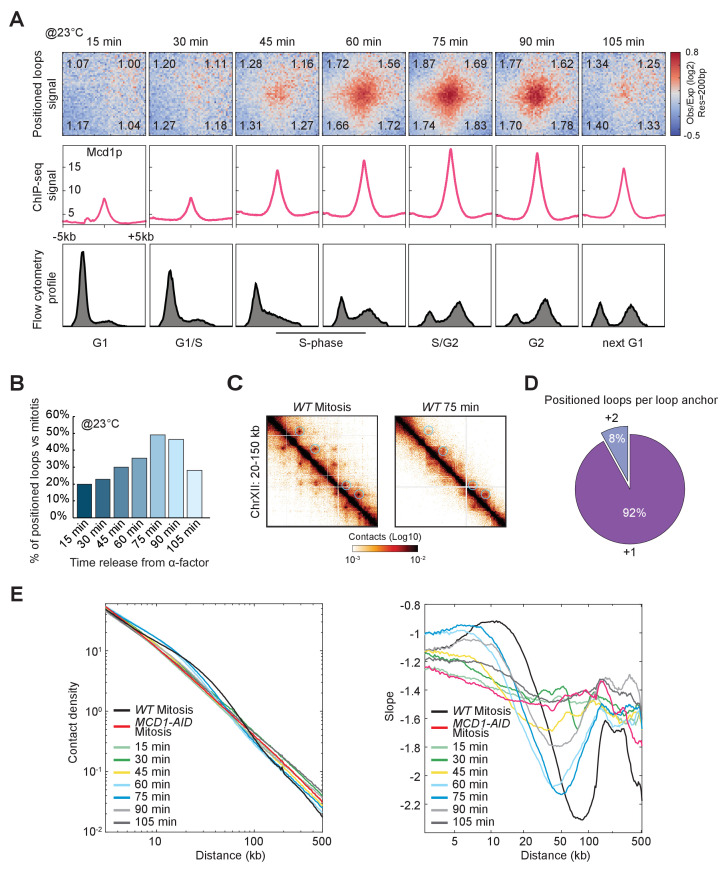
Figure 5. Chromatin loops are cell cycle dependent.
(A) Chromatin positioned loops emerge upon cohesin deposition during DNA replication. The figure shows Micro-C (top), Mcd1p ChIP-seq (middle), and Flow cytometry profile (bottom) data across a time course after release from G1 arrest (15 to 105 min). Heatmaps were plotted with 200 bp data resolution across a time course in ±5 kb regions surrounding the loop anchors identified in the mitotically arrested wild-type data. Average Mcd1p peak intensity was plotted across ±5 kb regions around the center of loop anchors at each time point. Flow cytometry of 20,000 cells per time point. (B) Loop formation peaks in G2 (75 min time point after G1 release). Bar chart represents the percentage of positioned loop detected at each time point compared to the number of positioned loops found upon mitotic arrest. (C) Positioned loops detected during the time course are less defined on the contact map. Snapshots for cells arrested in mitosis (left) and after 75 min release from G1 (right) represent the chromatin interaction in the 20–150 kb region of chromosome XII. Note that snapshot for the 75 min time point is in a higher color contrast for a better loop visualization. (D) Only a small subset of loop anchors form positioned loops with distal anchors at the 75 min time point. The pie chart shows the percentage of loop anchors that form positioned loops either with the corresponding neighboring anchors (+1) or with distal anchors (+2) in the 75 min time point. (E) Cohesin-dependent chromosome contacts peak at the same time points where positioned loops were detected. Interactions-versus-distance decaying curve shows the normalized contact density (y-axis) against the distance between the pair of crosslinked nucleosomes from 100 bp to 500 kb (x-axis) for wild-type (WT arrested in mitosis), Mcd1p-depleted (MCD1-AID arrested in mitosis), and cells from each time point of the time course. On the right, the derivative slopes for each data were plotted against the distance from 3 to 500 kb.


