. 2020 Nov 10;9:e59889. doi: 10.7554/eLife.59889

Figure 6. Wpl1p- and Pds5p-depletion perturb the looping pattern.

(A) Wpl1p-depletion causes excessive loop expansion on the contact map. Contact maps for WT (top) and WPL1-AID (bottom) show the chromatin interactions over the 200–450 kb region of chromosome X. Mcd1p ChIP-seq data for WT and WPL1-AID are overlaid across the same region. The scale for ChIP-seq is 0–200. (B) Wpl1p-depletion doubles the number of positioned loops detected. Bar chart shows the total number of positioned loops called by HiCCUPS in WT and WPL1-AID. (C) Genome-wide analysis confirms loop expansion upon Wpl1p-depletion. Bar chart shows the percentage of the number of positioned loops per anchor for WT (black) and WPL1-AID (green). (D) Wpl1p-depletion results in the expansion of the loop signal to further distal loop anchors. Heatmaps were plotted with 200 bp data for WT and WPL1-AID in ±5 kb regions surrounding the wild-type loop anchors and the corresponding CARs interval from a +1 to a +10. (E) Pds5p-depletion results in positioned loops between each centromere and surrounding CARs. Contact maps for WT (top) and PDS5-AID (bottom) shows the chromatin interactions over a chromosome arm on the 50–175 kb region of chromosome VII (left), and the centromeric region at 430–560 kb on chromosome VII (middle), or another centromeric region at 10–240 kb of chromosome XII (right). Mcd1p ChIP-seq data for WT and PDS5-AID are overlaid across the corresponding region in each panel. The scale for ChIP-seq is 0–400. (F) Pds5p-depletion results in loss of signal at wild-type anchors for positioned loops. Heatmaps were plotted with 200 bp data resolution for WT and PDS5-AID in ±5 kb regions surrounding the wild-type positioned loop anchors. (G) Pds5p-depletion causes cohesin depletion from chromosome arms, but not from pericentric regions. Average Mcd1p peak intensity for WT and PDS5-AID were plotted over ±5 kb regions around the peak center. Peaks were sorted into two groups: (1) peaks on the chromosome arms (>30 kb away from the centromeres) (left); (2) pericentric peaks (<30 kb away from the centromeres) (right).

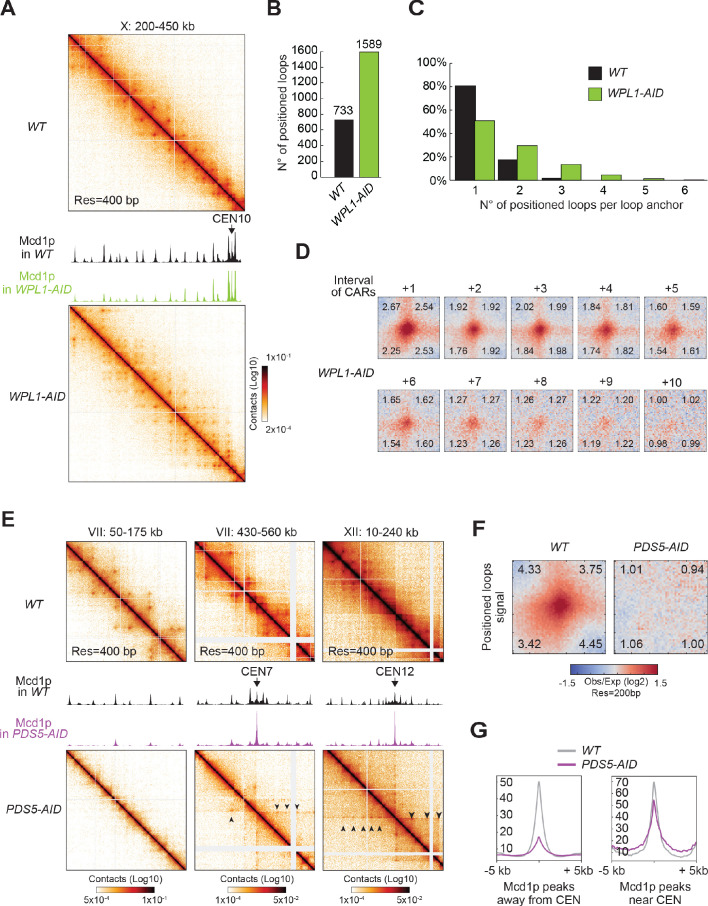
Figure 6.

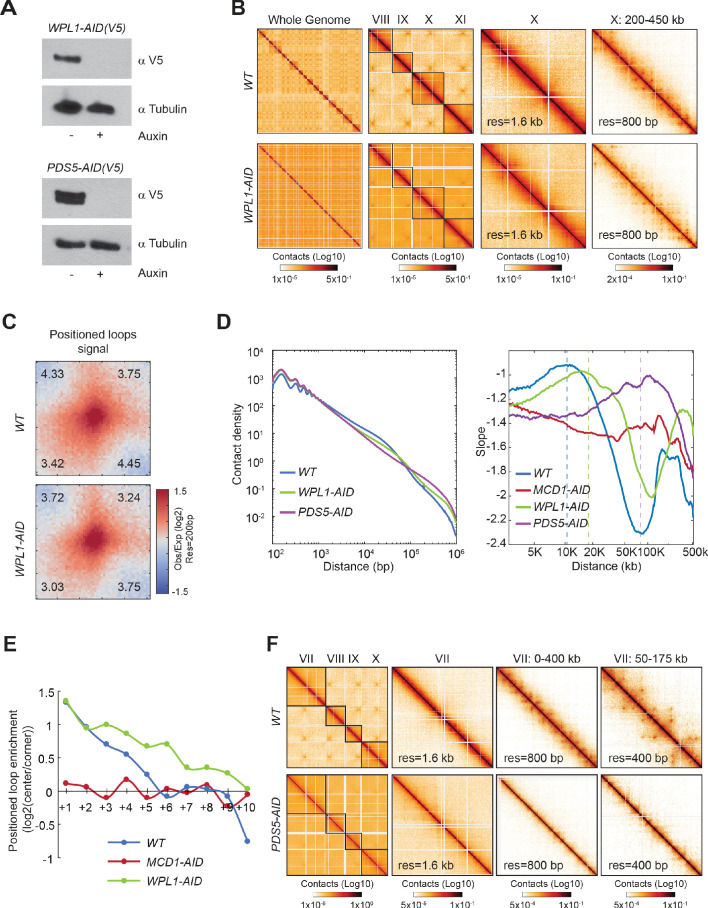
Figure 6—figure supplement 1. Wpl1p- and Pds5p-depletion alters the pattern of loops genome-wide.

Figure 6—figure supplement 1.

(A) Wpl1p and Pds5p are efficiently depleted upon auxin addition. The depletion of Wpl1p and Pds5p tagged with AID upon auxin addition to the media is shown by western-blot analysis. Tubulin is used for loading control. (B) Wpl1p-depleted cells present more loops and more loop expansion. Contact maps from mitotically arrested cells produced with Micro-C on wild-type (WT), cohesin Wpl1p-depleted (WPL1-AID). Contact maps show contacts between the whole genome (first column), followed by contacts from chromosomes VIII to XI at 6.4 kb resolution (second column). The following contact maps show chromosome X and a zoomed-in region (from the full 745 kb to a 250 kb region), with 1.6 kb and 800 bp resolution respectively. Standard colormap scheme that uses the shades of red from white (no detectable interactions) to black (maximum interactions detected) in log10 scale. (C) The loop signal at wild-type loops is still present upon Wpl1p-depletion. Heatmaps were plotted with 200 bp data resolution for wild-type (WT) and Wpl1p-depleted (Wpl1-AID) cells in ±5 kb regions surrounding the wild-type loop anchors. (D) Distribution of contacts upon Wpl1p-depletion and Pds5p-depletion. Interactions-versus-distance decaying curve shows the normalized contact density (y-axis) against the distance between the pair of crosslinked nucleosomes from 100 bp to 1 Mb (x-axis) for wild-type (WT in blue), Wpl1p-depleted (WPL1-AID in green), and Pds5p-depleted cells (PDS5-AID in purple) (left). Plot of the slopes derived from the interactions-versus-distance decaying curves for the same datasets along with Mcd1p-depleted cells (MCD1-AID in red) (right). The dotted line indicates the size of high contact enrichment (or the slowest contact decay with distance) for each strain. (E) Loop signal is detected till the +10 CARs interval upon Wpl1p-depletion. Quantification of the heatmap analysis in Figure 5D for Wpl1p-depleted (WPL1-AID in green) cells compared to wild-type (WT in blue) and cohesin-depleted (MCD1-AID in red). The chart shows the loop enrichment (Log2 of the ration of the loop signal in the center of the heatmap divided for the background signal in the corner) on the y-axis present at each CAR interval (x-axis). (F) Pds5p-depleted cells present no loops on chromosome arms. Contact maps from mitotically arrested cells produced with Micro-C on wild-type (WT), Pds5p-depleted (PDS5-AID). Contact maps show contacts between chromosomes VII to X at 6.4 kb resolution (first column). The following contact maps show chromosome VII and zoomed-in regions (from the full 1090 kb to a 125 kb region), from 1.6 kb to 400 bp resolution. Standard colormap scheme that uses the shades of red from white (no detectable interactions) to black (maximum interactions detected) in log10 scale.