

Abstract
Purpose
Patients with a hepatitis C virus (HCV) infection frequently exhibit various neuropsychiatric complications such as cognitive decline. This study is aimed at investigating alterations in regional and network-level neural function in patients with HCV infection and examining the association between these alterations and patients' cognition dysfunction.
Methods
The study included 17 patients with HCV infection and 17 healthy controls. These individuals had undergone resting-state functional magnetic resonance imaging as well as cognitive assessment using a battery of tests that were collectively called the “psychometric hepatic encephalopathy score (PHES)” examination. Analyses of amplitude of low-frequency fluctuation (ALFF) and seed-based functional connectivity (FC) were conducted to assess, respectively, regional neural function and functional integration.
Results
HCV-infected patients performed significantly worse in cognitive tests. In the HCV group, ALFF decreased in Region 1 (left medial frontal gyrus and bilateral anterior cingulate gyrus) and Region 2 (right middle and superior frontal gyrus). The HCV group showed lower FC between Region 1 and right middle frontal gyrus, whereas they presented an increase in FC between Region 2 and the left supramarginal gyrus/superior temporal gyrus and right supramarginal gyrus. No significant correlation was observed between ALFF/FC measurements and PHES result.
Conclusion
This preliminary study presents additional evidence that HCV infection affects brain function, including local intrinsic neural activity and global functional integration.
1. Introduction
There is increasing evidence that hepatitis C virus (HCV) infections not only cause hepatic symptoms but also directly affect the nervous system [1]. Recent studies have revealed the direct neuroinvasion of HCV based on the evidence of viral replication (reflected by replicative intermediate of HCV RNA and proteins) in the central nervous system [2]. Further evidence has demonstrated that human brain microvascular endothelial cells have functional receptors that support HCV tropism and replication, which in turn result in the apoptosis of these cells that consequently disrupt the blood-brain barrier [3]. Alterations in the blood-brain barrier then allow circulating inflammatory cytokines and chemokines to reach the brain, which subsequently contributes to the neurological disturbances [4].
In agreement with the evidences on HCV neuroinvasion, many HCV-infected patients (up to 50%) exhibit cognitive decline besides chronic fatigue and mood alterations [5]. There is increasing evidence of the negative impacts of HCV infection on cognitive functions such as attention and executive deficits, memory problems, and learning disability [6–9]. These cognitive declines in HCV-infected patients could severely affect an individual's social and physical activities, further influencing the quality of life of patients [4]. These cognitive dysfunctions are demonstrated to be associated with HCV infection-induced metabolic disorders (e.g., lower N-acetyl aspartate/creatine ratios involving the cerebral cortex and higher choline/creatine ratios in the basal ganglia and frontal white matter [8–10]), impairment of white matter microstructural integrity [11], and alterations in serotonergic and dopaminergic neurotransmission [12]. These patients significantly improve after successful eradication of HCV using antiviral therapy [6, 13].
Resting-state functional magnetic resonance imaging (fMRI) serves as a novel approach in measuring spontaneous brain activity by examining low-frequency fluctuations in the blood oxygenation level-dependent (BOLD) signal [14, 15]. It has been extensively utilized in various neuropsychiatric diseases, including Alzheimer's disease [16], Parkinson's disease [17], schizophrenia [18], and major depression [19], and has played a major role in unveiling the mechanism underlying these neurologic disorders [20, 21]. HCV infections can also induce alterations in spontaneous brain activity, given that the following indexes that reflect spontaneous neural function change in HCV-infected patients: (1) mean dominant frequency of electroencephalography (EEG) is slowed [9] and (2) the cerebral glucose metabolism is reduced in a few brain regions, including the limbic association cortex, frontal and parietal cortex, and superior temporal cortex [22]. Thus, resting-state fMRI may be potentially utilized in the assessment of brain functional alterations that are related to HCV infection.
In this exploratory study, we employ resting-state fMRI to assess regional and network-level brain functional changes in HCV patients. Analyses of the amplitude of low-frequency fluctuation (ALFF) and seed-based functional connectivity (FC) were performed to assess, respectively, regional neural function and functional integration. ALFF reflects regional spontaneous cerebral neural activity [16, 23], whereas FC reveals the functional coordination between various regions [21]. Correlation analyses were also conducted to investigate the association of these regional and network-level functional alterations with cognitive impairment in HCV patients. This preliminary investigation may provide new insight into the mechanisms underlying HCV-related effects on brain function.
2. Materials and Methods
2.1. Participants
This research study was approved by the local Research Ethics Committees. We obtained written informed consent from each subject before the study began. Seventeen HCV-infected patients recruited through the outpatient clinic and 17 healthy controls recruited from advertisements comprised this study. Demographic information of the participants is presented in Table 1. No significant differences in relation to age, gender, or education level were observed between the two groups. For each HCV-infected patient, the quantitative polymerase chain reaction (HCV-PCR) was performed to assess virus load (RNA). The average virus load (PCR titer) was (8.5 ± 3.7) × 106 IU/mL (range : 0.95–1.43 × 10⁶ IU/mL) in the HCV-infected patient group. A part of HCV-infected (5 subjects) were undergoing treatment of interferon when they were recruited. A battery of cognitive tests called psychometric hepatic encephalopathy score (PHES) examination was used to assess cognition function in all participants. This examination included five subtests, namely, the number connection test A, number connection test B, digit symbol test, serial dotting test, and line tracing test. The cognitive test was performed as previously described [24].
Table 1.
Demographic and clinical information of the study participants.
| HC subjects (n = 17) | Patients with HCV infection (n = 17) | P value | |
|---|---|---|---|
| Age (year) | 46.0 ± 13.0 | 47.1 ± 13.1 | 0.822 |
| Gender (male/female) | 13/4 | 11/6 | 0.71 (χ2 test) |
| Education level (year) | 10.8 ± 4.3 | 9.9 ± 4.6 | 0.585 |
| PHES tests | |||
| Final PHES (score) | 0.6 ± 1.3 | −3.1 ± 2.8 | 0.028 |
| Number connection test A (seconds) | 33.2 ± 9.3 | 48.0 ± 24.2 | 0.024 |
| Number connection test B (seconds) | 52.7 ± 22.1 | 88.7 ± 55.2 | 0.020 |
| Serial dotting test (seconds) | 37.5 ± 5.8 | 41.5 ± 10.5 | 0.106 |
| Digit symbol test (raw score) | 52.1 ± 15.8 | 41.9 ± 18.4 | 0.013 |
| Line tracing test (raw score) | 113.1 ± 25.8 | 140.1 ± 31.0 | 0.001 |
Abbreviations: HC: healthy control; HCV: hepatitis C virus; PHES: psychometric hepatic encephalopathy score.
The exclusion criteria used in this study were as follows: (1) a diagnosis of liver cirrhosis or severe fibrosis, (2) hepatic encephalopathy as well as other neuropsychiatric disorders, (3) currently being treated with psychotropic medications, and (4) a diagnosis of uncontrolled endocrine or metabolic disease (such as a thyroid dysfunction).
2.2. MRI Data Acquisition
MR imaging was conducted using a 3.0 T scanner (Siemens, Verio, Germany). Three-dimensional T1-weighted magnetization-prepared rapid gradient echo (MPRAGE) sagittal images were gathered with the following parameters: TR = 1.9 ms, TE = 2.48 ms, matrix = 256 × 256, flip angle = 9°, FOV = 256 mm × 256 mm, 176 slices, and slice thickness = 1.0 mm (without interslice gap). Functional images were obtained with an echoplanar imaging sequence with the following parameters: TR = 2,000 ms, TE = 25 ms, matrix = 64 × 64, flip angle = 90°, FOV = 240 mm × 240 mm, 35 contiguous axial slices, slice thickness = 4 mm (without interslice gap), and volume number = 180. The participants were asked to keep their eyes closed, refrain from thinking about anything specific, and remain still.
2.3. Functional MRI Data Preprocessing
The Statistical Parametric Mapping (SPM version 12, https://www.fil.ion.ucl.ac.uk/spm/) software and the Data Processing and Analysis for Brain Imaging (DPABI, http://rfmri.org/dpabi) tool were employed to preprocess the functional MRI data, as previous study [24, 25]. The first 10 volumes were excluded to decrease the influence of the unstable initial MR imaging signals. Afterwards, we performed slice timing correction and realignment for head motion correction. A subject was excluded when his/her translational movement was >2.0 mm or the rotation was >2.0° [26, 27]. The individual T1-weighted images were coregistered with the mean functional images. A unified segmentation algorithm was then employed to segment the transformed structural images into gray matter, white matter, and cerebrospinal fluid. Then, using the normalization parameters that were estimated during unified segmentation, the motion-corrected functional images were further normalized into the standard Montreal Neurological Institute (MNI) space and then resampled to 3 mm × 3 mm × 3 mm. Finally, the functional images were spatially smoothed with a Gaussian kernel at a 4 mm full width set at half maximum. The preprocessed functional MRI data were further linearly detrended and bandpass-filtered (0.01–0.08 Hz) to decrease low-frequency drift and high-frequency physiological respiratory and cardiac noise.
2.4. ALFF Analysis
The ALFF analysis referred to a previous study [16]. The time courses were translated to the frequency domain with a fast Fourier transform, and then, the square root of the power spectrum was estimated and averaged across 0.01–0.08 Hz at every voxel. This averaged square root was designated as the ALFF. Then, to decrease the global effects of variability among subjects, the ALFF in each voxel was divided by the mean ALFF value of the global gray matter of every subject, thereby generating a relative ALFF. The relative ALFF was then used in further statistical analyses.
One-sample t-tests were performed on the individual ALFF maps to assess the within-group ALFF pattern using a voxel-wise approach for each group. To explore the ALFF differences between two groups, two-sample t-tests were then performed. To correct for multiple comparisons at the cluster level, we performed family-wise error (FWE) correction (voxel P < 0.005 and cluster-level P < 0.05) on all statistical maps. The results were visualized using the BrainNet Viewer toolbox (http://www.nitrc.org/projects/bnv/) [28].
2.5. Functional Connectivity Analysis
The functional connectivity analysis was conducted, using the SPM software and DPABI toolbox. A seed-based temporal correlation approach was conducted for FC analysis. As shown below, ALFF changes in patients with HCV infection were observed in two prefrontal brain regions (Table 2), and these were chosen as seeds in the subsequent FC analyses. To regulate any possible influence of head motion as well as global white matter and cerebrospinal fluid signals on our findings, we employed linear regression to remove various sources of spurious variance such as six head motion parameters and mean signals of cerebrospinal fluid, white matter, and whole brain. After that, a reference time series for every seed region was obtained by averaging the resting-state fMRI time series of voxels of this seed region. Then, voxel by voxel Pearson correlation analysis was conducted between the reference time series and the time series of the rest of the brain. We then normalized the Pearson correlation maps with a Fisher Z-transform.
Table 2.
Brain regions with significant ALFF difference between the two study groups.
| Regions | Voxels | Brodmann area | MNI coordinates | Peak T value | ||
|---|---|---|---|---|---|---|
| x | y | z | ||||
| Left medial frontal gyrus and bilateral anterior cingulate gyrus | 80 | 10/32 | -9 | 60 | 9 | 5.45 |
| Right middle and superior frontal gyrus | 63 | 11/10 | 30 | 45 | -15 | 5.58 |
For each group, a one-sample t-test was employed to determine the FC spatial distribution pattern of every seed. The voxel-wise FCs were compared between the two groups, using a two-sample t-test. To correct for multiple comparisons at the cluster level, we conducted false discovery rate (FDR) correction (voxel P < 0.005 and cluster-level P < 0.05) on all statistical maps. The results were visualized using the BrainNet Viewer toolbox (http://www.nitrc.org/projects/bnv/) [28].
2.6. Correlation Analysis
The two areas with significant ALFF difference were designated as regions of interest (ROI). The ALFF values of these two ROIs were obtained. Then, we calculated the FC strengths between two ROIs and the regions with significant FC changes. Spearman correlation analysis was conducted to determine the correlation between these ALFF/FC values and the HCV-infected patients' cognitive performance. The FDR-corrected P < 0.05 were considered statistically significant.
3. Results
3.1. Cognitive Assessment Results
Compared with the HC group, HCV-infected patients performed significantly worse on most (4/5) cognitive tests, including the number connection test A, number connection test B, digit symbol test, and the line tracing test (Table 1). The PHES score was lower in the HCV group than that in the HC group. These results indicate significant cognitive deficits in HCV-infected patients.
3.2. Results of ALFF Analysis
The within-group ALFF maps are shown in Figure 1. By visual inspection, we noted that within the HC group, several brain regions such as the posterior cingulate gyrus and adjacent precuneus, medial prefrontal cortex and anterior cingulate gyrus, inferior parietal lobules, and occipital regions exhibited higher ALFF values relative to the other brain regions. This ALFF pattern well agreed with the results of previous reports [16, 18, 29, 30]. The ALFF pattern within the HCV group was highly similar to that in the HC group; however, the ALFF map in the HC group showed a broader pattern, relative to that in the HCV group. Statistically, the HCV group showed lower ALFF values in two prefrontal regions, including ROI-1 (left medial frontal gyrus and bilateral anterior cingulate gyrus) and ROI-2 (right middle and superior frontal gyrus) (Figure 2). These two regions are listed in Table 2.
Figure 1.
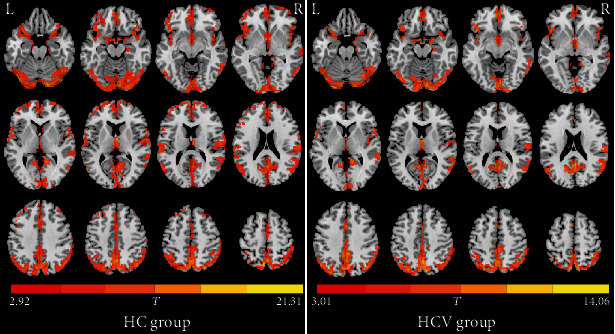
Within-group ALFF maps in the healthy control (HC) group as well as the patients infected with hepatitis C virus (HCV). The letters “L” and “R” represent the left and right sides, respectively.
Figure 2.

Brain regions showing decreased ALFF in patients with HCV infection. The patients showed lower ALFF values in two prefrontal regions, including ROI-1 (left medial frontal gyrus and bilateral anterior cingulate gyrus) and ROI-2 (right middle and superior frontal gyrus). The letters “L” and “R” represent the left and right sides, respectively.
3.3. Results of FC Analysis
Figures 3 and 4 show the results of further FC analysis. Compared with the HC group, the HCV group showed a decrease in FC between the ROI-1 and right middle frontal gyrus (Table 3). In contrast, the HCV group showed an increase in FC between the ROI-2 and the left supramarginal gyrus/superior temporal gyrus and the right supramarginal gyrus (Table 3).
Figure 3.

The functional connectivity pattern of seed region (i.e., left medial frontal gyrus and bilateral anterior cingulate gyrus) in the healthy control (HC group) and the patients with hepatitis C virus infection (HCV group). Compared with the HC group, the HCV group shows decreased functional connectivity between the seed region and right middle frontal gyrus. The letters “L” and “R” represent the left and right sides, respectively.
Figure 4.

The functional connectivity pattern of seed region (i.e., right middle and superior frontal gyrus) in the healthy control (HC group) and the patients with hepatitis C virus infection (HCV group). Compared with the HC group, the HCV group shows increased functional connectivity between the seed region and the left supramarginal gyrus/superior temporal gyrus and the right supramarginal gyrus. The letters “L” and “R” represent the left and right sides, respectively.
Table 3.
Brain regions with significant functional connectivity differences between the two study groups.
| Regions | Voxels | Brodmann area | MNI coordinates | Peak T value | ||
|---|---|---|---|---|---|---|
| x | y | z | ||||
| Decreased connectivity to ROI-1 | ||||||
| Right middle frontal gyrus | 75 | 8/9 | 27 | 30 | 39 | 4.43 |
| Increased connectivity to ROI-2 | ||||||
| Left supramarginal gyrus and superior temporal gyrus | 94 | 40/22 | -60 | -54 | 18 | -4.78 |
| Right supramarginal gyrus | 60 | 40 | 45 | -51 | 36 | -4.40 |
ROI-1: left medial frontal gyrus and bilateral anterior cingulate gyrus; ROI-2: right middle and superior frontal gyrus.
3.4. Results of Correlation Analysis
No significant correlation was observed between ALFF/FC measurements and HCV-infected patients' cognitive performance reflected by PHES results, after FDR correction. This may be due to the small sample size that limited the statistical power, to some extent.
4. Discussion
To the best of our knowledge, the present study serves as one of the first investigations on alterations of brain spontaneous activity in HCV patients with cognitive impairment. The ALFF value, which is the index of regional neural activity, decreased in two prefrontal areas, i.e., left medial frontal gyrus and bilateral anterior cingulate gyrus and right middle and superior frontal gyrus. This finding agrees with the results of previous reports in which the abnormal neural activity related to HCV infection is demonstrated by EEG and PET (positron emission tomography) studies [9, 22]. Additionally, using these two frontal areas as seed regions, FC analyses showed a decrease in FC in the right middle frontal gyrus, as well as increased FC in the left supramarginal gyrus/superior temporal gyrus and right supramarginal gyrus. The results of FC analysis are in line with the findings of a previous report in which FC changes were identified in patients with HCV infection and correlate with cognitive alterations [31]. Thus, these findings may jointly point to a connectivity-based pathophysiologic process in HCV-infected patients with cognitive impairment.
The prefrontal cortex has been proven to be the pathological node frequently affected by HCV infection, in which the patients show a reduction in the neural energy metabolism and cerebral blood volume [22, 32]. Also, the trend of lower N-acetyl aspartate/creatine ratio has been noted in the anterior cingulate gyrus, which may suggest a decrease in neuronal activity in HCV-infected patients [32]. Given the above facts, it is expected that ALFF decreases in the frontal areas (i.e., left medial frontal gyrus/bilateral anterior cingulate gyrus and right middle and superior frontal gyrus) in HCV patients. The reduction in ALFF may imply the abnormality in regional neural activity and could induce the consequential defects in the relevant brain functions, as previous reports [16]. Given that several cognitive functions (such as attention/executive function and memory) are modulated by the prefrontal cortex [33–36], it is speculated that ALFF reduction may reflect the impairment in these cognitive functions in patients with HCV infection. In line with this speculation, the previous correlation analysis demonstrates the relationship between reduced cerebral glucose utilization in several prefrontal areas (e.g., medial frontal gyrus and anterior cingulate gyrus) and impaired cognitive functions (such as attention and memory deficits) in HCV-infected patients [22].
The FC pattern of the first seed region (left medial frontal gyrus and bilateral anterior cingulate gyrus) mainly covers the distribution of the default mode network. This network is demonstrated to be associated with various emotions (such as depression and anxiety) and cognition (such as attention and memory) processing, all of which are aberrant in HCV-infected patients [5, 7, 9]. Therefore, it is implied that functional dissociation in this network may contribute to the neural substrates of HCV-related neurocognitive and neuropsychiatric disorders. However, an increase in FC was observed between the second seed region (right middle and superior frontal gyrus) and bilateral parietal-temporal cortex. The FC increment could be considered a compensatory procedure in response to the neurological disruption due to HCV neuroinvasion [37]. This plausible mechanism of compensation may be in agreement with previous findings: (1) by magnetic resonance spectroscopy, the increased N-acetyl-aspartate plus N-acetyl-aspartyl-glutamate concentration is demonstrated in the case of HCV infection, which is considered a compensatory process to preserve neuronal function [38], and (2) by resting-state fMRI, the increased FC in right posterior parietal regions is identified, which has been hypothesized to reflect functional reorganization that is associated with a compensatory mechanism to supply additional attention resources for better memory performance in HCV patients [31].
This study has several limitations. First, the data are cross-sectional, and thus, future longitudinal studies are warranted to demonstrate the full-time course of functional alteration as well as its causal relationship to HCV infection. Second, this study had a relatively small sample size, which limited statistical power. Further investigation using a larger cohort is recommended to validate our results. Third, several patients with interferon treatment were included in this study. Interferon neurotoxicity in the treatment of viral hepatitis has been documented [39, 40]; therefore, whether the intrinsic brain abnormalities investigated in this study is attributed to the effect of interferon, to some extent, should be further clarified in the future. Fourth, this study did not assess mood alterations, which are another common neuropsychiatric symptom (manifested by higher levels of anxiety and depression [9]) that is accompanied by cognitive impairment in HCV-infected patients. Psychological symptoms such as anxiety and depression are able to cause abnormal changes in the intrinsic brain function [19, 41]. Thus, the absence of psychological status screening may hamper our interpretation of the results, to some extent. Fifth, only a simplified cognitive assessment (PHES examination) was applied in our study. More comprehensive tests are recommended in the future study to examine the abnormal cognitive status in HCV-infected patients, which is beneficial to identify the key characteristics of cognitive impairments and their relationships with regional and network-level brain dysfunction. Finally, we only performed two seed-based FC analyses to reflect network-level brain functional changes. More comprehensive exploration (e.g., whole-brain FC analysis) is recommended in the future.
In this preliminary study, we applied ALFF and FC analyses to reflect, respectively, regional spontaneous brain activity and functional coordination between various regions, which contributed to improving our understanding of the neural mechanism underlying the dysfunctions related to HCV infection. Our results revealed that HCV-infected patients had aberrant regional brain function and altered FC between distinct regions that are primarily associated with attention and executive dysfunction. Thus, our study provides further evidence that HCV infection affects brain function. Further investigation using a larger cohort should be conducted to determine the relationship between the intrinsic brain abnormalities and HCV infection-related cognitive dysfunctions.
Acknowledgments
This study was funded by grants from the National Natural Science Foundation of China (No. 81501450), Fujian Provincial Science Fund for Distinguished Young Scholars (No. 2018J06023), Fujian Provincial Program for Distinguished Young Scholars (No. 2017B023), Fujian Provincial Program for Science and Technology Innovation (No. 2019Y9067), and Fujian Provincial Health Commission Project for Scientific Research Talents (No. 2018-ZQN-28).
Abbreviations
- HCV:
Hepatitis C virus
- fMRI:
Functional magnetic resonance imaging
- ALFF:
Amplitude of low-frequency fluctuation
- FC:
Functional connectivity
- PHES:
Psychometric hepatic encephalopathy score
- FWE:
Family-wise error
- ROI:
Region of interest.
Data Availability
The data used to support the findings of this study are available from the corresponding author, on reasonable request.
Conflicts of Interest
The authors declare no conflict of interest.
Authors' Contributions
HJC, XHZ, and CZ conceived and designed the study, acquired and analyzed the data, and wrote the manuscript. JYS and LZ contributed to data analysis. All authors have read and approved the manuscript. Xiao-Hong Zhang, Jia-Yan Shi, and Chuanyin Zhan contributed equally to this work.
References
- 1.Jacobson I. M., Cacoub P., Dal Maso L., Harrison S. A., Younossi Z. M. Manifestations of chronic hepatitis C virus infection beyond the liver. Clinical Gastroenterology and Hepatology. 2010;8(12):1017–1029. doi: 10.1016/j.cgh.2010.08.026. [DOI] [PubMed] [Google Scholar]
- 2.Fletcher N. F., McKeating J. A. Hepatitis C virus and the brain. Journal of Viral Hepatitis. 2012;19(5):301–306. doi: 10.1111/j.1365-2893.2012.01591.x. [DOI] [PubMed] [Google Scholar]
- 3.Fletcher N. F., Wilson G. K., Murray J., et al. Hepatitis C virus infects the endothelial cells of the blood-brain barrier. Gastroenterology. 2012;142(3):634–643.e6. doi: 10.1053/j.gastro.2011.11.028. [DOI] [PMC free article] [PubMed] [Google Scholar]
- 4.Monaco S., Ferrari S., Gajofatto A., Zanusso G., Mariotto S. HCV-related nervous system disorders. Clinical and Developmental Immunology. 2012;2012:9. doi: 10.1155/2012/236148.236148 [DOI] [PMC free article] [PubMed] [Google Scholar]
- 5.Monaco S., Mariotto S., Ferrari S., et al. Hepatitis C virus-associated neurocognitive and neuropsychiatric disorders: advances in 2015. World Journal of Gastroenterology. 2015;21(42):11974–11983. doi: 10.3748/wjg.v21.i42.11974. [DOI] [PMC free article] [PubMed] [Google Scholar]
- 6.Thein H. H., Maruff P., Krahn M. D., et al. Improved cognitive function as a consequence of hepatitis C virus treatment. HIV Medicine. 2007;8(8):520–528. doi: 10.1111/j.1468-1293.2007.00505.x. [DOI] [PubMed] [Google Scholar]
- 7.McAndrews M. P., Farcnik K., Carlen P., et al. Prevalence and significance of neurocognitive dysfunction in hepatitis C in the absence of correlated risk factors. Hepatology. 2005;41(4):801–808. doi: 10.1002/hep.20635. [DOI] [PubMed] [Google Scholar]
- 8.Byrnes V., Miller A., Lowry D., et al. Effects of anti-viral therapy and HCV clearance on cerebral metabolism and cognition. Journal of Hepatology. 2012;56(3):549–556. doi: 10.1016/j.jhep.2011.09.015. [DOI] [PubMed] [Google Scholar]
- 9.Weissenborn K., Krause J., Bokemeyer M., et al. Hepatitis C virus infection affects the brain-evidence from psychometric studies and magnetic resonance spectroscopy. Journal of Hepatology. 2004;41(5):845–851. doi: 10.1016/j.jhep.2004.07.022. [DOI] [PubMed] [Google Scholar]
- 10.Forton D. M., Allsop J. M., Main J., Foster G. R., Thomas H. C., Taylor-Robinson S. D. Evidence for a cerebral effect of the hepatitis C virus. The Lancet. 2001;358(9275):38–39. doi: 10.1016/S0140-6736(00)05270-3. [DOI] [PubMed] [Google Scholar]
- 11.Kumar A., Deep A., Gupta R. K., Atam V., Mohindra S. Brain microstructural correlates of cognitive dysfunction in clinically and biochemically normal hepatitis C virus infection. Journal of Clinical and Experimental Hepatology. 2017;7(3):198–204. doi: 10.1016/j.jceh.2017.03.011. [DOI] [PMC free article] [PubMed] [Google Scholar]
- 12.Weissenborn K., Ennen J. C., Bokemeyer M., et al. Monoaminergic neurotransmission is altered in hepatitis C virus infected patients with chronic fatigue and cognitive impairment. Gut. 2006;55(11):1624–1630. doi: 10.1136/gut.2005.080267. [DOI] [PMC free article] [PubMed] [Google Scholar]
- 13.Kraus M. R., Schäfer A., Teuber G., et al. Improvement of neurocognitive function in responders to an antiviral therapy for chronic hepatitis C. Hepatology. 2013;58(2):497–504. doi: 10.1002/hep.26229. [DOI] [PubMed] [Google Scholar]
- 14.Shmuel A., Leopold D. A. Neuronal correlates of spontaneous fluctuations in fMRI signals in monkey visual cortex: implications for functional connectivity at rest. Human Brain Mapping. 2008;29(7):751–761. doi: 10.1002/hbm.20580. [DOI] [PMC free article] [PubMed] [Google Scholar]
- 15.Laufs H. Endogenous brain oscillations and related networks detected by surface EEG-combined fMRI. Human Brain Mapping. 2008;29(7):762–769. doi: 10.1002/hbm.20600. [DOI] [PMC free article] [PubMed] [Google Scholar]
- 16.Wang Z., Yan C., Zhao C., et al. Spatial patterns of intrinsic brain activity in mild cognitive impairment and Alzheimer's disease: a resting-state functional MRI study. Human Brain Mapping. 2011;32(10):1720–1740. doi: 10.1002/hbm.21140. [DOI] [PMC free article] [PubMed] [Google Scholar]
- 17.Zhang J., Wei L., Hu X., et al. Specific frequency band of amplitude low-frequency fluctuation predicts Parkinson's disease. Behavioural Brain Research. 2013;252:18–23. doi: 10.1016/j.bbr.2013.05.039. [DOI] [PubMed] [Google Scholar]
- 18.Hoptman M. J., Zuo X. N., Butler P. D., et al. Amplitude of low-frequency oscillations in schizophrenia: a resting state fMRI study. Schizophrenia Research. 2010;117(1):13–20. doi: 10.1016/j.schres.2009.09.030. [DOI] [PMC free article] [PubMed] [Google Scholar]
- 19.Greicius M. D., Flores B. H., Menon V., et al. Resting-state functional connectivity in major depression: abnormally increased contributions from subgenual cingulate cortex and thalamus. Biological Psychiatry. 2007;62(5):429–437. doi: 10.1016/j.biopsych.2006.09.020. [DOI] [PMC free article] [PubMed] [Google Scholar]
- 20.Lee M. H., Smyser C. D., Shimony J. S. Resting-state fMRI: a review of methods and clinical applications. American Journal of Neuroradiology. 2013;34(10):1866–1872. doi: 10.3174/ajnr.A3263. [DOI] [PMC free article] [PubMed] [Google Scholar]
- 21.Barkhof F., Haller S., Rombouts S. A. R. B. Resting-state functional MR imaging: a new window to the brain. Radiology. 2014;272(1):29–49. doi: 10.1148/radiol.14132388. [DOI] [PubMed] [Google Scholar]
- 22.Heeren M., Weissenborn K., Arvanitis D., et al. Cerebral glucose utilisation in hepatitis C virus infection-associated encephalopathy. Journal of Cerebral Blood Flow and Metabolism. 2011;31(11):2199–2208. doi: 10.1038/jcbfm.2011.82. [DOI] [PMC free article] [PubMed] [Google Scholar]
- 23.Zang Y. F., He Y., Zhu C. Z., et al. Altered baseline brain activity in children with ADHD revealed by resting-state functional MRI. Brain and Development. 2007;29(2):83–91. doi: 10.1016/j.braindev.2006.07.002. [DOI] [PubMed] [Google Scholar]
- 24.Chen H. J., Jiang L. F., Sun T., Liu J., Chen Q. F., Shi H. B. Resting-state functional connectivity abnormalities correlate with psychometric hepatic encephalopathy score in cirrhosis. European Journal of Radiology. 2015;84(11):2287–2295. doi: 10.1016/j.ejrad.2015.08.005. [DOI] [PubMed] [Google Scholar]
- 25.Zhan C., Chen H. J., Gao Y. Q., Zou T. X. Functional network-based statistics reveal abnormal resting-state functional connectivity in minimal hepatic encephalopathy. Frontiers in Neurology. 2019;10:p. 33. doi: 10.3389/fneur.2019.00033. [DOI] [PMC free article] [PubMed] [Google Scholar]
- 26.Ji L., Zhang H., Potter G. G., et al. Multiple neuroimaging measures for examining exercise-induced neuroplasticity in older adults: a quasi-experimental study. Frontiers in Aging Neuroscience. 2017;9:p. 102. doi: 10.3389/fnagi.2017.00102. [DOI] [PMC free article] [PubMed] [Google Scholar]
- 27.Cui Y., Li S. F., Gu H., et al. Disrupted brain connectivity patterns in patients with type 2 diabetes. American Journal of Neuroradiology. 2016;37(11):2115–2122. doi: 10.3174/ajnr.A4858. [DOI] [PMC free article] [PubMed] [Google Scholar]
- 28.Xia M., Wang J., He Y. BrainNet Viewer: a network visualization tool for human brain connectomics. PLoS One. 2013;8(7, article e68910) doi: 10.1371/journal.pone.0068910. [DOI] [PMC free article] [PubMed] [Google Scholar]
- 29.Qi R., Zhang L., Wu S., et al. Altered resting-state brain activity at functional MR imaging during the progression of hepatic encephalopathy. Radiology. 2012;264(1):187–195. doi: 10.1148/radiol.12111429. [DOI] [PubMed] [Google Scholar]
- 30.Zou Q. H., Zhu C. Z., Yang Y., et al. An improved approach to detection of amplitude of low-frequency fluctuation (ALFF) for resting-state fMRI: fractional ALFF. Journal of Neuroscience Methods. 2008;172(1):137–141. doi: 10.1016/j.jneumeth.2008.04.012. [DOI] [PMC free article] [PubMed] [Google Scholar]
- 31.Kharabian Masouleh S., Herzig S., Klose L., et al. Functional connectivity alterations in patients with chronic hepatitis C virus infection: a multimodal MRI study. Journal of Viral Hepatitis. 2017;24(3):216–225. doi: 10.1111/jvh.12634. [DOI] [PubMed] [Google Scholar]
- 32.Bladowska J., Zimny A., Knysz B., et al. Evaluation of early cerebral metabolic, perfusion and microstructural changes in HCV-positive patients: a pilot study. Journal of Hepatology. 2013;59(4):651–657. doi: 10.1016/j.jhep.2013.05.008. [DOI] [PubMed] [Google Scholar]
- 33.Kim C., Kroger J. K., Kim J. A functional dissociation of conflict processing within anterior cingulate cortex. Human Brain Mapping. 2011;32(2):304–312. doi: 10.1002/hbm.21020. [DOI] [PMC free article] [PubMed] [Google Scholar]
- 34.Morici J. F., Bekinschtein P., Weisstaub N. V. Medial prefrontal cortex role in recognition memory in rodents. Behavioural Brain Research. 2015;292:241–251. doi: 10.1016/j.bbr.2015.06.030. [DOI] [PubMed] [Google Scholar]
- 35.Bissonette G. B., Powell E. M., Roesch M. R. Neural structures underlying set-shifting: roles of medial prefrontal cortex and anterior cingulate cortex. Behavioural Brain Research. 2013;250:91–101. doi: 10.1016/j.bbr.2013.04.037. [DOI] [PMC free article] [PubMed] [Google Scholar]
- 36.Cassaday H. J., Nelson A. J., Pezze M. A. From attention to memory along the dorsal-ventral axis of the medial prefrontal cortex: some methodological considerations. Frontiers in Systems Neuroscience. 2014;8:p. 160. doi: 10.3389/fnsys.2014.00160. [DOI] [PMC free article] [PubMed] [Google Scholar]
- 37.Hillary F. G., Roman C. A., Venkatesan U., Rajtmajer S. M., Bajo R., Castellanos N. D. Hyperconnectivity is a fundamental response to neurological disruption. Neuropsychology. 2015;29(1):59–75. doi: 10.1037/neu0000110. [DOI] [PubMed] [Google Scholar]
- 38.Bokemeyer M., Ding X. Q., Goldbecker A., et al. Evidence for neuroinflammation and neuroprotection in HCV infection-associated encephalopathy. Gut. 2011;60(3):370–377. doi: 10.1136/gut.2010.217976. [DOI] [PubMed] [Google Scholar]
- 39.Amodio P., de Toni E. N., Cavalletto L., et al. Mood, cognition and EEG changes during interferon alpha (alpha-IFN) treatment for chronic hepatitis C. Journal of Affective Disorders. 2005;84(1):93–98. doi: 10.1016/j.jad.2004.09.004. [DOI] [PubMed] [Google Scholar]
- 40.Marks D. H., Adineh M., Wang B., Gupta S. Use of fMRI to predict psychiatric adverse effects of interferon treatment for hepatitis C - preliminary report. Neuropsychiatric Disease and Treatment. 2007;3(5):655–667. [PMC free article] [PubMed] [Google Scholar]
- 41.Sylvester C. M., Corbetta M., Raichle M. E., et al. Functional network dysfunction in anxiety and anxiety disorders. Trends in Neurosciences. 2012;35(9):527–535. doi: 10.1016/j.tins.2012.04.012. [DOI] [PMC free article] [PubMed] [Google Scholar]
Associated Data
This section collects any data citations, data availability statements, or supplementary materials included in this article.
Data Availability Statement
The data used to support the findings of this study are available from the corresponding author, on reasonable request.