Abstract
BACKGROUND AND PURPOSE:
Innovative techniques and device-related advances have improved the outcomes of neuroendovascular treatment. 3D imaging has previously used 2 × 2 binning, but 1 × 1 binning has recently been made available. The aim of this study was to evaluate the quantitative ability of conebeam CT for stent delineation and to investigate its effectiveness in the clinical environment.
MATERIALS AND METHODS:
Four acquisition groups of 3D MIP images acquired using conebeam CT with varying conditions (acquisition time, 10 or 20 seconds and binning, 1 × 1 or 2 × 2) were compared. Two methods of analysis were performed, a phantom study and an analysis of 28 randomly selected patients. The phantom study assessed the contrast-to-noise ratio and full width at half maximum values in conebeam CT images of intracranial stent struts. In the clinical subjects, we assessed contrast-to-noise ratio, full width at half maximum, and dose-area product.
RESULTS:
In the phantom study, the contrast-to-noise ratio was not considerably different between 10- and 20-second acquisition times at equivalent binning settings. Additionally, the contrast-to-noise ratio at equivalent acquisition times did not differ considerably by binning setting. For the full width at half maximum results, equivalent acquisition times differed significantly by binning setting. In the clinical analyses, the 10-second/1 × 1 group (versus 20 second/2 × 2) showed a higher contrast-to-noise ratio (P < .05) and a dose-area product reduced by approximately 70% (P < .05), but the difference in full width at half maximum was not significant (P = .20).
CONCLUSIONS:
For stent-assisted coil embolization, quantitative assessment of conebeam CT showed that 10 second/1 × 1 was equivalent to 20 second/2 × 2 for imaging deployed intracranial stents. Furthermore, the 10-second/1 × 1 settings resulted in a much smaller DAP.
Outcomes of neuroendovascular treatment have improved because of innovative interventional techniques and advances in medical equipment.1–6 There are a variety of coil embolization methods,1–4 such as the balloon technique and the stent-assisted techniques, but their purpose is to create thrombosis in the aneurysm sac.7,8
Stent-assisted coil embolization involves complete saccular filling with platinum coils.9 Conebeam CT (CBCT) is used to verify the placement of the deployed stent,9 stent and vessel wall connections, proper sizing of the stent, and the necessity of re-implantation. Therefore, it is necessary to obtain high-quality 3D images in a timely manner following stent-assisted coil embolization. Stent struts are visible in 3D-MIP images10,11 and are generally visible using flat panel detector systems through 2 × 2 binning. Recently, the development of advanced flat panel detector technology has allowed 1 × 1 binning of CBCT data to improve the contrast-to-noise ratio (CNR) of CBCT images6 and to thus render high-quality 3D vascular images. Because the performance of angiographic systems has improved, conventional CBCT acquisition now has an image resolution equal to that of 3D-DSA images. When the CBCT acquisition time is short, the radiation dose is reduced. The aim of this study was to evaluate the delineation of deployed stents using different combinations of acquisition times and binning settings.
Materials and Methods
Acquisition Time and Binning in the Phantom Study
A phantom was made with a 10-mL syringe and a stent filled with saline. The phantom stent was a newest generation, self-expandable, closed-cell device (Enterprise vascular reconstruction device; Codman & Shurtleff, Raynham, Massachusetts). The phantom was then placed onto a cradle in the air. All CBCT images were acquired with a biplane flat panel detector (30 × 40 cm) angiographic system (Artis Q BA Twin; Siemens, Erlangen, Germany). Table 1 shows the conditions of the CBCT imaging. We used 4 combinations of acquisition times and binning settings: a 10-second acquisition time with 1 × 1 binning (10 second/1 × 1), a 10-second acquisition time with 2 × 2 binning (10 second/2 × 2), a 20-second acquisition time with 1 × 1 binning (20 second/1 × 1), and a 20-second acquisition time with 2 × 2 binning (20 second/2 × 2). The data generated were transferred to a commercially available workstation (syngo X Workplace; Siemens) for postprocessing of 3D-MIP images. The following settings were applied to reconstruct the MIP image dataset: kernel, Hounsfield unit; image characteristics, sharp. The postprocessing was performed with a volume of approximately 7.5 × 7.5 × 7.5 cm and a 512 × 512 matrix, which yielded an isotropic voxel size of 0.15 mm. The 3D-MIP reconstructions of each aneurysm were generated in an oblique orientation with a 1.5-mm section thickness. All reconstructed CBCT data were then downloaded to a personal computer using the DICOM format.
Table 1:
Imaging parameters and conditions for CBCT
| 10-Second CBCT | 20-Second CBCT | |
|---|---|---|
| Exposure parameters | ||
| Tube voltage | 70 kV | 70 kV |
| Pulse width | 12.5 ms | 12.5 ms |
| Radiation exposure | 1.20 μGy/pulse | 1.20 μGy/pulse |
| Binning/focus size/FOV | 1 × 1/0.4 mm/22 cm | |
| 2 × 2/0.6 mm/42 cm | ||
| Acquisition parameters | ||
| Angle step | 0.8°/frame | 0.4°/frame |
| Angle | 200° | 200° |
| Total frame | 250 | 500 |
| Matrix size/binning | 9602/2 × 2 | |
| 10242/1 × 1 | ||
| Injection condition | ||
| Injection rate | 1.0 mL/s | 1.0 mL/s |
| Concentration of contrast medium | 14% | 14% |
| X-ray delay time | 4.5 seconds | 4.5 seconds |
| Injection time of contrast medium | 14.5 seconds | 24.5 seconds |
The image-processing software is freely available on-line (ImageJ, Version 1.43; National Institutes of Health; https://imageJ.nih.gov/ij/). The CNR was measured for the stent strut and the background using an ROI (0.5 × 0.5 mm) in a phantom filled with diluted contrast media (iopamidol, Iopamiron 300; Bayer Yakuhin, Osaka, Japan). The concentrations of contrast media used were 10%, 15%, 20%, and 25% diluted with saline. The CNR was measured at 5 ROIs expressed as mean ± SD. An experienced (>15 years) radiologic technologist determined the full width at half width maximum (FWHM) and CNR values and calculated the mean, SD, median, and 95% confidence interval values.
Image processing was performed manually by drawing lines perpendicular to the stent strut to create a plot profile curve and then measuring the FWHM. However, we observed that the FWHM was susceptible to underestimation within the contrast medium. Thus, we chose not to use contrast medium. The FWHM was then measured at 5 points, expressed as mean ± SD.
Acquisition Time and Binning in Clinical Subsets
This retrospective study was approved by the ethics committees at our institutions (Nagoya University Graduate School of Medicine, Nagoya, Japan; and Institute of Biomedical Research and Innovation, Kobe, Japan). Twenty-eight patients (18 women, 10 men; 64 ± 12 years of age; range, 36–78 years of age) were included in this study. Each patient had been treated for a single cerebral aneurysm by stent-assisted coil embolization. Twenty patients (71%) had been treated for anterior circulation aneurysms, while the remaining 8 patients (29%) had been treated for posterior circulation aneurysms. Subjects were divided into 2 acquisition groups of 14 patients each: group A, 20-second acquisition time and 2 × 2 binning (May 2015 to June 2015), and group B, 10-second acquisition time and 1 × 1 binning (July 2015 to August 2015). Two syringes were prepared for a dual head injector (Press Duo; Nemoto Kyorindo, Tokyo, Japan), one with a 15% concentration of contrast medium delivered to delineate the stent and another with a 100% concentration of contrast medium delivered to delineate the vessel and aneurysm. We did not analyze the delineation images that were obtained with the 100% contrast medium. In all patients, stent deployments were safely achieved at the desired sites.
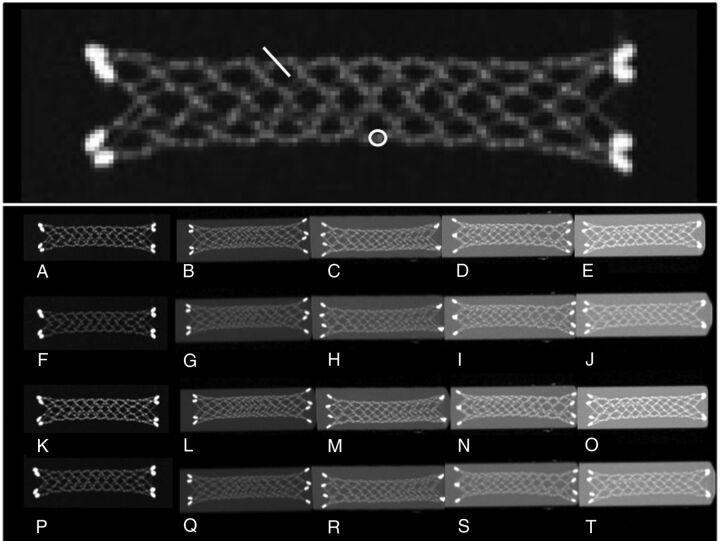
All reconstructed CBCT data were downloaded to a personal computer using the DICOM format. Both patient subsets (groups A and B) were analyzed with FWHM of the stent strut and by CNR of the stent in the phantom study. To determine the CNR and FWHM values of the implanted stents, we used an ROI-based method equivalent to that described for the phantom study (Fig 1, upper row). The units for the contrast values are Hounsfield unitCBCT and were determined from the CBCT images. Dose-area product (DAP; microgray × square centimeter) values of both groups were then investigated to determine radiation exposure.
Fig 1.
3D-MIP images of phantom stents at various concentrations of contrast medium.
Data Analysis
All statistical analyses were performed in Excel, Version 14.6.4 for Mac (Microsoft, Redmond, Washington). In the phantom study, a 2-sided t test was used to analyze correlations within the 4 groups of different combinations of acquisition times and binning. Statistical significance was set at a corrected P < .01 using the Bonferroni correction for the phantom experiments.12 For the patient subsets, the nonparametric U test was applied to analyze correlations. Statistical significance was set at P < .05 for analysis of the patient experiments.
Results
Acquisition Time and Binning in the Phantom Study
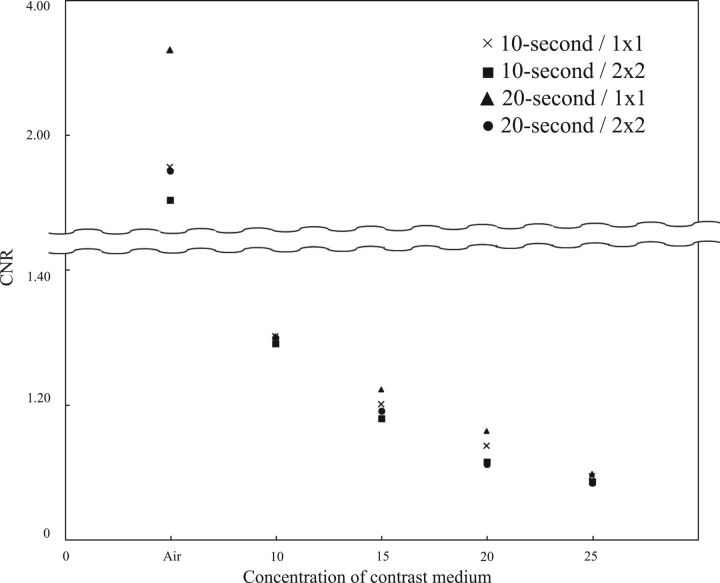
Figure 1 shows 3D-MIP images of the phantom stent at various concentrations of contrast medium. We measured contrast values using contrast medium concentrations ranging from 10% to 25%. The phantom was filled with contrast medium to confirm that the contrast of the stent did not decrease in the contrast medium. The contrast value was the difference between the contrast value of the stent and that of the contrast medium. The contrast values in the MIP images of the stents increased when contrast medium was added. In Fig 2, the CNR of the stent is plotted at various settings (10- or 20-second acquisition; 1 × 1 or 2 × 2 binning) against the concentration of contrast medium (0% [saline], 10%, 15%, 20%, and 25%). P values for differences in CNR values of the phantom stent strut images by acquisition time/binning settings and contrast medium concentration are presented in Table 2.
Fig 2.
CNR of a phantom stent imaged at various settings (10- or 20-second acquisition time, 1 × 1 or 2 × 2 binning) plotted against increasing concentrations of contrast medium.
Table 2:
P values for differences in contrast-to-noise ratios of phantom stent struts by acquisition time/binning level at various contrast medium concentrations
| Acquisition Combination (Sec/Binning vs Sec/Binning) | Concentration of Contrast Medium |
|||
|---|---|---|---|---|
| Just Saline | 10% | 15% | 20% | |
| 10/1 × 1 vs 10/2 × 2 | .9328 | .5888 | .2733 | .2734 |
| 10/1 × 1 vs 20/1 × 1 | .9419 | .9828 | .2595 | .4224 |
| 10/1 × 1 vs 20/2 × 2 | .0019 | .9413 | .6592 | .2044 |
| 10/2 × 2 vs 20/1 × 1 | .0257 | .1573 | .0088 | .0145 |
| 10/2 × 2 vs 20/2 × 2 | .9985 | .8009 | .2948 | .5754 |
| 20/1 × 1 vs 20/2 × 2 | .0568 | .9481 | .092 | .0113 |
All numbers represent P values.
At 10% concentration of the contrast medium, we observed that the stent strut was delineated and enhancement was marginal for the phantom. At 25% concentration of the contrast medium, stent visualization was difficult and enhancement was high for the phantom (Fig 1). There was not a significant difference in CNR between the 10- and 20-second acquisition times at equivalent binning settings.
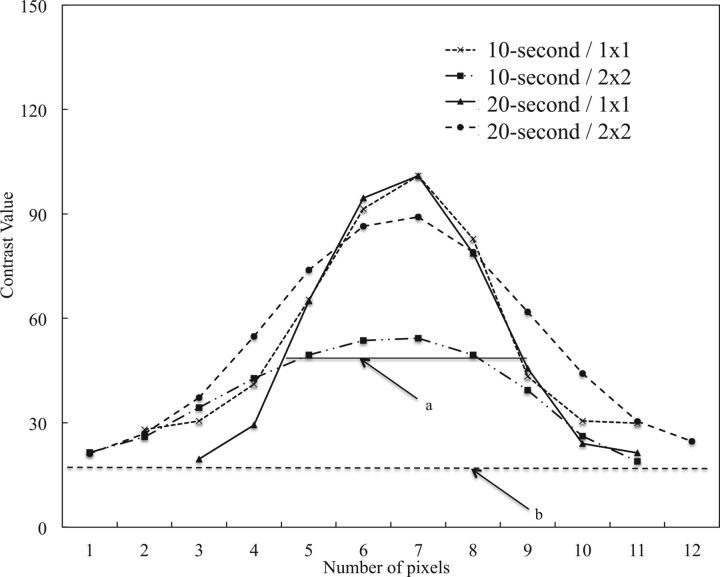
Figure 3 shows a plot of FWHM results for the phantom stent strut imaged at various settings (10- or 20-second acquisition; 1 × 1 or 2 × 2 binning) while set in a cradle in air. FWHM values of the stent strut were as follows: 10 second/1 × 1, 0.37 ± 0.04 mm; 10 second/2 × 2, 0.59 ± 0.09 mm; 20 second/1 × 1, 0.35 ± 0.04 mm; and 20 second/2 × 2, 0.51 ± 0.12 mm. There was no significant difference between 10-second and 20-second acquisition times at equivalent binning settings (10 second/1 × 1 versus 20 second/1 × 1, P = .5796; 10 second/2 × 2 versus 20 second/2 × 2, P = .2725). However, FWHM with equivalent acquisition times differed significantly by binning settings (10 second/1 × 1 versus 10 second/2 × 2, P = .0011; 20 second/1 × 1 versus 20 second/2 × 2, P = .0242). The results for comparisons of different acquisition times and different binning settings were as follows: 10 second/1 × 1 versus 20 second/2 × 2, P = .0371; 10 second/2 × 2 versus 20 second/1 × 1, P = .0007.
Fig 3.
FWHM values of the phantom stent images obtained in saline at various settings (10- or 20-second acquisition time; 1 × 1 or 2 × 2 binning).
Acquisition Time and Binning in Clinical Subsets A versus B
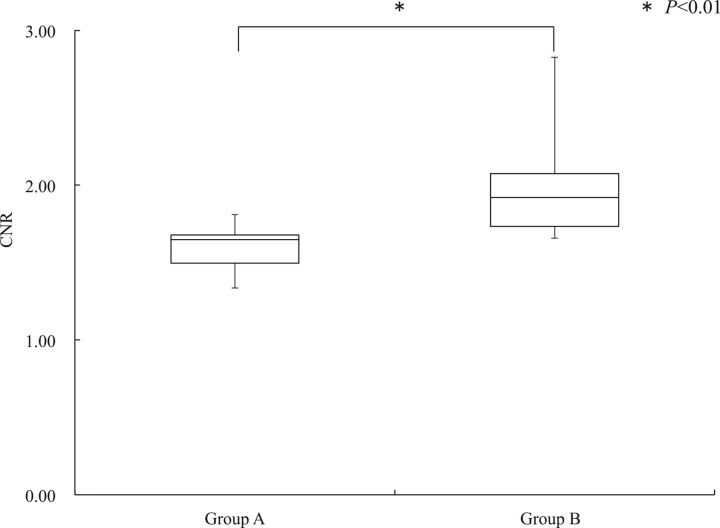
Figure 4 shows the CNR values from CBCT images of the stent struts. The CBCT images were obtained with a 15% concentration of contrast medium in both groups. The nonparametric analysis comparing CNR values between clinical subjects in group A (20 second/2 × 2) (median, 1.65; 95% CI, 1.50–1.68) and those in group B (10 second/1 ×1) (median, 1.92; 95% CI, 1.73–2.08) showed that the 2 groups differed significantly (P < .05).
Fig 4.
CNR of stent struts imaged with CBCT with a 15% concentration of contrast medium in groups A and B.
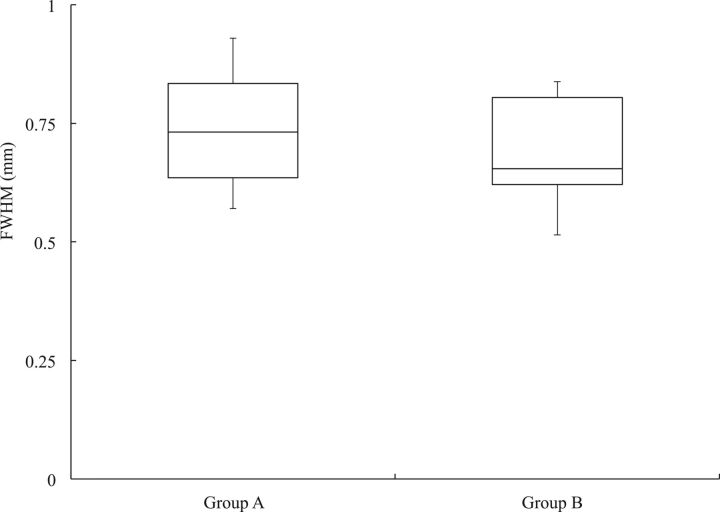
Figure 5 presents FWHM results for the stent strut on CBCT images obtained with a 15% concentration of contrast medium in both groups A and B. There were no significant differences in the nonparametric analysis of FWHM between the clinical subjects in group A (median, 0.73 mm; 95% CI, 0.63–0.83 mm) and those in group B (median, 0.65 mm; 95% CI, 0.62–0.80 mm; P = .1985).
Fig 5.
FWHM of the stent strut on CBCT images with a 15% concentration of contrast medium in groups A and B.
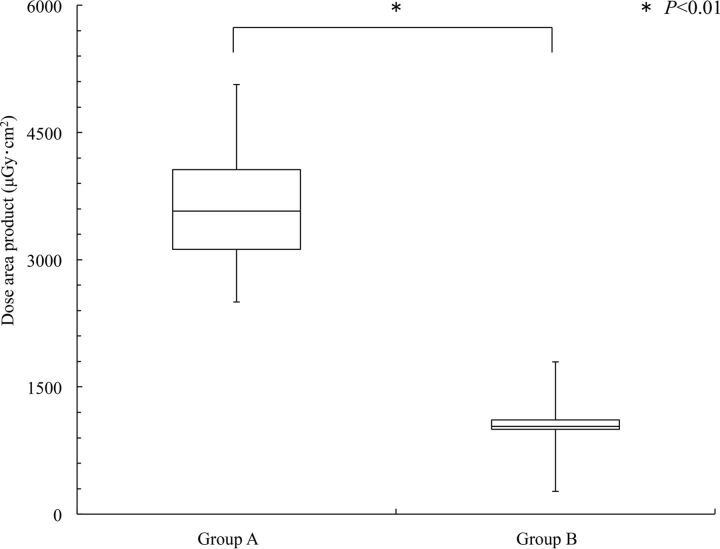
Figure 6 shows the DAP results of the clinical subjects in groups A and B. The DAP values differed significantly between group A (median, 3574 μGy · cm2; 95% CI, 3123–4061 μGy · cm2) and group B (median, 1035 μGy · cm2; 95% CI, 999–1109 μGy · cm2; P < .05).
Fig 6.
The DAP values in groups A and B.
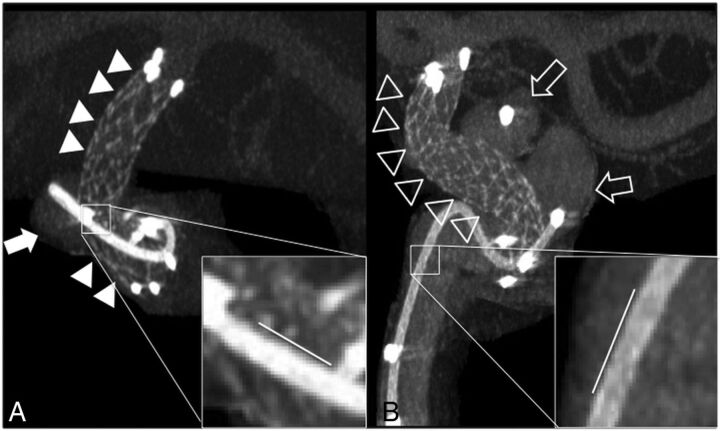
Figure 7 shows 3D-MIP images of 2 representative patients. The images were obtained with a 15% concentration of contrast medium. The degree of stent delineation in images obtained with 10 second/1 × 1 (group B, Fig 7B) was statistically like that in images obtained with 20 second/2 × 2 (group A, Fig 7A).
Fig 7.
3D-MIP images of 2 clinical cases imaged with different acquisition times and binning settings and a 15% concentration of contrast medium.
Discussion
Acquisition Time and Binning in the Phantom Study
We confirmed that the CNR resulting from 1 × 1 binning was approximately the same as that obtained from 2 × 2 binning (Fig 2). Ultimately, CBCT performed with 10 second/1 × 1 and a 15% concentration of contrast medium produced images that were satisfactory for viewing the deployed stent position and vessels (Fig 1).
In terms of binning, projection images13–16 were converted using the algorithm of Veldkamp et al,13 which corrects the offset and sensitivity of the flat panel detector while allowing geometric distortion of the subject's FOV. On processing values for all angles, a convolution was performed with a Shepp & Logan filter. The action of 2 × 2 binning causes 4 pixels to be likened to 1 pixel. With nonlinear interpolation, the default value of 14 bits per pixel is expanded to 16 bits (Fig 1F–J and P–T). However, 1 × 1 binning portrays contrast at a 16-bit level, matching each voxel with a corresponding pixel (Fig 1 A–E and K–O). CBCT imaging with 1 × 1 binning can therefore produce greater density and spatial resolution. Ultimately, CBCT imaging with a 10-second acquisition time, 1 × 1 binning, and use of 15% contrast medium can be sufficient to provide satisfactory CBCT images for overview of the deployed stent position and vessels. It is easier to delineate blood vessels if a higher concentration of contrast medium is used in the blood vessels; thus, a higher concentration of contrast medium makes it easier to evaluate the relationship between the deployed stent position and blood vessels.
Acquisition Time and Binning in Clinical Subsets A and B
Our phantom study results suggested that images obtained with 10-second acquisition times and 1 × 1 binning have better CNR (P < .01) and FWHM (P = .0371) values compared with those obtained with 20-second acquisition times and 2 × 2 binning. The reconstructed CBCT images13 obtained with 10-second acquisition times had fewer projections; therefore, jagged borders were visible. With the 20-second acquisitions, there were more projections; therefore, borders were displayed more smoothly. Despite a lack of a qualitative advantage in visualization, these features make 10-second acquisition/1 × 1 binning preferable because these settings benefit the patient in the stent-assisted coil embolization technique.
The 28 clinical subjects who underwent stent-assisted coil embolization were divided into 2 groups of 14 patients each. The CBCT images for group A were obtained with 20-second acquisition times and 2 × 2 binning, while those for group B were obtained with 10-second acquisition times and 1 × 1 binning. We observed significant differences in CNR values between the groups (P < .05, Fig 4), but no significant difference was observed in FWHM values (P = .1985, Fig 5). Thus, the CBCT images of the deployed stents were qualitatively similar between the 2 groups. Images obtained in group B had a qualitative disadvantage due to a reduced number of projections, but these images were still sufficient to determine the relationship among the stent, the blood vessels, and the cerebral aneurysm.
The American Association of Physicists in Medicine reported that the radiation dose from a single rotation of a conebeam around a stationary phantom the size of a human head is approximately equal to the absorbed radiation dose for fan-beam scanning.17 There have been reports that when the same area is imaged, the DAP in CBCT is similar to the CT dose index in multidetector CT without a moving cradle.18–21 The data acquired from group B images were approximately half of the data acquired from group A images. However, the DAP values observed in group B were reduced by approximately 70% compared with the patients in group A. The size of the detector was only 30 × 40 cm, and the magnification of C-arm CBCT is usually between 1.5 and 2. With 1.5 as an example, the maximal FOV in our study was only 40/1.5 = 27 cm. An FOV of 22 cm might be too small to image the head because some structures, such as the nose/ear, might generate truncation artifacts. In this study, the 2-cm FOV was meant to image the implanted stent rather than the whole brain. Not only was the radiation exposure reduced in group B, but the data transfer and reconstruction times were also shorter. These results imply that a 10-second acquisition time with 1 × 1 binning is beneficial to the patient undergoing a stent-assisted coil embolization technique. We therefore recommend the use of CBCT imaging for patients undergoing stent treatment of cerebral aneurysm to lower radiation exposure. Because DAP does not always indicate a reduction in effective patient dose, further study will be needed to confirm our initial findings.
The primary limitation of this study was the inability to qualitatively evaluate CBCT images of the deployed stents. Additionally, the small size of our patient sample was due, in part, to the difficulty in selecting only subjects who received a certain type of stent implant. As the quality of stents for neuroendovascular treatment continues to improve, the need to delineate stents with low radiation exposure will also increase.
Conclusions
In our study, CBCT phantom stent strut images with 10-second acquisition times and 1 × 1 binning showed significantly better CNR and FWHM values compared with images obtained using 20-second acquisition times and 2 × 2 binning. Clinical results showed that FWHM values did not differ significantly between a 10-second/1 × 1 and a 20-second/2 × 2 group. However, patients in the 10-second/1 × 1 group received approximately 70% less radiation exposure compared with the patients in the 20-second/2 × 2 group. On the basis of our current study, the benefits of 1 × 1 binning in diagnostic imaging make it a ready successor to standard 2 × 2 binning for gauging the stability of stents in stent-assisted coil embolization.
ABBREVIATIONS:
- CBCT
conebeam CT
- CNR
contrast-to-noise ratio
- FWHM
full width at half maximum
- DAP
dose-area product
Footnotes
Disclosures: Nobuyuki Sakai—UNRELATED: Grants/Grants Pending: Terumo; Payment for Lectures Including Service on Speakers Bureaus: Achieva, BioMedical Solutions, Daiichi Sankyo, Johnson & Johnson, Medtronic, NeuroVasc, Otsuka Pharma, Penumbra, Philips Healthcare, Rebound Therapeutics, Siemens, Terumo, Stryker.
Paper previously presented at: Annual Meeting of The Japanese Society for Neuroendovascular Therapy, November 19–21, 2015; Okayama, Japan.
References
- 1. Kwon OK, Kim SH, Kwon BJ, et al. Endovascular treatment of wide-necked aneurysms by using two microcatheters: techniques and outcomes in 25 patients. AJNR Am J Neuroradiol 2005;26:894–900 [PMC free article] [PubMed] [Google Scholar]
- 2. Mocco J, Snyder KV, Albuquerque FC, et al. Treatment of intracranial aneurysm with the Enterprise stent: a multicenter registry. J Neurosurg 2009;110:35–39 10.3171/2008.7.JNS08322 [DOI] [PubMed] [Google Scholar]
- 3. Yang X, Wu Z, Mu S, et al. Endovascular treatment of giant and large intracranial aneurysm using the Neuroform stent-assisted coil placement. Neurol Res 2008;30:598–602 10.1179/174313208X319017 [DOI] [PubMed] [Google Scholar]
- 4. Yavus K, Geyik S, Saatci I, et al. WingSpan stent system in the endovascular treatment of intracranial aneurysm: clinical experience with midterm follow-up results. J Neurosurg 2008;109:445–53 10.3171/JNS/2008/109/9/0445 [DOI] [PubMed] [Google Scholar]
- 5. Imamura H, Sakai N, Adachi H, et al. Long-term results of endovascular embolization of cerebral aneurysms. Journal of Neuroendovascular Therapy 2010;4:133–9 10.5797/jnet.4.133 [DOI] [Google Scholar]
- 6. van der Bom IM, Hou SY, Puri AS, et al. Reduction of coil mass artifacts in high-resolution flat detector conebeam CT of cerebral stent-assisted coiling. AJNR Am J Neuroradiol 2013;34:2163–70 10.3174/ajnr.A3561 [DOI] [PMC free article] [PubMed] [Google Scholar]
- 7. Higashida RT, Halbach VV, Dowd CF, et al. Initial clinical experience with a new self-expanding nitinol stent for the treatment of intracranial cerebral aneurysms: the Cordis Enterprise stent. AJNR Am J Neuroradiol 2005;26:1751–56 [PMC free article] [PubMed] [Google Scholar]
- 8. Tamatani S, Ito Y, Abe H, et al. Evaluation of the stability of aneurysms after embolization using detachable coils: correlation between stability of aneurysms and embolized volume of aneurysms. AJNR Am J Neuroradiol 2002;23:762–67 [PMC free article] [PubMed] [Google Scholar]
- 9. Kuriyama T, Sakai N, Niida N, et al. Dose reduction in cone-beam CT scanning for intracranial stent deployment before coil embolization of intracranial wide-neck aneurysms. Interv Neuroradiol 2016;22:420–25 10.1177/1591019916632489 [DOI] [PMC free article] [PubMed] [Google Scholar]
- 10. Patel NV, Gounis MJ, Wakhloo AK, et al. Contrast-enhanced angiographic cone-beam CT of cerebrovascular stents: experimental optimization and clinical application. AJNR Am J Neuroradiol 2011;32:137–44 10.3174/ajnr.A2239 [DOI] [PMC free article] [PubMed] [Google Scholar]
- 11. Benndorf G, Strother CM, Claus B, et al. Angiographic CT in cerebrovascular stenting. AJNR Am J Neuroradiol 2005;26:1813–18 [PMC free article] [PubMed] [Google Scholar]
- 12. Armstrong RA. When to use the Bonferroni correction. Ophthalmic Physiol Opt 2014;34:502–08 10.1111/opo.12131 [DOI] [PubMed] [Google Scholar]
- 13. Veldkamp WJ, Joemai RM, van der Molen AJ, et al. Development and validation of segmentation and interpolation techniques in sonograms for metal artifact suppression in CT. Med Phys 2010;37:620–28 10.1118/1.3276777 [DOI] [PubMed] [Google Scholar]
- 14. Abdoli M, De Jong JR, Pruim J, et al. Reduction of artefacts caused by hip implants in CT-based attenuation-corrected PET images using 2-D interpolation of a virtual sinogram on an irregular grid. Eur J Nucl Med Mol Imaging 2011;38:2257–68 10.1007/s00259-011-1900-3 [DOI] [PMC free article] [PubMed] [Google Scholar]
- 15. Zhao S, Robeltson D, Wang G, et al. X-ray CT metal artifact reduction using wavelets: an application for imaging total hip prostheses. IEEE Trans Med Imaging 2000;19:1238–47 10.1109/42.897816 [DOI] [PubMed] [Google Scholar]
- 16. Kachelrie M, Watzke O, Kalender WA. Generalized multi-dimensional adaptive filtering for conventional and spiral single-slice, multi-slice, and cone-beam CT. Med Phys 2001;28:475–90 10.1118/1.1358303 [DOI] [PubMed] [Google Scholar]
- 17. AAPM: Report No. 111: Comprehensive Methodology for the Evaluation of Radiation Dose in X-Ray Computed Tomography (2010). http://www.aapm.org/pubs/reports/RPT_111.pdf.html. Accessed October 15, 2017
- 18. Shope T, Gagne R, Johnson G. A method for describing the doses delivered by transmission x-ray computed tomography. Med Phys 1981;8:488–95 10.1118/1.594995 [DOI] [PubMed] [Google Scholar]
- 19. Mori S, Endo M, Nishizawa K, et al. Enlarged longitudinal dose profiles in cone-beam CT and the need for modified dosimetry. Med Phys 2005;32:1061–69 10.1118/1.1877852 [DOI] [PubMed] [Google Scholar]
- 20. Fahrig R, Dixon RL, Payne T, et al. Dose and image quality for a cone-beam C-arm CT system. Med Phys 2006;33:4541–50 10.1118/1.2370508 [DOI] [PubMed] [Google Scholar]
- 21. Khan AN, Shuaib W, Nikolic B, et al. Absorbed radiation dose in radiosensitive organs using 64- and 320-row multidetector computed tomography: a comparative study. Scientifica (Cairo) 2014;2014:305942 10.1155/2014/305942 [DOI] [PMC free article] [PubMed] [Google Scholar]


