

Summary
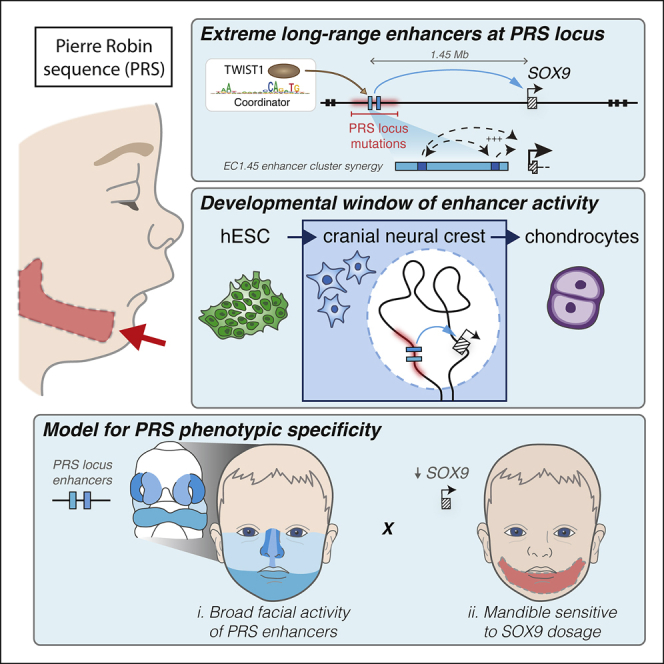
Non-coding mutations at the far end of a large gene desert surrounding the SOX9 gene result in a human craniofacial disorder called Pierre Robin sequence (PRS). Leveraging a human stem cell differentiation model, we identify two clusters of enhancers within the PRS-associated region that regulate SOX9 expression during a restricted window of facial progenitor development at distances up to 1.45 Mb. Enhancers within the 1.45 Mb cluster exhibit highly synergistic activity that is dependent on the Coordinator motif. Using mouse models, we demonstrate that PRS phenotypic specificity arises from the convergence of two mechanisms: confinement of Sox9 dosage perturbation to developing facial structures through context-specific enhancer activity and heightened sensitivity of the lower jaw to Sox9 expression reduction. Overall, we characterize the longest-range human enhancers involved in congenital malformations, directly demonstrate that PRS is an enhanceropathy, and illustrate how small changes in gene expression can lead to morphological variation.
Keywords: enhancer, enhanceropathy, Pierre Robin sequence, SOX9, gene dosage, long-range regulation, neural crest, craniofacial, transcription, non-coding mutation
Graphical Abstract
Highlights
-
•
Extreme long-range enhancer clusters overlap PRS patient mutations at the SOX9 locus
-
•
PRS enhancers drive stage-specific SOX9 expression in the cranial neural crest
-
•
Mandible development has heightened sensitivity to perturbation of SOX9 gene dosage
-
•
Deletion of mouse EC1.45 leads to quantitative changes in mandible morphology
Non-coding mutations over a megabase from SOX9 cause the craniofacial disorder Pierre Robin sequence (PRS). Long et al. leverage a human neural crest model to demonstrate that PRS is caused by loss of extreme long-range enhancers active during a restricted developmental window and explore mechanisms underlying the specificity of disease manifestations.
Introduction
Distal regulatory sequences called enhancers control gene transcription at a distance and play a critical role in directing developmental gene expression patterns (Long et al., 2016). Non-coding mutations are increasingly being implicated in human disease (Franke et al., 2016; Laugsch et al., 2019; Lupiáñez et al., 2015), and, in particular, perturbations of enhancers have been documented as being causative because of their effects on gene regulation during development (Spitz, 2016). Although mutations of protein-coding sequences often affect multiple tissues in which a given gene is active, mutations in non-coding regulatory regions can selectively perturb target gene expression in specific tissue contexts. For example, SOX9, an SRY (sex-determining region Y)-related HMG (high mobility group) box (SOX) transcription factor, plays numerous important roles during embryogenesis, including sex determination, chondrogenesis, and craniofacial development (Lee and Saint-Jeannet, 2011; Lefebvre and Dvir-Ginzberg, 2016). Heterozygous loss-of-function mutations in the SOX9 coding sequence cause a severe congenital disorder called campomelic dysplasia, which is associated with bowed long limbs, disorders of sex determination, and craniofacial defects (Wagner et al., 1994). Interestingly, SOX9 is the sole protein-coding gene within an unusually large, ~2-Mb topologically associating domain (TAD) (Bagheri-Fam et al., 2006; Gordon et al., 2009). Many non-coding mutations have been described within this gene desert, including large deletions, translocations, and duplications, that cause a range of defects that recapitulate distinct aspects, but not all features, of campomelic dysplasia, leading to the hypothesis that cell-type-specific enhancers are disrupted in these tissue-selective disorders (Baetens et al., 2017; Kurth et al., 2009; Sanchez-Castro et al., 2013). In some cases, the perturbed enhancers have been mapped and characterized; for example, an SRY-responsive regulatory element essential for sex determination (Gonen et al., 2018).
A cluster of large genomic deletions and translocation breakpoints at the centromeric far end of the SOX9 TAD are associated with isolated Pierre Robin sequence (PRS), a congenital craniofacial disorder characterized by a single primary phenotype: underdevelopment of the lower jaw or mandible (micrognathia) that leads to secondary phenotypes, including retraction of the tongue (glossoptosis), obstruction of the airway, and, with incomplete penetrance, horseshoe-shaped cleft palate (Robin, 1994; Tan and Farlie, 2013). This sequence of anomalies, in turn, results in feeding and breathing difficulties and failure to thrive (Rathé et al., 2015). It has been proposed that PRS-associated mutations perturb the function of key SOX9 long-range enhancers active during craniofacial development (Amarillo et al., 2013; Benko et al., 2009; Gordon et al., 2009, 2014); however, functional characterization of putative craniofacial enhancers and direct demonstration that SOX9 is the target gene are still lacking. Given the specificity of the developmental defects in PRS and the well-documented requirement for SOX9 function in the neural crest (Cheung and Briscoe, 2003; Mori-Akiyama et al., 2003; Spokony et al., 2002), we hypothesized that the centromeric far end of the SOX9 TAD harbors enhancers active in cranial neural crest cells (CNCCs), a transient population of multipotent progenitor cells that give rise to the majority of vertebrate craniofacial structures, including the jaw (Bronner and LeDouarin, 2012; Minoux and Rijli, 2010; Trainor et al., 2003).
Leveraging a well-characterized in vitro differentiation model of human CNCCs (hCNCCs) (Bajpai et al., 2010; Prescott et al., 2015; Rada-Iglesias et al., 2012), we uncover two clusters of hCNCC-specific enhancers overlapping PRS mutations and demonstrate that they regulate SOX9 transcription within a defined developmental window and over extremely large genomic distances of 1.45 Mb and 1.25 Mb, respectively. To model the sensitivity of craniofacial development to changes in Sox9 gene dosage, we generate an allelic series in mice with increasing severity of Sox9 perturbation. We propose a mechanism of disease etiology where two features of Sox9 regulation converge to confine disease phenotypes to the lower jaw. First, loss of the tissue-specific activity of PRS locus enhancers restricts Sox9 dosage perturbation to the developing facial structures, and second, heightened sensitivity of the lower jaw to Sox9 level reduction further confines PRS-associated malformations.
Results
Three Clusters of Candidate Human Cranial Neural Crest Enhancers Overlap Sequences Lost in PRS
Many large non-coding deletions identified in PRS patients map to the SOX9 locus but are mostly non-overlapping, suggesting the presence of multiple regulatory elements with non-redundant functions whose loss leads to similar phenotypic outcomes (Amarillo et al., 2013; Benko et al., 2009; Gordon et al., 2014). Additionally, numerous translocation breakpoints have been identified that displace much of the distal SOX9 gene desert away from the remainder of the locus (Figure 1A; Benko et al., 2009). To identify candidate hCNCC enhancer elements that map within regions of the SOX9 gene desert lost in PRS patients, we used chromatin immunoprecipitation sequencing (ChIP-seq) and assay for transposase-accessible chromatin using sequencing (ATAC-seq) datasets from in-vitro-derived hCNCCs (Prescott et al., 2015; this study; Figure 1A). Among the candidate enhancers identified within the SOX9 TAD, three enhancer clusters were located at the far centromeric end of the SOX9 gene desert upstream of the PRS translocation breakpoint region and overlapped with at least one of the large deletions seen in patients with PRS. Each cluster contained two or more discrete binding peaks for the general coactivator p300, was enriched for the active enhancer marks H3K27ac and H3K4me1, and corresponded to regions of open chromatin (Prescott et al., 2015; Figures 1A and 2A; Calo and Wysocka, 2013). All three putative enhancer clusters were located over 1 Mb upstream of the SOX9 gene (Figure 1A) and were named to reflect their genomic arrangement: enhancer cluster 1.45 (EC1.45) is 1.45 Mb upstream of SOX9, EC1.35 is 1.35 Mb upstream of SOX9, and EC1.25 is 1.25 Mb upstream of SOX9 (Figures 1A and 2A).
Figure 1.

Human Cranial Neural Crest-Specific Enhancers Are Associated with PRS Patient Mutations
(A) ChIP-seq and ATAC-seq for hESCs (top) and P4 hCNCCs (bottom) at the human SOX9 locus. Three putative hCNCC-specific ECs overlap the PRS locus: EC1.45, EC1.35, and EC1.25. PRS patient deletions (red), translocation breakpoints (blue), topological domains (TADs) (Dixon et al., 2012), and protein-coding genes are shown. Centro, centromeric; telo, telomeric.
(B) Capture-C from the SOX9 promoter (see anchor) in hESCs, neuroectodermal spheres (NECs), early (day 11) and late (P4) hCNCCs.
See also Figures S1 and S2.
Figure 2.

PRS Locus EC1.45 and EC1.25 Are Active in hCNCCs and during Mouse Craniofacial Development
(A) ChIP-seq and ATAC-seq for PRS locus putative enhancer clusters EC1.45 (p300 Peak1 and Peak2), EC1.35 (S1 and S2), and EC1.25 (S3–S6).
(B) Luciferase reporter assays for EC1.45, EC1.35 (S1 and S2) and EC1.25 (S3–S6) in hCNCCs (left) and hESCs (right).
(C) Schematic outlining craniofacial domains at E9.5 and E11.5. BA1-2, branchial arch 1-2; FNP, frontonasal prominence; LNP, lateral nasal process; MdP, mandibular process; MNP, medial nasal process; MxP, maxillary process.
(D) In situ hybridization (ISH) for Sox9 at E9.5 and E11.5.
(E) Mouse LacZ reporter assay for EC1.45, EC1.35 (S1 and S2), and EC1.25 (S3–S6 tested individually) at E9.5 and E11.5.
(F) HREM for an EC1.45 LacZ reporter embryo at E11.5 (frontal view, top; parasagittal section, bottom). White arrow, activity in the MdP.
Importantly, the three clusters of putative enhancers were not marked by active chromatin marks in human embryonic stem cells (hESCs) (Figure 1A) or other available profiled cell types (Figure S1A), except for human fetal craniofacial tissues (Figure S1B; Wilderman et al., 2018), suggesting that the putative enhancers exhibit cell-type-specific activity in the neural crest and developing face. Indeed, activation of these putative enhancers coincided with a strong increase in SOX9 expression during transition from hESCs through neuroectodermal spheres (NECs) to hCNCCs (Figures S1C–S1E). Therefore, epigenomic signatures identified three putative hCNCC ECs overlapping sequences lost in PRS patients.
PRS Region Candidate ECs Make Long-Range Contacts with the SOX9 Promoter
To determine whether PRS region candidate ECs make contact with the SOX9 promoter over more than a megabase of genomic space, we performed SOX9 promoter-anchored Capture-C assays (Davies et al., 2016) in hESCs, NECs, early-migrating hCNCCs (hereafter called early hCNCCs), or late-passage hCNCCs (hereafter called late hCNCCs) (Prescott et al., 2015). In hESCs, the SOX9 promoter formed contacts that spanned the previously defined TAD (Dixon et al., 2012, 2015), with the majority of interactions confined to the telomeric side, and also showed frequent interactions with CTCF (CCCTC-binding factor)/cohesin sites across the locus (Figures 1A, 1B, and S1F). A strong shift in interaction frequencies was apparent during hCNCC differentiation. In particular, extreme long-range interactions with the EC1.45, EC1.35, and EC1.25 putative ECs at the far centromeric end of the TAD substantially increased in late hCNCCs compared with hESCs (Figures 1B, S2A, and S2B), but the dynamics for each EC were distinct. Specifically, EC1.35 already contacted the SOX9 promoter in hESCs (Figures S2A and S2B) and, notably, was occupied by CTCF and cohesin in hESCs and hCNCCs. This was mirrored by a similarly bound CTCF site 2 kb upstream of the SOX9 promoter, suggesting that these genome-organizing proteins may facilitate a developmentally stable long-range interaction between the SOX9 promoter and the distal region of the TAD (Arzate-Mejía et al., 2018; Guo et al., 2015; Ren et al., 2017; Schoenfelder and Fraser, 2019; de Wit et al., 2015). In comparison, EC1.25 and EC1.45 did not interact frequently with the SOX9 promoter in hESCs by Capture-C (Figures S2A and S2B), and only in early and late hCNCCs did the contact frequency increase.
To confirm these cell-type-specific interactions, we performed reciprocal Capture-C experiments anchored at each of the three PRS region candidate ECs. Again, we observed an increase in contact frequency with the SOX9 promoter in late hCNCCs compared with hESCs (Figure S2C). Importantly, Capture-C performed from other gene promoters in nearby TADs, including KCNJ2, COG1, and SDK2, did not reveal interaction with the PRS region putative ECs and did not cross the SOX9 TAD boundaries (Figure S1F). The extreme long-range candidate enhancers at the PRS locus make selective contacts with the SOX9 gene promoter in a disease-relevant cell type.
Two PRS Locus Candidate ECs Drive Reporter Gene Expression in hCNCCs and in Developing Mouse Facial Structures
To investigate the regulatory potential of the putative PRS region ECs, we tested their capacity to activate transcription in a luciferase assay. We cloned the entire human EC1.45 region, including both p300 peaks, upstream of a luciferase reporter gene with an SV40 minimal promoter. Given their greater size, we combined the two p300 peaks for EC1.35 (S1 and S2) and the four p300 peaks for EC1.25 (S3–S6) (Figure 2A). EC1.45 and EC1.25 were found to be extremely strong drivers of transcription in hCNCCs, rivalling the activity of the viral SV40 enhancer positive control (Figure 2B, left panel). However, despite harboring epigenetic marks suggestive of active enhancer identity (albeit weaker than EC1.45 or EC1.25), EC1.35 was not active in the luciferase assay, suggesting that it is not a strong driver of transcription, at least in the examined context. As expected, none of the three ECs was active in hESCs (Figure 2B, right panel).
To characterize the spatiotemporal activity of the PRS locus enhancers during development, we utilized an in vivo LacZ enhancer reporter assay at two mouse embryonic stages, embryonic days 9.5 (E9.5) and E11.5 (Figure 2C). Human EC1.45 and a number of the constituent p300 peaks for human EC1.25 were active during mouse development, exhibiting reproducible activity patterns that mirrored distinct spatiotemporal subdomains of endogenous SOX9 craniofacial expression (Figure 2D). This included activity in embryonic domains that will form the mandible: the first branchial arch at E9.5 (i.e., S3 and S5 of EC1.25) and the mandibular process at E11.5 (i.e., EC1.45 and S3 and S6 of EC1.25; Figures 2C and 2E and S3A–S3F; Tables S1 and S2). Mandibular activity of EC1.45 was further confirmed by high-resolution episcopic microscopy (HREM) (Figures 2F, S3G, and S3H). Similar to the in vitro luciferase assay, human EC1.35 did not display activity in the developing facial structures nor in any other tissues at either developmental stage (Figure 2E).
Heterozygous Ablation of PRS Region ECs Causes an Allele-Specific Reduction in SOX9 Expression
To directly characterize the contribution of the human EC1.45 and EC1.25 enhancers to SOX9 gene regulation during hCNCC differentiation, we generated hESC lines with heterozygous deletions of EC1.45 or EC1.25 (Figures 3A and S4A–S4D; Ikeda et al., 2018). To determine the effect of these deletions on SOX9 expression, we developed an allele-specific reverse transcriptase digital droplet PCR (RT-ddPCR) assay that distinguished a single-nucleotide polymorphism (SNP) in the 3′ UTR of the SOX9 gene (T or C) (Figures 3B and S4E) and linked this in cis to the presence or absence of EC1.45 or EC1.25 via genome-wide phasing (Table S3).
Figure 3.

Heterozygous PRS Enhancer Deletion In Vitro Affects SOX9 Expression during a Restricted Window of Development
(A) Overview of differentiation, including early hCNCCs at day 11, passage 1–2 early hCNCCs, passage 3–4 late hCNCCs, and chondrocytes on days 5 and 9.
(B) Schematic of allele-specific RT-ddPCR, indicating primers and LNA probes (HEX/FAM) for the T/C SNP (rs74999341) in the SOX9 3′ UTR. Shown are wild-type (left) and heterozygous EC1.45 deletion (right).
(C) RT-ddPCR for wild-type (green boxplot) and EC1.45 heterozygous deletion (red), plotting SOX9 C:T expression ratio.
(D) ATAC-seq reveals hCNCC-specific accessibility for EC1.45. Shown are representative traces from 3–4 replicates.
(E) Luciferase assay for late hCNCCs (left) and chondrocytes (right). A COL2A1 enhancer is active in both cell types, whereas EC1.45 and EC1.25 become inactive in chondrocytes.
During CNCC differentiation, the two alleles of SOX9 were expressed at nearly equivalent levels in wild-type cells (Figures 3C and S4F, green boxplots) regardless of changes in overall SOX9 expression (Figures S1C–S1E). In contrast, enhancer deletion was associated with a striking allelic skew in SOX9 expression, indicating that loss of EC1.45 or EC1.25 disrupted normal regulation of SOX9 (Figures 3C and S4F, red boxplots). The effect of EC1.45 enhancer deletion on SOX9 expression was larger than that of EC1.25 deletion, especially in passage 3 (P3)–P4 late hCNCCs, where it led to 50%–55% lower expression of the mutated allele. This greater effect on SOX9 expression in late hCNCCs was in keeping with an observed ~4.5-fold increase in EC1.45 activity between P2 and P4 hCNCCs (Figure S4G). In summary, EC1.45 and EC1.25 are required for normal expression of SOX9 in the cranial neural crest, thus establishing some of the longest-range functional enhancer-gene interactions reported to date in the human genome.
PRS Region Enhancers Are Decommissioned in Cranial Chondrocytes
SOX9 has two sequential critical roles in development of the mandible; first in specification and migration of CNCCs and second during chondrogenesis and formation of Meckel’s cartilage, the developmental precursor of the lower jaw (Amano et al., 2010; Wyganowska-Świa̧tkowska and Przystańska, 2011). We therefore tested whether EC1.45 and EC1.25 also regulate SOX9 expression in cranial chondrocytes derived from hCNCCs (Figure 3A; differentiation validated in Figures S4H and S4I). Remarkably, cranial chondrocytes derived from hCNCCs heterozygous for EC1.45 or EC1.25 enhancer deletions did not show allelic skew in SOX9 expression, indicating that the requirement for these enhancers in regulation of SOX9 transcription is highly cell type restricted (Figures 3C and S4F). In agreement, ATAC-seq analysis revealed that EC1.45 and EC1.25 enhancers lost hypersensitivity during differentiation of hCNCCs to chondrocytes (Figures 3D and S4J), and luciferase reporter assays further confirmed that the regulatory potential of EC1.45 and EC1.25 was sharply reduced in chondrocytes (Figure 3E). Together, these data reveal that, despite high SOX9 expression in chondrocytes, the PRS-associated enhancers have restricted and transient activity during CNCC development and become decommissioned during chondrogenesis, defining a developmental window for disease etiology.
Two Short Segments Act Synergistically to Drive the Majority of EC1.45 Enhancer Activity
To interrogate sequence features critical for hCNCC-specific activity of the PRS ECs, we focused on EC1.45, whose deletion is associated with greater allelic imbalance in SOX9 expression in hCNCCs. First, we tested the enhancer activity of the two constituent EC1.45 p300 peaks (Peak1 and Peak2; Figure 4A) in luciferase reporter assays. Intriguingly, individually, the two p300 peaks exhibited only weak enhancer activity, whereas Peak1+Peak2 led to activation greater than the sum of the two regions, indicative of synergistic activity (Figures S5A–S5C). To further refine regions of enhancer activity within EC1.45, we performed a tiling deletion screen across Peak1+Peak2 (Figure S5A) and identified two minimal regions (overlapping deletions 3–4 in Peak1 and deletions 10–11 in Peak2) whose loss lead to a significant reduction in luciferase reporter activity, min1 and min2, respectively. Importantly, min1+min2 recapitulated the activity and synergy of Peak1+Peak2 and accounted for nearly the full activity of EC1.45 (Figures 4B and S5B). Of interest, three of the constituent putative enhancers from EC1.25 also act independently as enhancers in late hCNCCs, whereas combination of all four individual elements appears to similarly drive synergistic activation of luciferase expression (Figure S5C). Unsurprisingly, the two constituent EC1.35 p300 peaks were not active enhancers by luciferase assay (Figure S5C). Therefore, we identify two core enhancer elements within EC1.45 (and three within EC1.25) that are weak enhancers individually but work together in a robustly synergistic manner to activate gene expression.
Figure 4.

Dissection of EC1.45 Enhancer Region Uncovers a Core Role of the Coordinator Motif and TWIST1 Binding in Developmental Enhancer Regulation
(A) TWIST1 ChIP-seq peaks (marked under track) at EC1.45 overlap p300 Peak1 and Peak2 and minimally active sequences (min1 and min2).
(B) Luciferase assay for EC1.45 min1 and min2, tested separately and combined, along with Coordinator mutant sequences. Left: schematic of the constructs.
(C) Coordinator motif (top; Prescott et al., 2015) compared with the motif enriched at TWIST1 binding sites in hCNCCs (bottom).
(D) Luciferase assay for the heterologous enhancer sequence for human min1 plus vertebrate min2. Left: schematic of the constructs. A scatterplot depicts the luciferase signal compared with the sum of Coordinator scores (ANOVA p = 0.00035; right).
(E) TWIST1 is upregulated during hCNCC differentiation and reduced in chondrocytes (fragments per million [FPM]).
(F) Schematic of plasmids, primers, and probes for ChIP-ddPCR for wild-type (WT) and Coordinator mutant (4x mut) min1+min2 plasmids. F, forward; R, reverse.
(G) TWIST1 ChIP-ddPCR for P4 late hCNCCs transfected with the plasmids in (F), normalized to input, and WT adjusted to 1. Two biological replicates are depicted.
See also Figure S5.
Coordinator Motifs Are Essential for Activity and Synergy of EC1.45 Enhancers
In our previous study investigating sequence features associated with divergence of enhancer activity between human and chimpanzee CNCCs, we identified a long bipartite sequence that we called “Coordinator” (Prescott et al., 2015; Figure 4C, top). Of all motifs tested, Coordinator had the greatest effect on surrounding chromatin features and affected the highest number of enhancers (Prescott et al., 2015), suggesting a privileged role in establishment of enhancer competence in CNCCs. Strikingly, there are seven Coordinator motifs within the EC1.45 Peak1+Peak2 region, four of which fall within min1+min2 (Figure S5D). Mutations of all four motifs in min1+min2 diminished activity to the level of the empty vector, while mutation of the Coordinator sequence in min1 brought the activity of min1+min2 down to a level similar to min2 alone (Figure 4B). Similarly, mutation of the three Coordinator sequences in min2 brought the activity of min1+min2 down to a level similar to min1 alone (Figure 4B), indicating that the Coordinator motif is essential for the activity and synergistic function of the EC1.45 enhancers. A mutation screen of each of the seven motifs within the Peak1+Peak2 region further supported that the most substantial contribution of Coordinator motifs to overall enhancer activity is within the min1 and min2 regions and revealed that mutation of all seven Coordinator motifs led to a reduction of activity below the baseline level of the minimal promoter control (p = 0.027). Notably, this suggests that repressive sequence features exist within the enhancer region that are unmasked by loss of Coordinator sites (Figure S5E) and may be harbored within the del1-del2 region (Figure S5A; p < 0.0063).
Coordinator Motif Content in the Deeply Conserved Region of EC1.45 Correlates with Enhancer Activity across Species
Interestingly, EC1.45 min2 is conserved at the sequence level from human to the lobe-finned fish coelacanth across ~400 million years of evolution (Figures S5F and S5G). To examine the relationship between the Coordinator motif content (estimated from Fimo; Figure S5H; Grant et al., 2011) of orthologous min2 regions and their enhancer activity, we cloned the min2 sequences from mouse, opossum, platypus, chicken, lizard, frog, and coelacanth downstream of the human min1 sequence and assessed their combined activity by luciferase assay (Figure 4D). Strikingly, an increased Coordinator score was associated with increased enhancer activity (Figure 4D, right panel). These changes in activity did not simply recapitulate the phylogenetic relationship between the examined species because, for example, the most distantly related coelacanth sequence was relatively high in Coordinator content and enhancer activity, suggesting that the presence of the Coordinator motif rather than merely evolutionary drift drive the observed changes in activity.
TWIST1 Regulates EC1.45 Enhancers in a Coordinator-Dependent Manner
We next sought to uncover the trans-regulatory inputs that control EC1.45 activity. The Coordinator sequence resembles an E-box- and Homeobox-like motif, separated by 6 bp, although the factors that bind are so far unknown. E-box motifs are recognized by basic helix-loop-helix (bHLH) transcription factors, and we noted that TWIST1 was among the most highly expressed bHLH factors in hCNCCs. TWIST1 levels tightly coincided with EC1.45 enhancer activity, being strongly upregulated during hCNCC differentiation (with highest expression in late hCNCCs) and downregulated during chondrogenesis (Figure 4E; compare with to EC1.45 enhancer activity in Figure 3C). TWIST1 is also known to play an essential role in neural crest biology and craniofacial development (Bildsoe et al., 2009; Parsons et al., 2014; Qin et al., 2012). Furthermore, Twist1 inactivation in NCCs populating the mandibular arch in mice leads to micrognathia and cleft palate (Zhang et al., 2012), phenotypes overlapping those seen in PRS.
Genome-wide analysis of TWIST1 ChIP-seq performed in hCNCCs revealed that the top enriched sequence matched the Coordinator motif (Figure 4C, bottom), followed by a canonical TWIST1 E-box motif (Figure S5I), suggesting that, in hCNCCs, a substantial fraction of TWIST1 chromatin binding occurs in the context of the Coordinator motif. In keeping with the presence of multiple Coordinator motifs, TWIST1 binds to both EC1.45 constituent enhancers in hCNCCs (Figure 4A). To assess whether this binding is dependent on the Coordinator sequence, we developed an episomal TWIST1 ChIP-ddPCR assay that distinguished transfected plasmids containing wild-type or Coordinator mutant min1+min2 sequences (Figure 4F). In this assay, the strong TWIST1 binding observed for the wild-type min1+min2 sequence was greatly diminished by mutation of the Coordinator sequences (Figure 4G). These results establish that TWIST1 binds to the min1 and min2 regulatory sequences in CNCCs in a Coordinator motif-dependent manner.
Mouse Mandibular Development Is Highly Sensitive to Changes in Sox9 Gene Dosage
With the identification of two ECs at the PRS locus that regulate SOX9 gene dosage in hCNCCs, we next turned to mouse models to probe the morphological effect of Sox9 dosage perturbation on craniofacial development. Previous work showed that heterozygous deletion of Sox9 recapitulates many aspects of campomelic dysplasia (Bi et al., 2001). To characterize the effect of neural crest-specific Sox9 haploinsufficiency, we crossed mice carrying a floxed (F) Sox9 allele (Akiyama et al., 2002) with mice carrying the second-generation Wnt1::Cre2 driver (C) that directs Cre expression in the neural crest just before or during delamination from the neural tube (Lewis et al., 2013; Figure S6A). Many heterozygous Wnt1::Cre2;Sox9F/+ (CF; Cre Flox) animals died in the neonatal period from postnatal day P0–P12 or failed to gain weight at the same rate as their wild-type siblings (Figures 5A and S6B). To investigate the cause of neonatal lethality and reduced fitness, we performed micro-computed tomography (microCT) to monitor craniofacial skeletal development at E18.5 (Figure 5B). Clefting was detected in the maxilla and palatine bones in 50% of mutant embryos, a phenotype in PRS patients thought to be a secondary consequence of mandibular hypoplasia (Tan and Farlie, 2013). Although this link remains to be established in the mouse, the observed cleft palate is most likely the cause of postnatal lethality because of feeding or breathing difficulties (Tan and Farlie, 2013).
Figure 5.

Conditional Neural Crest-Specific Sox9 Heterozygous Mutant Embryos Have Craniofacial Defects and Fail to Thrive in the Neonatal Period
(A) Boxplot of postnatal growth rate in grams per day for mutant Wnt1::Cre2;Sox9F/+ (CF) and WT Sox9F/+ (F) pups (ANOVA p = 1.793e−07).
(B) MicroCT scans of E18.5 WT (top) and mutant (bottom) embryos, maximum intensity projection (left), and segmented hemimandibles (right).
(C) Boxplot of distance measurements for WT (F) and mutant mandibles with (CF cleft) and without (CF) cleft palate. Data are from two litters (17 embryos). Statistical test: ANOVA.
(D) PCA of mandible landmarks following Procrustes analysis. Mutant (CF) and WT (F) mandibles are separated by PC1 regardless of clefting.
(E) Morphometric landmarks for WT (top, F) and mutant (bottom, CF) mandibles projected onto a thin plate spline. All 18 landmarks differed significantly between WT and mutant mandibles by Hotelling test (p < 0.0006).
(F) Boxplot of distance measurements for WT (F) and mutant midfacial elements with (CF cleft) and without (CF) cleft palate. PM, premaxilla; Mx, maxilla; Pal, palatine bones. Statistical test: ANOVA.
(G) PCA of skull landmarks following Procrustes analysis. Mutant skulls without cleft (CF) cluster with wild-type skulls (F).
(H) Wireframe outline of nasal bone, PM, Mx and Pal for half a skull for WT (F, dark pink) and mutant skulls without cleft (CF, yellow, left) or with cleft (CF cleft, brown, right).
For PCA, different shape markers represent independent litters. See also Figure S6 and Table S4.
To further quantify craniofacial defects, we performed morphometric landmarking (Ho et al., 2015; Welsh et al., 2018), focusing first on the mandible because micrognathia is a diagnostic characteristic of PRS as well as a feature of campomelic dysplasia (Foster, 1996; Robin, 1994; Tan and Farlie, 2013; Figures S6C and S6D). From this analysis, we quantified a reduction in mandible length for Wnt1::Cre2;Sox9F/+ embryos and gross changes in the shape of the ramus, including a dramatically hypoplastic coronoid process and reduced condylar process width, recapitulating aspects of human patient phenotypes with SOX9 haploinsufficiency (Figure 5C). Notably, these differences in mandibular shape and size were fully penetrant in all embryos analyzed, regardless of the presence of cleft palate, as illustrated by principal-component analysis (PCA) based on calculated Procrustes distance (Figures 5C and 5D). The dramatic changes in mandibular morphology can be illustrated by projecting mandibular landmarks onto a thin plate spline (Figure 5E).
We next analyzed the remaining skull morphology (Figures S6E–S6G), and interestingly, although Wnt1::Cre2;Sox9F/+ mutant embryos with a cleft palate displayed a number of measurable skull anomalies, we did not detect significant alterations in skull length or width or midfacial length in mutant embryos without a cleft (Figures 5F and S6H). Indeed, PCA revealed that skull shapes of non-clefted Wnt1::Cre2;Sox9F/+ animals cluster with those of the wild-type embryos and away from the clefted heterozygotes (Figure 5G), with no significant change in overall skull shape (Figure 5H). Therefore, despite the broad expression and function of Sox9 throughout developing craniofacial structures, the mandible exhibits heightened and fully penetrant sensitivity to a 50% reduction of Sox9 gene dosage during mouse neural crest development compared with other craniofacial structures where phenotypes are of variable expressivity.
The Mouse Orthologous EC1.45 Sequence Exhibits Conserved Spatiotemporal Activity Pattern but Weakened Contribution to Sox9 Expression Relative to Human EC1.45
To assess whether the spatiotemporal activity of the EC1.45 and EC1.25 elements was conserved for the orthologous mouse sequences (located 1.21 Mb and 1.04 Mb from the mouse Sox9 promoter, respectively; for clarity, we refer to these regions as mEC1.45 and mEC1.25), we again utilized in vivo LacZ reporter assays. Similar to the human sequence, mEC1.45 was active in the frontonasal prominence at E9.5 and also in the maxillary and mandibular processes and limb buds at E11.5 (Figures 6A, 6B, S7A, and S7B). Of note, a sub-region of this sequence was tested previously in the VISTA Enhancer Browser (mm628) (Visel et al., 2007; Figures S7A and S7C). In contrast, for the three human EC1.25 constituent enhancers with craniofacial activity (Figure 2E), there was no reproducible activity for mouse orthologous S3 and S5 enhancers and reduced craniofacial activity for the S6 ortholog at E11.5 in a domain not including precursors of the mandible (Figure S7D). To compare the activity of human EC1.45 and its mouse ortholog in a more quantitative assay, we performed parallel luciferase assays in hCNCCs. Although mEC1.45 is indeed an active enhancer in hCNCCs, it is a much less potent activator of luciferase expression than the human ortholog (around 15-fold lower), indicating a divergence in enhancer strength (Figure 6C), consistent with reduced Coordinator content for mouse min2 (Figures 4D and S5H).
Figure 6.

Reduction in Sox9 Activity Affects Mouse Craniofacial Development in a Dose-Dependent Manner
(A) Schematic of mouse orthologous mEC1.45 with liftover of human EC1.45, Peak1, Peak2, min1, and min2 sequences and human-to-mouse MultiZ alignment.
(B) Mouse LacZ reporter assay for mEC1.45 at E11.5.
(C) Luciferase assay for human EC1.45 and mouse mEC1.45.
(D) Location of single guide RNAs (sgRNAs) and founder 1 and 2 mEC1.45 deletions (aligned with A).
(E) RT-ddPCR for Sox9 from WT and mEC1.45del/+ dissected E11.5 craniofacial tissues, plotted as C:G allelic ratio, mEC1.45 deleted on the C allele. t-test:∗p < 0.05, ∗∗p < 0.01.
(F) Schematic of Sox9 heterozygous conditional knockout Wnt1::Cre2;Sox9F/+ (CFW) and compound heterozygous Wnt1::Cre2;Sox9F/mEC1.45del (CFD) mice with Sox9 deleted in CNCCs on one allele and mEC1.45 deleted on the other. Purple triangles, loxP sites; neo, neomycin resistance.
(G) Boxplot of postnatal growth rate (P20–P25, grams per day) for CFW and CFD animals. ANOVA p = 0.01676.
(H) Landmarks for CFW (top) and CFD (bottom) mandibles projected onto a thin plate spline. Landmarks that differ significantly by Hotelling test are highlighted in red (p < 1E−04).
(I) PCA plot of mandible landmarks 12 and 13 following Procrustes analysis at E18.5 for 5 litters (23 embryos) of CFW (yellow) and CFD (brown) embryos.
(J) Procrustes-transformed average mandible wireframes for WT (dark pink, FW), CFW (yellow), and CFD (brown) embryos.
(K) Measurements of width and length of the condylar process for CFW (yellow) and CFD (brown) mandibles. For condylar width, ANOVA p = 1.52E−07. For condylar length, ANOVA p = 1.11E−04.
(L) As for (K); two measurements of mandible length; 2–13, ANOVA p = 0.00143; 4–9, ANOVA p = 0.00687.
(M) PCA plot of all mandible landmarks following Procrustes analysis for WT (mEC1.45+/+, blue, WW) and homozygous mutant (mEC1.45del/del, orange, DD) embryos at E18.5 for 5 litters (32 embryos).
(N) Landmarks for WW and DD mandibles projected onto a thin plate spline. Landmarks that differ significantly by Hotelling test are highlighted in pink (p < 0.05) and red (p < 1E−05).
(O) Boxplot of postnatal growth rate (P20–P25, g/day) for WW and DD embryos. Two replicate groups plotted as residuals of linear regression; ANOVA p = 0.01473.
For PCA plots, different shape markers represent independent litters. See also Figure S7 and Tables S1 and S2.
Based on the conserved, albeit weak, activity of mEC1.45, we performed pronuclear injection of CRISPR-Cas9 ribonucleoprotein (RNP) complexes to target the region for deletion (Figure 6D) and established two distinct founder lines (Figures 6D, S7E, and S7F). To determine the effect of mEC1.45 deletion on Sox9 expression, we crossed mEC1.45del/+ FVB mice with wild-type C57BL/6J mice, dissected craniofacial processes from embryos at E11.5 and performed allele-specific RT-ddPCR for Sox9 utilizing strain-specific SNPs (Figure S7G). Analysis of Sox9 expression in the combined medial nasal process (MNP) and lateral nasal process (LNP), maxillary process (MxP), and mandibular process (MdP) revealed that in wild-type embryos, Sox9 was expressed at similar levels from the FVB and C57BL/6J alleles (Figure 6E, green boxplots). In contrast, in mEC1.45del/+ embryos, Sox9 expression was significantly reduced for the FVB allele carrying the enhancer deletion, with the greatest reduction observed for the MdP (Figure 6E, red boxplots; p < 0.032). Consistent with the weaker activity of mEC1.45 compared with human, deletion of mEC1.45 caused quantitatively milder (8% in the MNP/LNP, 12% in the MxP, and 13% in the MdP) reduction in Sox9 expression from the mutant allele compared with a much greater reduction of SOX9 expression in EC1.45del/+ late hCNCCs (~50%–55%). At an earlier stage of development, E9.5, we also observed a modest reduction in Sox9 expression from the mEC1.45del mutant allele, with the most significant effect seen for the frontonasal prominence (FNP), consistent with the enhancer activity pattern at this stage (Figures S7B and S7H). Therefore, although the spatiotemporal activity of mEC1.45 is conserved, there is a substantially diminished strength of activity and input into Sox9 expression compared with the human sequence.
Deletion of Mouse Orthologous EC1.45 Affects Mandible Morphology and Exacerbates PRS-like Phenotypes Associated with Sox9 Heterozygosity
Considering the overall weaker regulatory activity of mEC1.45 compared with human, we chose a sensitized background strategy to first assess a possible function of mEC1.45 in craniofacial development. We therefore crossed Wnt1::Cre2;mEC1.45del/+ females and Sox9F/F males and compared Wnt1::Cre2;Sox9F/mEC1.45del compound heterozygous mice (CFD [Cre Sox9-Flox Delete-mEC1.45]), for which all Sox9 transcripts in CNCCs and derivatives are expressed from the allele with mEC1.45 deleted (Figure 6F) to Wnt1::Cre2;Sox9F/+ conditional Sox9 knockout animals (CFW [Cre Sox9-Flox Wild-type-mEC1.45]), for which the remaining allele expressing Sox9 is wild-type. In this sensitized setting, we may predict exacerbated phenotypes compared with those seen in conditional Sox9 heterozygotes.
We initially weighed surviving pups up to weaning and observed a decreased growth rate for compound mutant (CFD) animals compared with Sox9 heterozygous (CFW) animals (Figure 6G). We next performed microCT and landmarking for E18.5 mandibles from the same cross, and Procrustes analysis followed by a Hotelling test revealed a landmark at the condylar process as most morphometrically distinct between genotypes (p < 1e–04, Figure 6H). Indeed, PCA analysis using landmarks at the condylar process clearly separated mandibular morphology for CFW and CFD embryos (Figure 6I). These results show that additional loss of the mEC1.45 enhancer exacerbates the changes in mandible morphology observed in the conditional heterozygous Sox9 mutant (Figures 5E and 6J). Furthermore, quantification of condylar process length and width revealed a reduction for CFD compared with CFW embryos (p < 1.1e−4, ANOVA; Figure 6K), whereas overall mandible length was also reduced by 3%–5% (p < 0.007, ANOVA; Figure 6L). Therefore, ablation of a developmental EC that intersects a human disease locus exacerbates PRS-like phenotypes in a sensitized genetic background.
To determine whether mEC1.45 enhancer deletion alone, which, even in a homozygous setting, is expected to cause only a 13% reduction in Sox9 expression (Figure 6E), results in altered jaw morphology, we performed microCT analysis for E18.5 embryos obtained from a cross between heterozygous mEC1.45del/+ animals. Using all 18 mandibular landmarks, we were able to separate the wild-type (WW) and mEC1.45 homozygous knockout (DD) embryos by PCA, indicating a reproducible phenotypic alteration of mandibular shape when the mEC1.45 enhancer is ablated (Figure 6M). A Hotelling test again revealed that the ramus was the mandibular structure most affected by changes in Sox9 dosage (Figure 6N). Although milder, these alterations in mandibular ramus morphology are reminiscent of phenotypes observed in PRS patients, as quantified by a number of studies (Bienstock et al., 2016; Chen et al., 2015; Chung et al., 2012; Suri et al., 2010; Susarla et al., 2017; Volk et al., 2020; Zellner et al., 2017; Table S4; Figure S6C). Finally, to address whether enhancer knockout results in failure to thrive, we weighed pups up to weaning age (P20–P25) and detected a reduction in weight gain for mEC1.45 knockout animals (Figure 6O). Collectively, these data show that even a subtle reduction in gene dosage, caused by enhancer loss, can lead to alterations of craniofacial morphology and result in reduced ability of an organism to thrive.
Discussion
Given the phenotypic overlap between craniofacial abnormalities of campomelic dysplasia and PRS, it had been long speculated, but not formally demonstrated, that regulatory elements harbored by the PRS region deletions might regulate SOX9 (Amarillo et al., 2013; Benko et al., 2009; Gordon et al., 2009, 2014). Furthermore, several distinct hypotheses have been put forth regarding the cellular origins of the disease (Tan et al., 2013). In this study, we shed light onto these long-standing questions, identifying and characterizing two clusters of enhancers 1.25 and 1.45 Mb upstream of the SOX9 gene that fall within the PRS locus, are active during craniofacial development, make long-range contacts with the SOX9 promoter, and dynamically regulate its expression during cranial neural crest development (Figures 7A and 7B). Importantly, these enhancers become inactive following hCNCC differentiation to chondrocytes, defining a developmental window for the etiology of craniofacial phenotypes observed in PRS (Figure 7A).
Figure 7.

Summary of PRS Locus Enhancer Activity with a Proposed Model for PRS Etiology and Associated Neanderthal Differentially Methylated Region (DMR) Evolution
(A) A model of EC1.45 and EC1.25 hCNCC-specific regulation of SOX9 expression at extremely long distance followed by decommissioning in chondrocytes. A Neanderthal-specific hypomethylated region (HMR) overlaps EC1.45. Two minimal elements in EC1.45 have synergistic activity; i.e., (min1+min2) > (min1)+(min2). Coordinator motifs in min1 and min2 sequences are central for their activity and are bound by TWIST1.
(B) EC1.45 and EC1.25 are active in the developing face.
(C) A model for PRS etiology where by two features converge to confine disease phenotypes to the lower jaw.
(D) Phylogenetic tree of the inferred regulatory evolution for an EC1.45 Neanderthal-specific hypomethylated region (HMR, green). From left to right: anatomically modern humans (AMHs), Denisovans, Neanderthals, and chimpanzees. mya, million years ago.
See also Figure S6.
In some enhanceropathies, a number of patient-specific mutations overlap to reveal a single minimal element that is disrupted in the disorder (e.g. Gonen et al., 2018; Kortüm et al., 2011). In contrast, many of the PRS deletions described to date are non-overlapping and harbor one or the other EC identified here (Amarillo et al., 2013; Benko et al., 2009; Gordon et al., 2014). Interestingly, PRS patients with translocation breakpoints, in which both EC1.25 and EC1.45 are lost, appear to display more severe phenotypes (Benko et al., 2009). This suggests that loss of distinct enhancers that quantitatively affect SOX9 dosage in CNCCs can lead to similar disease outcomes, whereas loss of the broader regulatory region via chromosomal translocation can have an additive effect on both SOX9 gene dosage and lower jaw morphology. Indeed, our mouse modeling revealed that lower jaw development is sensitive to even small perturbations in Sox9 gene dosage, with a range of phenotypes of increasing severity observed over a range of reductions in Sox9 expression (Figures 5 and 6).
In our analysis of the 1.45 Mb EC, the two constituent p300-binding regions within EC1.45 are individually weak enhancers but display a striking combinatorial synergy far greater than the sum of the individual activities (Figure 7A). Previous studies looking at the relationship between multiple enhancers within super ECs have supported additive or redundant rather than synergistic activity of the constituent enhancer elements (Dukler et al., 2016; Hay et al., 2016; Moorthy et al., 2017; Shin et al., 2016).
The regulatory elements identified in our study represent the longest-range developmental enhancers involved in congenital malformations that have been described to date, at a distance of nearly 1.5 Mb from the regulated gene promoter. These enhancers provide a valuable paradigm for continuing investigation of long-range developmental gene regulation and its perturbation in human disease, and they join a small class of documented extreme long-range regulatory sequences that activate transcription at a more than 1-Mb genomic interval, such as the Shh ZRS and the Myc BENC and MNE enhancers (e.g., Bahr et al., 2018; Herranz et al., 2014; Lettice et al., 2003; Uslu et al., 2014). The enormous genomic distance begs questions about how the PRS-associated ECs can communicate with the SOX9 promoter to drive tissue-specific regulation in a precise and robust manner. Interestingly, one of the PRS-associated candidate ECs, EC1.35, which does not harbor activity in reporter assays, contains a constitutive CTCF binding site and interacts with the SOX9 promoter already in hESCs. This interaction is further augmented in hCNCCs, along with contacts between all three PRS-associated enhancers and between EC1.45 and EC1.25 and the SOX9 promoter. Remarkably, a recent study where the centromeric Sox9 TAD boundary was deleted in mice showed no significant effect on Sox9 expression or examined phenotypes (Despang et al., 2019), suggesting that TAD integrity may not be required for these long-range interactions and Sox9 regulation. However, although the EC1.35 element may not act as a canonical enhancer, it may instead participate in organizing extreme long-range contacts at the SOX9 locus via formation of CTCF-cohesin-mediated chromatin loops.
When attempting to model human non-coding mutations at the orthologous PRS locus in mice, there were a number of challenges to consider. First, because of extensive reshaping of mammalian genomes during evolution by transposons and other genomic forces, many functional human enhancer regions do not have orthologous sequences in mice (Chuong et al., 2017; Villar et al., 2015; Yue et al., 2014). Second, even when the orthologous sequence exists, its regulatory activity may not be conserved or can differ in strength or relative contribution to the target gene dosage (Denas et al., 2015; Shen et al., 2012). This second challenge is well illustrated by EC1.45; although the orthologous sequence is present in mice and its spatiotemporal activity is conserved, mEC1.45 is a substantially weaker enhancer compared with its human counterpart, perhaps compensated for by additional mouse-specific CNCC enhancers at the locus (Figure S7I). Consequently, deletion of mEC1.45 results in only an ~6%–13% decrease in Sox9 expression level compared with the 50%–55% SOX9 reduction seen for human EC1.45 deletion. Nonetheless, it is quite remarkable that even such a slight reduction in Sox9 gene dosage results in measurable changes in lower jaw shape and reduction in postnatal growth.
Despite the caveats outlined above, from our combined human and mouse results we can propose a model for the specificity of PRS manifestations where mutations at the far end of the SOX9 gene desert perturb broadly active craniofacial developmental ECs and affect SOX9 expression across the cranial neural crest. However, the heightened sensitivity of the mandible to SOX9 gene dosage further restricts the manifestations to micrognathia, which can, in sequence, lead to additional PRS-associated phenotypes (Figure 7C). Our work raises the interesting question of why the mandible is more sensitive to Sox9 dosage perturbation despite the broad expression of Sox9 across craniofacial structures. We suggest two potential hypotheses. In the first, we note that distinct transcription factors and signaling components are expressed in the future upper and lower jaw during development; for example, high levels of Hand2 and Dlx5/6 are expressed in the mandibular but not MxP (Beverdam et al., 2002; Funato et al., 2016). Loss of this patterning through ablation of the upstream Edn1/Ednra signaling pathway leads to a striking jaw transformation (Minoux and Rijli, 2010). Therefore, if spatially restricted morpho-regulatory programs such as these are differentially sensitive to Sox9 activity, then this could lead to tissue-selective effects on craniofacial development. An alternate hypothesis for the observed mandibular sensitivity to Sox9 perturbation could be related to the differences in the trajectory of craniofacial skeletal development. In a somewhat atypical process, formation of the mandible is intimately associated with a cartilage “template” called Meckel’s, whereas, in contrast, the midfacial skeleton forms strictly via intramembranous ossification independent of any cartilage precursor. Therefore, should perturbation of Sox9 expression in CNCCs affect the propensity or ability to differentiate into chondrocytes, it could account for the selective effect on mandibular development.
From an evolutionary standpoint, the mandible is extremely interesting because it is has widely divergent forms related to feeding and predation (Albertson and Kocher, 2006; Martinez et al., 2018). Furthermore, mandible shape evolution in hominins appears to be exceptionally rapid compared with any other primate clade (Raia et al., 2018) and includes shape changes within the ramus, including the condylar and coronoid processes and gonial angle—structures that are especially sensitive to slight alterations in Sox9 expression in our mouse models (Meloro et al., 2015; Terhune et al., 2014, 2018). It is therefore tempting to speculate that some of this morphological divergence could be mediated by regulatory changes leading to minor differences in SOX9 expression levels during CNCC development. In fact, EC1.45, featured in this study, overlaps a Neanderthal-specific hypomethylated region from bone samples (based on reconstructed DNA methylation maps; Gokhman et al., 2014, 2020; Figures 7A, 7D, and S6I). Although somewhat speculative, this suggests that the Neanderthal enhancer element might have retained regulatory activity longer during development (because DNA methylation is generally associated with silencing) compared with the human enhancer, which becomes decommissioned during chondrogenesis and is hypermethylated in human bones of various origins (Figures 3C–3E). Together, the PRS locus enhancers represent a fascinating locus for future investigation of extreme long-range gene regulation in development and disease, and across evolutionary time.
Limitations of Study
As outlined above, there are a number of challenges and limitations when attempting to model a human enhanceropathy in mice because of remodeling of the enhancer landscape across evolutionary time. In our study, this is exemplified by the weakened enhancer activity of mE1.45 compared with the human counterpart, and associated lower contribution to Sox9 expression. An additional limitation relates to the mouse strains used in the study; Wnt1::Cre and Sox9F/F mice are on an C57BL/6J background, whereas mEC1.45 deletion was generated on the FVB background. These different genetic backgrounds may cause a differential sensitivity to Sox9 perturbation because of other modifying variants in the genome.
STAR★Methods
Key Resources Table
| REAGENT or RESOURCE | SOURCE | IDENTIFIER |
|---|---|---|
| Antibodies | ||
| Rabbit polyclonal p300 (discontinued) – ChIP | Santa Cruz Biotechnology | Cat# sc-585; RRID: AB_2231120 |
| Rabbit polyclonal H3K4me1 – ChIP | Abcam | Cat# ab8895; RRID: AB_306847 |
| Rabbit polyclonal H3K27ac – ChIP | Active Motif | Cat# 39133; RRID: AB_2561016 |
| Rabbit polyclonal H3K4me3 – ChIP | Active Motif | Cat# 39159; RRID: AB_2615077 |
| Rabbit polyclonal CTCF – ChIP | Cell Signaling | Cat# 2899; RRID: AB_2086794 |
| Rabbit polyclonal RAD21 – ChIP | Abcam | Cat# ab992; RRID: AB_2176601 |
| Mouse monoclonal TWIST1 – ChIP | Abcam | Cat# ab50887; RRID: AB_883294 |
| Chemicals, Peptides, and Recombinant Proteins | ||
| mTeSR | Stem Cell Technologies | Cat# 85850 |
| Matrigel Growth Factor Reduced (GFR) Basement Membrane Matrix | Corning | Cat# 356231 |
| ReLeSR | Stem Cell Technologies | Cat# 05872 |
| Collagenase IV | GIBCO | Cat# 17104019 |
| DMEM/F12 1:1 medium, with L-glutamine; without HEPES | GE Healthcare | Cat# SH30271.FS |
| Neurobasal Medium | Thermo Fisher Scientific | Cat# 21103049 |
| Gem21 NeuroPlex Supplement With Vitamin A | Gemini Bio-Products | Cat# 400-160 |
| N2 NeuroPlex Supplement | Gemini Bio-Products | Cat# 400-163 |
| Antibiotic-Antimycotic (100X) | GIBCO | Cat# 15240062 |
| GlutaMAX Supplement (100X) | Life Technologies | Cat# 35050061 |
| Recombinant Human FGF-basic (154 a.a.) | PeproTech | Cat# 100-18B |
| Animal-Free Recombinant Human EGF | Peprotech | Cat# AF-100-15 |
| Bovine Insulin Powder | Gemini | Cat# 700-112P |
| Human Plasma Fibronectin Purified Protein | MilliporeSigma | Cat# FC01010MG |
| Accutase | Sigma-Aldrich | Cat# A6964-100ML |
| Bovine Serum Albumin (BSA), Fraction V—Serum Replacement Grade | Gemini Bio-Products | Cat# 700-104P |
| Recombinant Human/Murine/Rat BMP-2 (E.coli derived) | PeproTech | Cat# 120-02 |
| CHIR-99021 (CT99021) HCl | Selleck Chemicals | Cat# S2924 |
| DMEM/High glucose with L-glutamine, sodium pyruvate | Cytiva (formerly GE Healthcare) | Cat# SH30243.01 |
| Corning ITS+ Premix Universal Culture Supplement | Corning | Cat# 354352 |
| Sodium pyruvate | Life Technologies | Cat# 11360070 |
| Ascorbic acid | Sigma-Aldrich | Cat# A4403-100MG |
| Dexamethasone | Thermo Fisher Scientific | Cat# AAA1759003 |
| Recombinant Human TGF-β3 | PeproTech | Cat# 100-36E |
| Y-27632 RHO/ROCK pathway inhibitor | Stem Cell Technologies | Cat# 72304 |
| KnockOut DMEM | GIBCO | Cat# 10829018 |
| Alcian Blue 8GX | Sigma-Aldrich | Cat# A3157-10G |
| cOmplete, EDTA-free Protease Inhibitor Cocktail | MilliporeSigma | Cat# 11873580001 |
| Blasticidin (Solution), 100 mg | Invivogen | Cat# NC9016621 |
| QuickExtract DNA Extraction Solution | Lucigen | QE09050 |
| Bacterial and Virus Strains | ||
| Adeno-flippase (Ad5CMVFlpO) | Fred Hutchinson Cancer Research Center | VVC-U of Iowa-530 (MTA) |
| Critical Commercial Assays | ||
| NEBNext Ultra II DNA Library Prep Kit for Illumina | New England BioLabs | Cat# E7645S |
| SeqCap EZ Accessory Kit v2 | Roche | Cat# 07145594001 |
| SeqCap EZ Hybridization and Wash Kit | Roche | Cat# 05634261001 |
| SeqCap EZ HE-Oligo Kit A | Roche | Cat# 06777287001 |
| KAPA Library Quantification Kit Illumina platforms, qPCR Master Mix optimized for LightCycler 480 | Kapa Biosystems | Cat# KK4854 |
| TRIzol Reagent | Invitrogen | Cat# 15596018 |
| FuGENE 6 | Promega | Cat# E2691 |
| NEBNext Multiplex Oligos for Illumina kit | New England BioLabs | Cat# E7335S |
| AMPure XP | Beckman Coulter | Cat# A63881 |
| Dynabeads mRNA Purification Kit (for mRNA purification from total RNA preps) | Invitrogen | Cat# 61006 |
| Dynabeads Protein G for Immunoprecipitation | Invitrogen | Cat# 10004D |
| NEBNext Multiplex Oligos for Illumina (Dual Index Primers Set 1) | New England BioLabs | Cat# E7600 |
| Qubit dsDNA HS Assay Kit | Invitrogen | Cat# Q32854 |
| SuperScript IV VILO Master Mix with ezDNase Enzyme | Invitrogen | Cat# 11766050 |
| Dual-Luciferase Reporter Assay System | Promega | Cat# E1960 |
| HiScribe T7 Quick High Yield RNA Synthesis Kit | New England BioLabs | Cat# E2050S |
| MEGAclear Transcription Clean-up kit | Ambion | Cat# AM1908 |
| Deposited Data | ||
| ChIP-seq, ATAC-seq, RNA-seq and Capture-C data | This paper | GEO: GSE145327 |
| H9 hESC 10X Genomics linked-read sequencing | This paper | Sequence Read Archive (SRA) BioProject: PRJNA648128 |
| Experimental Models: Cell Lines | ||
| Human: Female H9 human embryonic stem cells (hESCs) | WiCell | WA09; RRID: CVCL_9773 |
| Experimental Models: Organisms/Strains | ||
| Mouse: C57BL/6J | The Jackson Laboratory | RRID: IMSR_JAX:000664 |
| Mouse: FVB/NJ | The Jackson Laboratory | RRID: IMSR_JAX:001800 |
| Mouse: B6.Cg-E2f1Tg(Wnt1-cre)2Sor/J | The Jackson Laboratory (Lewis et al., 2013) | RRID: IMSR_JAX:022501 |
| Mouse: B6.129S7-Sox9tm2Crm/J | The Jackson Laboratory (Akiyama et al., 2002) | RRID: IMSR_JAX:013106 |
| Mouse: FVB-mEC1.45del-founder1 | This paper | N/A |
| Mouse: FVB-mEC1.45del-founder2 | This paper | N/A |
| Oligonucleotides | ||
| Primers for qRT-PCR, CRISPR-Cas9, LNA probes, see Table S5 | This paper | N/A |
| RNA sequence: mEC1.45 upstream guide RNA1 (E1-45del_sg2U): AACAAGGTAGCGCCTCCTTA | This paper | N/A |
| RNA sequence: mEC1.45 downstream guide RNA1 (E1-45del_sg2D): ATATCAAGCACAAGGAGTGC | This paper | N/A |
| RNA sequence: mEC1.45 upstream guide RNA2 (CR50_sg3U): gatgttatggaaccttaagg | This paper | N/A |
| RNA sequence: mEC1.45 downstream guide RNA2 (CR53_sg3D): gaacaattacaaccaaacag | This paper | N/A |
| Recombinant DNA | ||
| Super piggyBac Transposase expression vector | System Biosciences (SBI) | Cat# PB210PA-1 |
| Plasmid: pGL3-SV40_control | Promega | N/A |
| Plasmid: pRL | Promega | N/A |
| Plasmid: pGL3-noSV40-humanEC1.45 | This paper | N/A |
| Plasmid: pGL3-noSV40-humanEC1.45_p300peak1 | This paper | N/A |
| Plasmid: pGL3-noSV40-humanEC1.45_p300peak2 | This paper | N/A |
| Plasmid: pGL3-noSV40-humanEC1.45_p300peak1-2 | This paper | N/A |
| Plasmid: pGL3-noSV40-humanEC1.45_min1 | This paper | N/A |
| Plasmid: pGL3-noSV40-humanEC1.45_min2 | This paper | N/A |
| Plasmid: pGL3-noSV40-humanEC1.45_min1-2 | This paper | N/A |
| Plasmid: pGL3-noSV40-humanEC1.35_S1-2 | This paper | N/A |
| Plasmid: pGL3-noSV40-humanEC1.35_S1 | This paper | N/A |
| Plasmid: pGL3-noSV40-humanEC1.35_S2 | This paper | N/A |
| Plasmid: pGL3-noSV40-humanEC1.25_S3-4-5-6 | This paper | N/A |
| Plasmid: pGL3-noSV40-humanEC1.25_S3 | This paper | N/A |
| Plasmid: pGL3-noSV40-humanEC1.25_S4 | This paper | N/A |
| Plasmid: pGL3-noSV40-humanEC1.25_S5 | This paper | N/A |
| Plasmid: pGL3-noSV40-humanEC1.25_S6 | This paper | N/A |
| Plasmid: pGL3-noSV40-humanCOL2A1enhancer | This paper | N/A |
| Plasmid: pGL3-noSV40-humanEC1.45_min1-2_4XCoordinatorMutant | This paper | N/A |
| Plasmid: pGL3-noSV40-humanEC1.45_min1-2_1XCoordinatorMutant | This paper | N/A |
| Plasmid: pGL3-noSV40-humanEC1.45_min1-2_3XCoordinatorMutant | This paper | N/A |
| Plasmid: pGL3-noSV40-EC1.45-human_min1-mouse_min2 | This paper | N/A |
| Plasmid: pGL3-noSV40-EC1.45-human_min1-opossum_min2 | This paper | N/A |
| Plasmid: pGL3-noSV40-EC1.45-human_min1-platypus_min2 | This paper | N/A |
| Plasmid: pGL3-noSV40-EC1.45-human_min1-chicken_min2 | This paper | N/A |
| Plasmid: pGL3-noSV40-EC1.45-human_min1-lizard_min2 | This paper | N/A |
| Plasmid: pGL3-noSV40-EC1.45-human_min1-frog_min2 | This paper | N/A |
| Plasmid: pGL3-noSV40-EC1.45-human_min1-coelacanth_min2 | This paper | N/A |
| Plasmid: pGL3-noSV40-mouseEC1.45 | This paper | N/A |
| Plasmid: pGL3-noSV40-humanEC1.45_p300peak1-2_del1 | This paper | N/A |
| Plasmid: pGL3-noSV40-humanEC1.45_p300peak1-2_del2 | This paper | N/A |
| Plasmid: pGL3-noSV40-humanEC1.45_p300peak1-2_del3 | This paper | N/A |
| Plasmid: pGL3-noSV40-humanEC1.45_p300peak1-2_del4 | This paper | N/A |
| Plasmid: pGL3-noSV40-humanEC1.45_p300peak1-2_del5 | This paper | N/A |
| Plasmid: pGL3-noSV40-humanEC1.45_p300peak1-2_del6 | This paper | N/A |
| Plasmid: pGL3-noSV40-humanEC1.45_p300peak1-2_del7 | This paper | N/A |
| Plasmid: pGL3-noSV40-humanEC1.45_p300peak1-2_del8 | This paper | N/A |
| Plasmid: pGL3-noSV40-humanEC1.45_p300peak1-2_del9 | This paper | N/A |
| Plasmid: pGL3-noSV40-humanEC1.45_p300peak1-2_del10 | This paper | N/A |
| Plasmid: pGL3-noSV40-humanEC1.45_p300peak1-2_del11 | This paper | N/A |
| Plasmid: pGL3-noSV40-humanEC1.45_p300peak1-2_del12 | This paper | N/A |
| Plasmid: pGL3-noSV40-humanEC1.45_p300peak1-2_CoordinatorMutant#1 | This paper | N/A |
| Plasmid: pGL3-noSV40-humanEC1.45_p300peak1-2_CoordinatorMutant#2 | This paper | N/A |
| Plasmid: pGL3-noSV40-humanEC1.45_p300peak1-2_CoordinatorMutant#3 | This paper | N/A |
| Plasmid: pGL3-noSV40-humanEC1.45_p300peak1-2_CoordinatorMutant#4 | This paper | N/A |
| Plasmid: pGL3-noSV40-humanEC1.45_p300peak1-2_CoordinatorMutant#5 | This paper | N/A |
| Plasmid: pGL3-noSV40-humanEC1.45_p300peak1-2_CoordinatorMutant#6 | This paper | N/A |
| Plasmid: pGL3-noSV40-humanEC1.45_p300peak1-2_CoordinatorMutant#7 | This paper | N/A |
| Plasmid: pGL3-noSV40-humanEC1.45_p300peak1-2_4XCoordinatorMutant#1-2-3-4 | This paper | N/A |
| Plasmid: pGL3-noSV40-humanEC1.45_p300peak1-2_3XCoordinatorMutant#5-6-7 | This paper | N/A |
| Plasmid: pGL3-noSV40-humanEC1.45_p300peak1-2_7XCoordinatorMutant | This paper | N/A |
| Plasmid: pHsp68-LacZ-P2A-tdTomato-coreinsulator | This paper | N/A |
| Plasmid: pHsp68-LacZ-P2A-tdTomato-coreinsulator_humanEC1.45 | This paper | N/A |
| Plasmid: pHsp68-LacZ-P2A-tdTomato-coreinsulator_humanEC1.35-S1-2 | This paper | N/A |
| Plasmid: pHsp68-LacZ-P2A-tdTomato-coreinsulator_humanEC1.25-S3x3 | This paper | N/A |
| Plasmid: pHsp68-LacZ-P2A-tdTomato-coreinsulator_humanEC1.25-S4x3 | This paper | N/A |
| Plasmid: pHsp68-LacZ-P2A-tdTomato-coreinsulator_humanEC1.25-S5x3 | This paper | N/A |
| Plasmid: pHsp68-LacZ-P2A-tdTomato-coreinsulator_humanEC1.25-S6x3 | This paper | N/A |
| Plasmid: pHsp68-LacZ-P2A-tdTomato-coreinsulator_mouseEC1.45 | This paper | N/A |
| Plasmid: pHsp68-LacZ-P2A-tdTomato-coreinsulator_mouseEC1.25-S3x3 | This paper | N/A |
| Plasmid: pHsp68-LacZ-P2A-tdTomato-coreinsulator_mouseEC1.25-S5x3 | This paper | N/A |
| Plasmid: pHsp68-LacZ-P2A-tdTomato-coreinsulator_mouseEC1.25-S6x3 | This paper | N/A |
| Plasmid: Sox9 in situ plasmid | From Ian Welsh | N/A |
| Plasmid: pX458-dual-U6prom-sgRNA-EC1.45_CAGprom-Cas9-GFP | This paper | N/A |
| Plasmid: EC1.45-HAs_FRT-EF1a-mCherry-T2A-Blast-FRT-FRT3 | This paper | N/A |
| Plasmid: pX458-U6prom-sgRNA-EC1.25_CAGprom-Cas9-GFP | This paper | N/A |
| Plasmid: EC1.25-firstDonor_HAs-hUbCprom-eGFP-tCD8 | This paper | N/A |
| Plasmid: EC1.25-secondDonor_HAs_only | This paper | N/A |
| Software and Algorithms | ||
| CHOPCHOP | Labun et al., 2019 | https://chopchop.cbu.uib.no/ |
| Benchling | Benchling [Biology Software]. (2017) | https://www.benchling.com/ |
| Bruker Recon software | Bruker | N/A |
| Amira software | ThermoFisher Scientific | https://www.thermofisher.com/us/en/home/industrial/electron-microscopy/electron-microscopy-instruments-workflow-solutions/3d-visualization-analysis-software/amira-life-sciences-biomedical.html |
| The R package for Statistical Computing | R Core Team (2019); R version 3.6.0 | https://www.r-project.org/ |
| R Geomorph package | Adams and Otárola-Castillo, 2013 | https://cran.r-project.org/web/packages/geomorph/index.html |
| R hotelling.test function | https://cran.r-project.org/web/packages/Hotelling/Hotelling.pdf | |
| skewer | Jiang et al., 2014 | https://github.com/relipmoc/skewer |
| bowtie2 | Langmead and Salzberg, 2012 | http://bowtie-bio.sourceforge.net/bowtie2/index.shtml |
| bedtools | Quinlan and Hall, 2010 | https://github.com/arq5x/bedtools2 |
| bedgraphToBigWig | https://github.com/ENCODE-DCC/kentUtils | |
| macs1.4 | Zhang et al., 2008 | https://github.com/macs3-project/MACS |
| cutadapt | Martin, 2011 | https://cutadapt.readthedocs.io/en/stable/ |
| HISAT2 | Kim et al., 2019 | https://daehwankimlab.github.io/hisat2/ |
| featureCounts (subread package) | Liao et al., 2014 | http://subread.sourceforge.net/ |
| CapSequm2 | Hughes et al., 2014 | http://apps.molbiol.ox.ac.uk/CaptureC/cgi-bin/CapSequm.cgi |
| Long Ranger (longranger-2.2.2) | 10X Genomics | https://support.10xgenomics.com/genome-exome/software/pipelines/latest/what-is-long-ranger |
| Macs2 (macs2 2.1.1.20160309) | Zhang et al., 2008 | https://github.com/macs3-project/MACS |
| SeqPos (Cistrome Project) | Liu et al., 2011 | http://cistrome.org/ |
| ggseqlogo | Wagih, 2017 | https://cran.r-project.org/web/packages/ggseqlogo/ggseqlogo.pdf |
| ggplot2 | Wickham, 2016 | https://ggplot2.tidyverse.org/ |
| UCSC | Kent et al., 2002 | https://genome.ucsc.edu/ |
| Samtools (v1.3.1) | Li et al., 2009 | http://samtools.sourceforge.net/ |
| Bioanalyzer 2100 Expert Software | Agilent | https://www.agilent.com/en/product/automated-electrophoresis/bioanalyzer-systems/bioanalyzer-software/2100-expert-software-228259 |
| QuantaSoft Software | BioRad | https://www.bio-rad.com/en-us/sku/1864011-quantasoft-software-regulatory-edition?ID=1864011 |
| Other | ||
| Leica imaging stereoscope | Leica | N/A |
| Covaris sonicator E220 | Covaris | N/A |
| Bruker Skyscan 1276 MicroCT (purchased with an NIH S10 Shared Instrumentation Grant, 1S10OD02349701, PI Timothy C. Doyle) | Bruker | https://www.bruker.com/products/microtomography/in-vivo-micro/skyscan-1276/overview.html |
| Veritas Microplate Luminometer | Turner Biosystems | N/A |
| Leica M205 FA Stereo Microscope coupled to a Leica DFC7000T digital camera | Leica | N/A |
| Leica MZ16 microscope coupled to a Leica DFC420 digital camera | Leica | N/A |
| QX200 Droplet Generator | BioRad | https://www.bio-rad.com/en-gu/sku/1864002-qx200-droplet-generator?ID=1864002 |
| QX200 Droplet Reader | BioRad | https://www.bio-rad.com/en-us/sku/1864003-qx200-droplet-reader?ID=1864003 |
| Chromium controller | 10X Genomics | https://www.10xgenomics.com/instruments/chromium-controller/ |
| HiSeq4000 (purchased with funds from NIH under award number S10OD018220) | Illumina | N/A |
| NextSeq500 | Illumina | N/A |
| Amaxa 4D nucleofector | Lonza | https://bioscience.lonza.com/lonza_bs/US/en/Transfection/p/000000000000203684/4D-Nucleofector-Core-Unit |
| A&D Weighing EJ-120 Newton Portable Balance, 120 g x 0.01 g; 115V | A&D Weighing | N/A |
| LightCycler 480 | Roche | N/A |
| High Resolution Episcopic Microscope | Tim Mohun lab | N/A |
| Bioanalyzer | Agilent | https://www.agilent.com/en/product/automated-electrophoresis/bioanalyzer-systems/bioanalyzer-instrument/2100-bioanalyzer-instrument-228250 |
Resource Availability
Lead Contact
Further information and requests for resources and reagents should be directed to and will be fulfilled by the Lead Contact, Joanna Wysocka (wysocka@stanford.edu).
Materials Availability
DNA constructs and other research reagents generated by the authors will be distributed upon request to other researchers.
Data and Code Availability
The accession number for Gene Expression Ombnibus (GEO) where the ChIP-seq, ATAC-seq, and RNA-seq datasets generated in this study are available is: GSE145327 (https://www.ncbi.nlm.nih.gov/geo/query/acc.cgi?acc=GSE145327). The accession number for the Sequence Read Archive (SRA) BioProject where the 10X Genomics linked-read sequencing data is available is: PRJNA648128.
Experimental Model and Subject Details
Mouse models and husbandry
C57BL/6J (RRID: IMSR_JAX:000664), FVB/NJ (RRID: IMSR_JAX:001800), C57BL/6J Wnt1::Cre2 (RRID: IMSR_JAX:022501) (Lewis et al., 2013) and C57BL/6J Sox9 flox (RRID: IMSR_JAX:013106) (Akiyama et al., 2002) mice were obtained from Jackson Labs and mEC1.45 deletion lines were generated and characterized on the FVB background as described in Method Details. Mice were housed in RAFII facility at Stanford University, with free access to food and water. All animal protocols were approved by the Administrative Panel on Laboratory Animal Care at Stanford University. Of note, the second generation Wnt1::Cre2 driver avoids ectopic Wnt activation and impact on midbrain development, which might have confounded studies performed with the first-generation Wnt1::Cre driver (Lewis et al., 2013). Only females were used to propagate the Wnt1::Cre2 driver.
For breeding, two female mice were introduced into a cage with a single male and monitored for timed pregnancies. To generate compound heterozygous mice carrying a deletion of mEC1.45 on one allele and a conditionally deletable Sox9 gene on the other allele, we crossed the mEC1.45 enhancer deletion lines to Wnt1::Cre2 driver females, and then crossed the resultant Wnt1::Cre2;mEC1.45del/+ females to Sox9F/F males. Mice were genotyped by tail clipping, lysis with Proteinase K in tail buffer (0.2M NaCl, 0.2% SDS, 0.05M EDTA and 0.1M Tris-HCl pH 8.0), precipitation with isopropanol, and analytical PCR using genotype-specific primers and Dream Taq Master Mix (Thermo Fisher Scientific). To monitor weight-gain, mice were weighed from birth to post-natal day 25 (P0-P25) using a scale with 2 decimal places (accuracy ± 0.01 g). Males and females were included for embryonic assays at E9.5 and E11.5, and for post-natal weighing.
Culture of H9 human embryonic stem cells (hESCs)
Female H9 (WA09; RRID: CVCL_9773) human embryonic stem cells (hESCs) were obtained from ATCC and cultured in mTeSR (Stem Cell Technologies) and grown on Matrigel Growth Factor Reduced (GFR) Basement Membrane Matrix (Corning) at 37°C. hESCs were fed every day and passaged every 5-6 days using ReLeSR (Stem Cell Technologies).
Method Details
Mouse genome editing using CRISPR/Cas9
Mouse orthologous mEC1.45 was deleted in vivo using CRISPR-Cas9 editing in the FVB strain as previously described (Osterwalder et al., 2018). Briefly, pairs of sgRNAs were designed to target upstream and downstream of the enhancer sequence to be deleted using CHOPCHOP (Labun et al., 2016) and Benchling (https://www.benchling.com/). sgRNAs were generated using a modified version of a previously published oligo assembly protocol (Varshney et al., 2015). In this process an oligo encoding a T7 promoter and the guide RNA sequence were annealed to a second, generic oligo, and Phusion polymerase (NEB) was used for extension. The guide RNA was synthesized using HiScribe T7 Quick High Yield RNA Synthesis kit (NEB) and purified using the MEGAclear Transcription Clean-up kit (Ambion) prior to quantification. A mix containing Cas9 protein (final concentration of 20 ng/ul; IDT Cat. No. 1074181) and four sgRNAs (12.5 ng/μL each) in an injection buffer (10 mM Tris, pH 7.5; 0.1 mM EDTA) was injected into the pronucleus of FVB mouse embryos at the single-cell stage. F0 founder mice were genotyped using primers spanning the desired deletion region and High-Fidelity Platinum Taq polymerase (Thermo Fisher Scientific) to identify deletion breakpoints, which were validated and mapped using Sanger sequencing. Deletions were validated in second generation F1 animals, and heterozygous animals were crossed to generate homozygous and heterozygous animals for breeding. Two founder lines were established with deletions differing by 58bp. Founder 1 has a 3572bp deletion, and Founder 2 has a 3630bp deletion.
Generation of CRISPR/Cas9 genome-edited cell lines
Human ESCs were targeted for enhancer deletion using two strategies. In the first strategy, H9 hESCs were transfected using FuGENE 6 (Promega) with a targeting construct containing Blasticidin selection cassette, flanked by FRT sites, and homology arms for either side of EC1.45 along with a plasmid encoding Cas9 plus single guide RNAs (sgRNAs) flanking EC1.45. Transfected hESCs were grown to confluency and split onto a new plate before selection with 1 μg/mL Blasticidin until all cells died on a mock/GFP transfected control well. Surviving colonies were picked into a 48-well plate, expanded, split and screened for enhancer deletion using a genomic primer and a primer in the targeting cassette. Heterozygous enhancer deleted clones were infected with 1E+08 pfu/mL Adeno-flippase (Ad5CMVFlpO, Fred Hutchinson Cancer Research Center) and clones screened for excision of the selection cassette by PCR. For screening, genomic DNA was extracted using QE buffer (Lucigen) and PCR was performed using Q5 polymerase (NEB). Heterozygous enhancer deletions were generated to be in keeping with the heterozygous deletions seen in PRS patients, and to enable allele-specific SOX9 gene expression analysis.
In the second targeting strategy, a scar-less editing methodology was performed (Ikeda et al., 2018). A targeting construct was designed to insert adjacent to EC1.25 in H9 hESCs, containing a hUbC promoter driving expression of an eGFP-T2A-tCD8 cassette. H9 hESCs were nucleofected with 3 μg this construct and 3 μg of a plasmid encoding Cas9 and a single guide RNA targeting one side of EC1.25 using an Amaxa 4D nucleofector (pulse code CB150). GFP positive cells were isolated by FACS after 7-12 days and plated onto a 6-well plate. GFP positive colonies were then picked, expanded and screened for integration of the targeting cassette using primers within the targeting cassette and flanking genomic sequence. Genomic DNA was extracted using QE buffer (Lucigen) and PCR screening was performed using PrimeSTAR GXL DNA Polymerase (Takara) and heterozygous targeted clones were isolated. A second cassette was designed to excise the first targeting construct as well as EC1.25 using enhancer-flanking homology arms with no extra exogenous sequences, to leave a scar-less deleted enhancer region. To generate matched wild-type clones, a wild-type homology template was used to excise the targeting cassette. Colonies were selected by screening for loss of tCd8 by magnetic activated sorting (MACS), plated onto a 6-well plate, and following dilute re-plating, colonies were picked into a 48-well plate. Clones were passaged and screened using primers flanking EC1.25 to identify positive clones with EC1.25 deleted on one allele, or excision of the targeting construct for the matched wild-type controls. Genomic DNA was extracted using QE buffer (Lucigen) and PCR screening was performed using Q5 polymerase (NEB).
Differentiation of hESC to hCNCCs and chondrocytes
hESCs were differentiated to human cranial neural crest cells (hCNCCs) using a protocol described previously (Prescott et al., 2015). Briefly, hESCs were grown for 5-6 days until large colonies formed, then were disaggregated using collagenase IV and gentle pipetting. Clumps of ~200 hESCs were washed in PBS and transferred to a 10cm Petri dish in neural crest differentiation media (NDM). NDM: 1:1 ratio of DMEM-F12 and Neurobasal, 0.5x Gem21 NeuroPlex Supplement With Vitamin A (Gemini, 400-160), 0.5x N2 NeuroPlex Supplement (Gemini, 400-163), 1x antibiotic/antimycotic, 0.5x Glutamax, 20ng/ml bFGF (PeproTech, 100-18B), 20ng/ml EGF (PeproTech, AF-100-15) and 5ug/ml bovine insulin (Gemini Bio-Products, 700-112P). After 7-8 days, neural crest emerged from neural spheres attached to the Petri dish, and after 11 days, neural crest cells were passaged onto fibronectin-coated 6-well plates using accutase and fed with neural crest maintenance media (NMM). NMM: 1:1 ratio of DMEM-F12 and neurobasal, 0.5x Gem21 NeuroPlex Supplement with Vitamin A (Gemini, 400-160), 0.5x N2 NeuroPlex Supplement (Gemini, 400-163), 1x antibiotic/antimycotic, 0.5x Glutamax, 20ng/ml bFGF, 20ng/ml bFGF EGF and 1mg/ml BSA (Gemini). After 2-3 days, neural crest cells were split 1:3 and the following day cells were fed with neural crest long-term media. Long term media: neural crest maintenance media + 50pg/ml BMP2 (PeproTech, 120-02) + 3uM CHIR-99021 (Selleck Chemicals, S2924) (BCh media). hCNCCs were then passaged twice to passage 4 when the majority of assays were performed, or cells were further differentiated to chondrocytes.
To differentiate hCNCCs to chondrocytes, passage 3 hCNCCs were passaged to passage 4, and the following day were transitioned to chondrocyte media without TGFb3 (ChM). ChM: DMEM-HG, 5% FBS, 1x ITS premix, 1mM sodium pyruvate, 50 μg/mL ascorbic acid, 0.1 μM dexamethasone and 1x antibiotic/antimycotic. The following day, cells were fed with chondrocyte media with TGFb3 (ChMT). ChMT: ChM + 10 ng/mL TGFb3. Cells were fed every subsequent 3 days with ChMT. Cells were harvested at day 5 and/or 9 of the differentiation for the majority of assays.
To evaluate the chondrogenic differentiation, we performed qRT-PCR for two independent experiments, and assessed the differentiation from P4 hCNCCs to Day 9 of chondrogenic differentiation. COL2A1 and Aggrecan (ACAN) are known to be directly regulated by SOX9 during chondrogenesis, COL2A1 is an early marker of the chondrocyte lineage, while ACAN is a marker of overtly differentiated chondrocytes. SOX5 and SOX6 are two SOX family transcription factors that are co-expressed with SOX9 in chondrocytes, and all three factors often form a trio at regulatory elements to promote chondrocyte differentiation. Notably, SOX5 is induced early during our in vitro differentiation. BMP2 is a marker of hypertrophic chondrocytes and is essential for chondrocyte proliferation and maturation.
Alcian Blue Staining
Alcian Blue stains extracellular matrix proteoglycan components associated with chondrocytes. hCNCCs were differentiated to chondrocytes and fixed with 4% PFA for 15 minutes. Cells were washed three times with 1x PBS, and incubated overnight in 20% sucrose at 4°C. The following day, cells were stained with Alcian Blue solution (pH 2.5) for 30 minutes. Alcian Blue solution was prepared by diluting 1g Alcian Blue, 8GX in 100mL 3% Acetic Acid solution, pH was adjusted to 2.5 with acetic acid. Following Alcian Blue staining, cells were washed with 3% acetic acid for 3 minutes, followed by several washes with 95% ethanol. Ethanol was removed and cells were imaged.
Capture-C
Capture-C was performed as previously described (Davies et al., 2016). Briefly, cells were crosslinked for 10 min in 2% formaldehyde in PBS, quenched with 125mM glycine for 5 min, scraped, collected and pelleted by centrifugation (500 rcf., 5 min, 4°C). Cells were washed with 5mL cold PBS, pelleted and resuspended in 5mL cold lysis buffer (10mM Tris pH8, 10mM NaCl, 0.2% Ipegal CA-630 in water with cOmplete Protease Inhibitor Cocktail) for 20 min. Cells were pelleted, washed with 5mL cold PBS, pelleted, resuspended in 1mL cold PBS, flash frozen in liquid nitrogen and stored at −80°C. For 3C library preparation, samples were defrosted on ice, pelleted and resuspended in 1xDpnII digestion buffer before extended digestion with DpnII overnight with addition of extra enzyme. DpnII was then heat inactivated at 65°C and samples were ligated with T4 Ligase for ~22 hours. DNA was extracted by sequential Proteinase K and RNase digestion followed by phenol-chloroform isoamylalcohol extraction and precipitation with ethanol and sodium acetate. Efficiency of digestion and ligation was assessed by gel electrophoresis and digestion efficiency was further assessed by qPCR. For addition of Illumina sequencing adaptors, samples were sheared by Covaris sonication and purified by XP SPRI bead clean-up. Sequencing adaptors were annealed using NEB Ultra II kit. Libraries were PCR amplified using Herculase II polymerase (Agilent) in duplicate to add indexing primers and purified by XP SPRI bead clean-up. Samples were pooled and quantified using Qubit dsDNA BR assay kit.
Biotinylated oligos for capture were designed using the Capsequm online tool (http://apps.molbiol.ox.ac.uk/CaptureC/cgi-bin/CapSequm.cgi) and ordered from IDT. 1-2 μg indexed 3C library was mixed with 5 μg COT DNA, 1nmol TS-HE Universal Oligo and 1nmol of TS-HE Index Oligo (Nimblegen SeqCap EZ HE-oligo and Accessory kit) and dried by vacuum centrifugation at 55°C until completely dry. The 3C library plus blocking oligos were then carefully resuspended in 7.5 μL 2X hybridization buffer and 3 μL Hybridization buffer A and denatured at 95°C for 10min. The 3C library was then transferred into a preheated PCR tube at 47°C containing 4.5 μL of pooled Biotinylated oligonucleotide capture probes at 2.9 μM. After a brief mix and centrifugation, the 3C library oligo mix was incubated at 47°C for 18-20 hr. Following this incubation, the 3C library was washed and recovered by streptavidin bead (M-270 Dynabeads, Invitrogen) pull down using the Nimblegen SeqCap EZ Hybridization and wash kit. Following the recovery of the captured material, the captured DNA was amplified on the streptavidin beads using KAPA HiFi HotStart ReadyMix and POST-LM PCR oligo 1&2 and purified by XP SPRI bead clean-up. For improved capture efficiency, a second round of capture was performed on the total amplified DNA from the first capture. Following the second round of capture, the library was quantified using KAPA library quantification kit using the average size calculated from Bioanalyzer. Libraries were then sequenced on Illumina HiSeq-4000 (2x 150bp).
RNA isolation and preparation of RNA-seq libraries
Total RNA was extracted from a 6-well of hESC, early (P1 and 2) and late (P3 and P4) hCNCCs and day 9 chondrocytes differentiated from hCNCCs using Trizol reagent (Invitrogen) for four independent differentiations. 10 μg RNA was purified twice by Dyna1 oligo(dT) beads (Invitrogen) to enrich for poly(A)+ mRNA. The mRNA was then fragmented using 10X fragmentation buffer (Ambion) for exactly 5 min and purified by ethanol precipitation with sodium acetate and RNase-free glycogen. First strand synthesis was performed using Random Hexamer Primers (Invitrogen) and SuperScript II (Invitrogen), followed by second strand synthesis using DNA PolI and RNaseH (Invitrogen), and cDNA was purified using Nucleospin Gel and PCR Cleanup (Takara). All of the cDNA was used for library preparation by end repair, A-tailing and adaptor ligation (NEB). The samples were treated with USER enzyme, purified using XP SPRI beads then subjected to dual size selection using XP SPRI beads using bead ratios 0.55x to remove > 700bp followed by 0.85x to recover > 200bp sized cDNA. Size-selected cDNA was amplified using NEBNext HiFi 2X PCR mix and Dual Index Primers (NEB, E7600) for 7-10 cycles (as determined by qPCR). Libraries were then purified using XP SPRI beads, and quantified using Qubit dsDNA HS assay kit and pooled for sequencing using average library size (bp) from Bioanalyzer and concentration from KAPA quantification (Kapa Biosystems). Libraries were sequenced using NextSeq 500 (2x 75 bp).
10X Genomics Linked-Read sequencing
High molecular weight genomic DNA (HMW gDNA) was generated from H9 hESCs by the salting out method (10x Genomics, manual CG000116) and quality was checked on a FEMTO pulse instrument (Agilent). Linked read libraries were prepared according to the manufacturer’s instructions (10x Genomics, manual CG00043) and sequenced on a HiSeq 4000 instrument (2 lanes, 2x 150 bp).
cDNA preparation and reverse transcriptase digital droplet PCR (RT-ddPCR)
Total RNA was extracted from early (Day 11, P1 and 2) and late (P3 and P4) hCNCCs and day 5 and 9 chondrocytes differentiated from hCNCCs for wild-type or enhancer mutant cell-lines using Trizol reagent (Invitrogen) for at least four differentiations, or from dissected craniofacial prominences from at least four embryos. 100ng – 1ug RNA was used to generate cDNA using the SuperScript Vilo IV MasterMix with ezDNase enzyme (Invitrogen). Primers and locked nucleic acid (LNA) probes were designed by IDT’s custom design service to the human SOX9 or mouse Sox9 3′UTR. For H9 hESC samples, LNA probes were centered on the rs74999341 T/C SNP – a HEX LNA probe detects the T-allele and FAM detects the C-allele. For mouse samples, LNA probes were centered on a G/C SNP in the C57BL/6J versus FVB mouse strains respectively – a HEX LNA probe detects the G-allele and FAM detects the C-allele. cDNA dilution factor was determined using qPCR with 1X PrimeTime Gene Expression Master Mix (IDT), 500nM primers and 250nM probes, run on LightCycler 480 (Roche). ddPCR reactions were performed using diluted cDNA (10-100X diluted), 900nM primers and 250nM probes and 1X ddPCR Supermix for probes (no dUTP, BioRad). ddPCR droplets were generated using the QX200 Droplet Generator (BioRad) and droplets were read using QX200 Droplet Reader (BioRad) and analyzed using the QuantaSoft Software (BioRad).
Chromatin immunoprecipitation (ChIP)
5-15 million cells were cross-linked per ChIP experiment in 2mL PBS per 6-well with 1% methanol-free formaldehyde for 5-10 min and quenched with a final concentration of 0.125M glycine for 5 min with nutation. Cross-linked cells were washed with PBS, scraped and pelleted by centrifugation, flash-frozen in liquid nitrogen and stored at −80°C. Samples were defrosted on ice and resuspended in 5mL LB1 (50 mM HEPES-KOH pH 7.5, 140 mM NaCl, 1 mM EDTA, 10% glycerol, 0.5% NP-40, 0.25% Triton X-100, with 1X cOmplete Protease Inhibitor Cocktail and optionally 1mM PMSF) and rotated vertically for 10 min at 4°C. Samples were centrifuged for 5 min at 1350 x g at 4°C, and resuspended in 5mL LB2 (10 mM Tris, 200 mM NaCl, 1 mM EDTA, 0.5 mM EGTA, with 1X cOmplete Protease Inhibitor Cocktail and optionally 1mM PMSF) and rotated vertically for 10 min at 4°C. Samples were centrifuged for 5 min at 1350 x g at 4°C, and resuspended in 1mL LB3 per 10 million cells (maximum concentration of cells for Covaris sonication), or 1 mL per ChIP. Samples were sonicated in 1mL AFA tubes for 5 min on E220 evolution Covaris with settings Peak power = 140, Duty Factor = 10, Cycles per burst = 200 to achieve chromatin sized approximately 500-2000bp.
Following sonication, samples were re-combined (if aliquoted for sonication), Triton X-100 was added to the fragmented chromatin to a final concentration of 1%, and the chromatin divided for input (1%–2%) and ChIP samples. 5 μg anti-histone antibody or 5-9 μg anti-transcription factor antibody was added per ChIP sample, and incubated overnight at 4°C. Antibodies used include TWIST1 (Abcam, ab50887), RAD21 (Abcam, ab992), CTCF (Cell Signaling, 2899S), H3K4me1 (Active Motif, 39297), H3K4me3 (Active Motif, 39159), H3K27ac (Active Motif, 39133) and p300 (Santa Cruz). Protein G Dynabeads (ThermoFisher) were first blocked with Block solution (0.5% BSA (w/v) in 1X PBS) and then added to cleared chromatin to bind antibody-bound chromatin for a 4-6 hour incubation. Chromatin-bound Dynabeads were washed at least 6 times with chilled RIPA wash buffer (50 mM HEPES-KOH pH 7.5, 500 mM LiCl, 1 mM EDTA, 1% NP-40, 0.7% Na-Deoxycholate), followed by a wash with chilled TE + 50 mM NaCl. Chromatin was eluted for 15-30 min in Elution Buffer (50 mM Tris, 10 mM EDTA, 1% SDS) at 65°C with frequent vortexing. The ChIP and input samples were then incubated at 65°C overnight to reverse cross-links (12-16 hours). Samples were diluted and sequentially digested with RNase A (0.2 mg/mL) for 2 hours at 37°C followed by Proteinase K (0.2 mg/mL) for 2 hours at 55°C for 2-4 hours to digest protein. ChIP and input samples were purified by phenol-chloroform-isoamylalcohol extraction and precipitation with final concentration 70% ethanol, 0.3M NaOAc pH 5.2 and 1.5 μL glycogen.
For library preparation, samples were quantified by Qubit dsDNA HS assay kit, and 10-30ng of ChIP DNA was used for library preparation with end repair, A-tailing, and adaptor ligation (NEB). Following USER enzyme treatment, samples were purified using Nucleospin Gel and PCR Cleanup (Takara) and separated by gel electrophoresis and size-selected for 220-500 bp by gel extraction. Libraries were then amplified to add indices using NEBNext HiFi 2X PCR mix and NEBNext Multiplex Oligos for Illumina kit (NEB, E7335S) with 9-15 cycles (as determined by qPCR). ChIP libraries were purified by two rounds of XP SPRI bead clean-up to deplete adaptors. Library concentration and quality was assessed by Bioanalyzer (to determine size) and KAPA qPCR was used to pool multiple libraries. Samples were sequenced using NextSeq or HiSeq 4000 platform (2x 75bp).
Episomal ChIP-ddPCR
Around 5 million passage 4 hCNCCs were transfected with 1.5 μg wild-type (WT) and 1.5 μg Coordinator mutant (4x mut) luciferase min1-min2 reporter plasmid in 300 μL optimum with 9 μL Fugene-6. Cells were fixed after 24 hours and ChIP performed as described above. 9 μg TWIST antibody was used per ChIP (Abcam, ab50887). Primers were designed to amplify across the min2-plasmid backbone junction, and plasmid-specific probes were designed to distinguish between the wild-type and Coordinator mutant sequences. ChIP and input dilution factors were determined using qPCR with 1X PrimeTime Gene Expression Master Mix (IDT), 500nM primers and 250nM probes, run on LightCycler 480 (Roche). ddPCR reactions were performed using ChIP DNA (40X diluted) and input DNA (640X diluted), 900nM primers and 250nM probes and 1X ddPCR Supermix for probes (no dUTP, BioRad). ddPCR droplets were generated using the QX200 Droplet Generator (BioRad) and droplets read using QX200 Droplet Reader (BioRad) and analyzed using the QuantaSoft Software (BioRad).
ATAC-seq
ATAC-seq was performed as described previously (Buenrostro et al., 2013; Corces et al., 2017) Briefly, cells were dissociated and treated with DNaseI (Worthington) and 50,000 viable cells were sorted as DAPI negative. Cells were pelleted at 500 RCF for 5 min at 4°C and resuspended in ATAC-resuspension buffer containing 0.1% NP40, 0.1% Tween20, and 0.01% Digitonin and incubated on ice for 3 minutes. Following wash-out with cold ATAC-Resuspension Buffer (RSB, 10 mM Tris-HCl pH 7.4, 10mM NaCl, 3mM MgCl2 in sterile water) containing 0.1% Tween20, cells were pelleted and resuspended in 50 μL transposition mix (25 μL 2x TD buffer, 2.5 μL transposase (100nM final), 16.5 μL PBS, 0.5 μL 1% digitonin, 0.5 μL 10% Tween20, 5 μL H2O) and incubated for 30 minutes at 37°C with shaking. The reaction was purified using the Zymo DNA Clean and Concentrator Kit, and amplified using PCR primers defined in Buenrostro et al. (2013). Libraries were purified using the Zymo DNA Clean and Concentrator Kit, quantified using the KAPA Library Quantification kit and quality assessed by Bioanalyzer (also used to determine average size for pooling libraries). Samples were sequenced on the HiSeq4000 platform (2x 75bp).
Cloning PRS locus enhancers for luciferase assay, including Coordinator mutant and vertebrate species min2 sequences
EC1.45, as well as combined constituent enhancers for EC1.35 (S1 and S2) and EC1.25 (S3, S4, S5 and S6) were PCR-amplified from H9 hESC genomic DNA and cloned into the pGL3 luciferase reporter vector. To generate Coordinator mutant sequences, Coordinator motifs were identified in EC1.45 using fimo from the meme suite (Grant et al., 2011). Coordinator motifs were then mutated in silico at positions with greatest information content in the PWM, to resemble sequence changes associated with reduction in enhancer activity during human-chimpanzee divergence (Prescott et al., 2015). To synthesize orthologous min2 sequences, Multiz Alignments of 100 Vertebrates (UCSC) was used to identify orthologous sequences for mouse, opossum, platypus, lizard, chicken, frog and coelacanth which were then extended to each be 267 bp long. Sequences containing mutant EC1.45 Coordinator motifs and vertebrate min2 sequences were ordered from TWIST Bioscience (or IDT for coelacanth sequence) and cloned into the pGL3 luciferase reporter vector.
Luciferase assay
Luciferase assays were performed as described previously (Prescott et al., 2015). Briefly, H9 hESC were differentiated following the hCNCC differentiation protocol and passaged to passage 3. For hCNCCs, cells were transfected immediately following passaging to passage 4 in 24-well plates. For hESCs, cells were split the day before into a 24 well plate in ROCKi (Y27632) and transfected the following day. For chondrocytes, passage 3 hCNCCs were split into a 24-well plate, and the now passage 4 hCNCCs were transitioned to ChM media for 1 day, and ChMT media for 4 more days before being transfected for the luciferase assay. Transfections were performed in technical triplicate in a single experiment, with each well receiving 10ng of pGL3 plasmid, 0.5ng of control pRL firefly renilla plasmid, 89.5 μL carrier DNA (circularized pGEMT plasmid) and 0.3 μL Fugene 6 in 50 μL of optimum. The pGL3 plasmid contains the firefly luciferase gene driven by an SV40 promoter with either a control SV40 enhancer downstream, or a test enhancer sequence cloned upstream (Promega), the pRL plasmid acts as a transfection control with Renilla luciferase driven by an upstream CMV enhancer and CMV promoter (Promega). 24 hours after transfection, cells were washed in PBS, and lysed in 150 μL 1X passive lysis buffer (in PBS) for 15 min (Promega). 20 μL lysate was then transferred to an opaque flat-bottomed plate for reading with a luminometer (Veritas). An automated injector added 100 μL LARII reagent and the well was read using the following parameters: 2 s delay, 10 s integration. 100 μL Stop-and-Glow reagent was then injected into the well and read using the same parameters. Luciferase assays were repeated in biological duplicate or triplicate with at least two different DNA preps; empty vector and SV40 enhancers were included in each experiment as negative and positive controls, respectively.
LacZ in vivo reporter assay
A second generation LacZ reporter vector was cloned with a Hsp68 promoter driving expression of LacZ-P2A-tdTomato flanked by core insulator sequences to minimize position effects of site of integration and with a multiple cloning site upstream for cloning enhancer sequences to be tested. EC1.45 was subcloned into this vector from the luciferase reporter, as was S1-S2 combined EC1.35 enhancer cluster. The constituent enhancers from EC1.25 (S3, S4, S5 and S6) were triplexed and inserted into the multiple cloning site. The reporter plasmids were linearized and injected into fertilized mouse oocytes, implanted into recipient females and allowed to develop to two distinct mouse embryonic stages, E9.5 or E11.5, that represent distinct periods of craniofacial development (Cyagen – for EC1.45, EC1.35 and EC1.25-S5; LBNL for remaining constructs). Embryos were harvested and processed for X-gal staining to reveal spatial expression pattern of the LacZ gene under the control of the putative cloned enhancer sequence. To be considered reproducible, craniofacial expression patterns had to be observed in at least three embryos (Visel et al., 2007). Embryos were imaged using a Leica M205 FA Stereo Microscope coupled to a Leica DFC7000T digital camera or a Leica MZ16 microscope coupled to a Leica DFC420 digital camera.
Preparation of in situ hybridization probes
Murine cDNA probes for Sox9 corresponding to nucleotides 2443-3588 of RefSeq NM_011448 were TA-cloned from E14.5 C57BL/6 cDNA. The Sox9 probe was linearized and used to transcribe a DIG-labeled antisense probe using an in vitro transcription kit (Roche), following the manufacturer’s instructions.
In situ hybridization
In situ hybridization was performed as described previously (Welsh et al., 2018). Embryos (C57BL/6J) were collected at E9.5 and E11.5, dissected into cold PBS and fixed overnight in 4% PFA in PBS at 4°C. Embryos were dehydrated through a methanol-PBST (PBS + 0.1% Tween20) series and stored at −20°C in 100% methanol. For hybridization, embryos were bleached in 6% hydrogen peroxide in methanol for 1 hour, followed by rehydration, treatment with Proteinase K (10 μg/mL) for 10 minutes at 37°C, and then washed twice in ice cold PBST. Embryos were re-fixed in 4% PFA/0.2% glutaraldehyde in PBST for 20 minutes then washed twice in PBST. Embryos were then transferred to a prehybridization solution for 1 hour at 68°C followed by overnight incubation with the Sox9 riboprobe at 68°C. The following day, embryos were first rinsed with hybridization buffer, then washed 7 times (30 minutes each) with 2XSSC/50%formamide/0.1% Tween at 68°C. Subsequently, embryos were washed twice with TBST, twice with MABT, and blocked in 10% blocking solution (Roche) diluted in MABT for 1 hour at room temperature. Embryos were then incubated with anti-digoxigenin-AP antibody (Roche) at a concentration of 1:4000 in 1% blocking solution overnight at 4°C with rocking. The following day, embryos were washed extensively in TBST buffer at room temperature for 4 days. Colorimetric detection was performed with BM-Purple Chromogenic Reagent (Roche). Lastly, embryos were washed in PBST and post-fixed with 4% PFA and stored in PBS containing 0.05% sodium azide. Embryos were imaged using a Leica M205 FA Stereo Microscope and a Leica DFC7000T digital camera. A minimum of three embryos were processed per stage.
High resolution episcopic microscopy (HREM)
HREM was performed for a representative LacZ reporter embryo for human EC1.45. In HREM, the embedding medium is made highly fluorescent via addition of eosin. The embryo signal is detected as suppression of this fluorescence, in addition chromogenic substrates, for example those used in our LacZ reporter embryos are detected at distinct wavelengths from tissue morphology (Mohun and Weninger, 2012a). The embryo was embedded in JB-4 embedding solution as previously described (Mohun and Weninger, 2012b), sectioned with an SM2500 motorized microtome (Leica) and the block face was concurrently imaged using custom imaging apparatus. Visualization of HREM images was performed in Amira.
MicroCT and mandibular morphometry
Mouse embryos were collected at E18.5 of development and fixed in 4% PFA. MicroCT was performed using a Bruker Skyscan at 15um resolution, 0.25mm Al filter, 415ms exposure, 2k resolution and images were acquired every 0.5 degrees for 180 degrees.
Quantification and Statistical Analysis
Analyzing and plotting luciferase data
Multiple independent luciferase experiments were performed with independent plasmid preparations and distinct cell passages or differentiations. The number of independent replicates for each luciferase assay is indicated in the figure legend, or in the plot as n =. For each biological replicate experiments, technical triplicate transfections were performed for each plasmid. Empty vector and SV40 enhancer were included in all experiments as negative and positive controls, respectively. When testing enhancer activity in chondrocytes, an additional COL2A1 intron1 enhancer was included which is active in both hCNCCs and chondrocytes. To plot multiple luciferase experiments on the same plot, linear regression was performed in R and residuals were plotted as boxplots. For ease of visualization, the median value for the empty vector control was set to 0. Significance of activity change were determined by t-test.
Fimo analysis was used to detect Coordinator motifs in the vertebrate min2 sequences, and the fimo scores were summed to estimate the relative number and match to consensus of Coordinator motifs for each species. The summed fimo score was compared to the luciferase signal and linear regression analysis performed to define the relationship between the two measures and ANOVA was used to determine the significance.
Analyzing and plotting ddPCR data
Concentration of the two alleles of SOX9 or Sox9 was determined by RT-ddPCR using allele-specific HEX/FAM probes from the QuantaSoft Software. To plot allelic skew, concentration for the mutated allele was divided by the concentration for the wild-type allele and plotted as a ratio (red boxplots). For matched wild-type cells (green boxplots), the same ratio was plotted; this revealed the presence of an allelic skew even in unedited cells suggesting that polymorphisms between the two alleles can drive differences in allelic expression. For Figure 3C, samples were collected for two wild-type cell lines and two mutant EC1.45del/+ cell lines for two independent differentiations. For Figure S4F, samples were collected for five wild-type cell lines and five mutant EC1.25del/+ cell lines for three independent differentiations.
To calculate the % change in Sox9 expression upon mEC1.45 deletion, the mean allelic skew for the edited embryo facial tissues (mEC1.45del/+) was divided by the mean allelic skew from matched wild-type tissues to account for the normal level of allelic skew detected in unedited wild-type samples. For Figure 6E, four wild-type and four mEC1.45del/+ embryos were dissected at E11.5. For Figure S7H, six wild-type and seven mEC1.45del/+ embryos were dissected at E9.5 (from two litters). Significant differences in allelic skew were determined by t-test.
For TWIST1 ChIP-ddPCR, the concentration of wild-type or Coordinator mutant plasmid were calculated for ChIP and input samples from the QuantaSoft Software using plasmid-specific HEX/FAM probes and primers spanning the min2 sequence and the plasmid backbone. A ratio was calculated between the TWIST ChIP and input samples, and normalized to 1 for the wild-type plasmid, revealing that TWIST1 binding was dramatically reduced on the Coordinator mutant plasmid.
External datasets
External next generation sequencing data were downloaded from the Sequence Read Archive
(SRA) and analyzed as below.
ChIP-seq analysis
ChIP sequencing reads were trimmed using skewer and aligned to the human genome (hg19) using bowtie2. For normalization, bedgraph files were generated from aligned bam files using bedtools genomecov with -scale option to normalize to 1 million reads. For visualization, bigwig files were generated using bedgraphToBigWig. Peak calling was performed using macs1.4, for replicate experiments the intersect tool from bedtools was used to identify peaks present in both replicates.
ATAC-seq analysis
Nextera adaptor sequences were trimmed from ATAC sequencing reads using cutadapt and aligned to the human genome (hg19) using bowtie2. For normalization, bedgraph files were generated from aligned bam files using bedtools genomecov with -scale option to normalize to 1 million reads. For visualization, bigwig files were generated using bedgraphToBigWig. Peak calling was performed using macs1.4, for replicate experiments the intersect tool from bedtools was used to identify peaks present in both replicates.
RNA-seq analysis
RNA sequencing reads were trimmed using cutadapt and aligned to human gene models (hg38) using HISAT2. Read counts per gene were quantified using featureCounts, gene expression was normalized to fragments per million and plotted in R.
Capture-C analysis
Capture-C analysis was performed using bespoke analysis scripts outlined here: http://userweb.molbiol.ox.ac.uk/public/telenius/captureManual/oligofile.html. For comparison across samples, Capture-C profiles were plotted as the number of unique interactions per restriction fragment normalized to 10,000 interactions in cis. For quantification, normalized interactions in cis were extracted for DpnII fragments overlapping the feature of interest and plotted as a boxplot in R. Statistical significance was determined by t-test for successive stages of hCNCC differentiation.
10X Linked-Read analysis
10X Linked-Read sequencing data was analyzed using Long Ranger (longranger-2.2.2) and visualized using the 10X loupe genome browser.
Motif discovery
To identify de novo DNA sequence motifs enriched at TWIST1 binding sites, we called peaks from the TWIST1 ChIP-seq data using MACS2 and identified de novo motifs underlying these peaks using the SeqPos tool in Cistrome. Known motifs were identified using the TOM-TOM motif comparison tool (Gupta et al., 2007). Consensus DNA binding motifs were plotted using R package ggseqlogo and plotted using ggplot2.
MicroCT mandibular morphometry, quantification and plotting
Reconstruction of microCT data was performed using Bruker Recon software. Hemimandible, pre-maxilla, maxilla, palatine and occipital bones were segmented and landmarks were placed using Amira software (Ho et al., 2015; Welsh et al., 2018). x-y-z coordinates were imported into the R Geomorph package that was used to calculate Procrustes distances, calculate inter-landmark absolute distances and perform ANOVA statistics to determine significance. For boxplots representing inter-landmark distance measurements, a significant reduction in size of the mutant mandibles is labeled as a percentage of the wild-type mandible. Hotelling tests were performed using Procrustes transformed data, and the hotelling.test function in R. Plotting was performed in R. Numbers of embryos analyzed is indicated in the figure legends.
Comparison to other datasets
To determine similarity of the epigenomic landscape at the SOX9 locus to that of other human cell-types, we downloaded over 50 publicly available H3K27ac ChIP-seq datasets from a number of cell-types (Prescott et al., 2015). We compared these datasets to our in vitro hCNCC H3K27ac ChIP-seq data and determined that activity of the PRS-associated enhancer clusters EC1.45, EC1.35 and EC1.25 was restricted to hCNCCs as they were not marked in other cell-types analyzed.
Analysis of differentially methylated regions (DMRs)
A Neanderthal-specific significantly hypomethylated region was identified at genomic coordinates chr17:68668482-68674772 (hg19) from previously published datasets (Gokhman et al., 2014, 2020) that overlaps the EC1.45 enhancer cluster. A heatmap was generated representing DNA methylation at CpG dinucleotides spanning the DMR locus for one chimp (rib), seven anatomically modern humans (femur, crania, teeth), one Denisovan (finger) and two Neanderthal (femur and toe) bone samples. DNA methylation levels were determined by whole genome bisulfite sequencing (WGBS) or reconstructed using previously published methods which leverages spontaneous C → T deamination for ancient samples (Gokhman et al., 2014, 2020). For reconstructed DNA methylation maps, the C → T ratio was calculated for each CpG dinucleotide and then translated via a linear transformation (based on modern fully hypomethylated or fully methylated sites) to a methylation percentage. All samples were smoothed using a sliding window of 25 CpG dinucleotides. DNA methylation is marked in the heatmap from green (0% methylation) to red (100% methylation), while white indicates no information.
Acknowledgments
We acknowledge the Stanford Functional Genomics Facility (SFGF) for next-generation sequencing (NIH S10 Shared Instrumentation Grant S10OD018220) and the Stanford Center for Innovation in In-Vivo Imaging (SCI3) for use of the Bruker Skyscan 1276 (NIH S10 Shared Instrumentation Grant 1S10OD02349701, PI Timothy C. Doyle). We thank Dr. David Gokhman for sharing hominin DNA methylation data, Fabian Suchy for ddPCR advice, Dr. Jaaved Mohammed for genomics advice, and Dr. Marta Losa Llabata and Dr. Antoine Zalc for help and expertise with mouse work. We thank Dr. Seungsoo Kim and Dr. Sahin Naqvi for critical reading of the manuscript. This work was supported by HHMI (to J.W.), the Pitch Johnson Fund (J.W.), U01 DE024430 FaceBase2 (to J.W. and L.S.), R35 GM131757 (to J.W.), Wellcome Trust Sir Henry Wellcome Fellowship 106051/Z/14/Z (to H.L.), a NIDCR F32DE026950 fellowship (to I.W.), MRC Clinician Scientist Fellowship MR/R008108 (to J.D.), Chan-Zuckerberg Biohub Chan-Zuckerberg Investigator (to M.H.P.), Medical Research Council MC_UU_00016 and MR/N00969X/1 (to D.R.H. and J.H.), and U01 DE024427 and R01 DE028599 (to A.V.). Research conducted at the E.O. Lawrence Berkeley National Laboratory was performed under Department of Energy contract DE-AC02-05CH11231, University of California (to A.V.).
Author Contributions
Conceptualization, H.K.L. and J.W.; Methodology, H.K.L., M.O., J.O.J.D., R.A., K.I., M.H.P., T.M., T.S., J.R.H., D.R.H., L.S., and J.W.; Formal Analysis, H.K.L. and T.S.; Investigation, H.K.L., M.O., I.C.W., K.H., Y.E.L., M.K., A.T.A., and N.A.; Resources, M.O., R.M.W., T.S.-S., D.E.D., and A.V.; Writing – Original Draft, H.K.L. and J.W.; Writing – Review & Editing, H.K.L., M.O., I.C.W., K.H., J.O.J.D., D.E.D., J.R.H., D.R.H., A.V., L.S., and J.W.; Visualization, H.K.L.; Supervision, A.V., L.S., and J.W.; Project Administration, J.W.; Funding Acquisition, H.K.L., A.V., L.S., and J.W.
Declaration of Interests
J.W. is a member of the CAMP4 scientific advisory board and ISSCR board of directors. J.R.H. and J.O.J.D. are founders and on the board of directors of Nucleome Theraputics.
Published: September 28, 2020
Footnotes
Supplemental Information can be found online at https://doi.org/10.1016/j.stem.2020.09.001.
Supporting Citations
The following references appear in the Supplemental Information: Day et al. (2009), Limberg et al. (2013), Tawil et al. (1994), Zeevaert et al. (2009).
Supplemental Information
References
- Adams D.C., Otárola-Castillo E. Geomorph: An r package for the collection and analysis of geometric morphometric shape data. Methods Ecol. Evol. 2013;4:393–399. [Google Scholar]
- Akiyama H., Chaboissier M.C., Martin J.F., Schedl A., de Crombrugghe B. The transcription factor Sox9 has essential roles in successive steps of the chondrocyte differentiation pathway and is required for expression of Sox5 and Sox6. Genes Dev. 2002;16:2813–2828. doi: 10.1101/gad.1017802. [DOI] [PMC free article] [PubMed] [Google Scholar]
- Albertson R.C., Kocher T.D. Genetic and developmental basis of cichlid trophic diversity. Heredity. 2006;97:211–221. doi: 10.1038/sj.hdy.6800864. [DOI] [PubMed] [Google Scholar]
- Amano O., Doi T., Yamada T., Sasaki A., Sakiyama K., Kanegae H., Kindaichi K. Meckel’s cartilage : Discovery, embryology and evolution -overview of the specificity of meckel’s cartilage- J. Oral Biosci. 2010;52:125–135. [Google Scholar]
- Amarillo I.E., Dipple K.M., Quintero-Rivera F. Familial microdeletion of 17q24.3 upstream of SOX9 is associated with isolated Pierre Robin sequence due to position effect. Am. J. Med. Genet. A. 2013;161A:1167–1172. doi: 10.1002/ajmg.a.35847. [DOI] [PubMed] [Google Scholar]
- Arzate-Mejía R.G., Recillas-Targa F., Corces V.G. Developing in 3D: the role of CTCF in cell differentiation. Development. 2018;145:dev137729. doi: 10.1242/dev.137729. [DOI] [PMC free article] [PubMed] [Google Scholar]
- Baetens D., Mendonça B.B., Verdin H., Cools M., De Baere E. Non-coding variation in disorders of sex development. Clin. Genet. 2017;91:163–172. doi: 10.1111/cge.12911. [DOI] [PubMed] [Google Scholar]
- Bagheri-Fam S., Barrionuevo F., Dohrmann U., Günther T., Schüle R., Kemler R., Mallo M., Kanzler B., Scherer G. Long-range upstream and downstream enhancers control distinct subsets of the complex spatiotemporal Sox9 expression pattern. Dev. Biol. 2006;291:382–397. doi: 10.1016/j.ydbio.2005.11.013. [DOI] [PubMed] [Google Scholar]
- Bahr C., von Paleske L., Uslu V.V., Remeseiro S., Takayama N., Ng S.W., Murison A., Langenfeld K., Petretich M., Scognamiglio R. A Myc enhancer cluster regulates normal and leukaemic haematopoietic stem cell hierarchies. Nature. 2018;553:515–520. doi: 10.1038/nature25193. [DOI] [PubMed] [Google Scholar]
- Bajpai R., Chen D.A., Rada-Iglesias A., Zhang J., Xiong Y., Helms J., Chang C.P., Zhao Y., Swigut T., Wysocka J. CHD7 cooperates with PBAF to control multipotent neural crest formation. Nature. 2010;463:958–962. doi: 10.1038/nature08733. [DOI] [PMC free article] [PubMed] [Google Scholar]
- Benko S., Fantes J.A., Amiel J., Kleinjan D.J., Thomas S., Ramsay J., Jamshidi N., Essafi A., Heaney S., Gordon C.T. Highly conserved non-coding elements on either side of SOX9 associated with Pierre Robin sequence. Nat. Genet. 2009;41:359–364. doi: 10.1038/ng.329. [DOI] [PubMed] [Google Scholar]
- Beverdam A., Merlo G.R., Paleari L., Mantero S., Genova F., Barbieri O., Janvier P., Levi G. Jaw transformation with gain of symmetry after Dlx5/Dlx6 inactivation: mirror of the past? Genesis. 2002;34:221–227. doi: 10.1002/gene.10156. [DOI] [PubMed] [Google Scholar]
- Bi W., Huang W., Whitworth D.J., Deng J.M., Zhang Z., Behringer R.R., de Crombrugghe B. Haploinsufficiency of Sox9 results in defective cartilage primordia and premature skeletal mineralization. Proc. Natl. Acad. Sci. USA. 2001;98:6698–6703. doi: 10.1073/pnas.111092198. [DOI] [PMC free article] [PubMed] [Google Scholar]
- Bienstock D., Ayyala R., Eisig S.B., Perrino M.A. Evaluation of the Pierre Robin Sequence Mandible Using Computed Tomography. J. Oral Maxillofac. Surg. 2016;74:e52–e53. [Google Scholar]
- Bildsoe H., Loebel D.A.F., Jones V.J., Chen Y.T., Behringer R.R., Tam P.P.L. Requirement for Twist1 in frontonasal and skull vault development in the mouse embryo. Dev. Biol. 2009;331:176–188. doi: 10.1016/j.ydbio.2009.04.034. [DOI] [PubMed] [Google Scholar]
- Bronner M.E., LeDouarin N.M. Development and evolution of the neural crest: an overview. Dev. Biol. 2012;366:2–9. doi: 10.1016/j.ydbio.2011.12.042. [DOI] [PMC free article] [PubMed] [Google Scholar]
- Buenrostro J.D., Giresi P.G., Zaba L.C., Chang H.Y., Greenleaf W.J. Transposition of native chromatin for fast and sensitive epigenomic profiling of open chromatin, DNA-binding proteins and nucleosome position. Nat. Methods. 2013;10:1213–1218. doi: 10.1038/nmeth.2688. [DOI] [PMC free article] [PubMed] [Google Scholar]
- Calo E., Wysocka J. Modification of enhancer chromatin: what, how, and why? Mol. Cell. 2013;49:825–837. doi: 10.1016/j.molcel.2013.01.038. [DOI] [PMC free article] [PubMed] [Google Scholar]
- Chen W., Davidson E.H., MacIsaac Z.M., Kumar A. Mapping the Mandibular Lingula in Pierre Robin Sequence: A Guide to the Inverted-L Osteotomy. J. Craniofac. Surg. 2015;26:1847–1852. doi: 10.1097/SCS.0000000000001945. [DOI] [PubMed] [Google Scholar]
- Cheung M., Briscoe J. Neural crest development is regulated by the transcription factor Sox9. Development. 2003;130:5681–5693. doi: 10.1242/dev.00808. [DOI] [PubMed] [Google Scholar]
- Chung M.T., Levi B., Hyun J.S., Lo D.D., Montoro D.T., Lisiecki J., Bradley J.P., Buchman S.R., Longaker M.T., Wan D.C. Pierre Robin sequence and Treacher Collins hypoplastic mandible comparison using three-dimensional morphometric analysis. J. Craniofac. Surg. 2012;23(7, Suppl 1):1959–1963. doi: 10.1097/SCS.0b013e318258bcf1. [DOI] [PMC free article] [PubMed] [Google Scholar]
- Chuong E.B., Elde N.C., Feschotte C. Regulatory activities of transposable elements: from conflicts to benefits. Nat. Rev. Genet. 2017;18:71–86. doi: 10.1038/nrg.2016.139. [DOI] [PMC free article] [PubMed] [Google Scholar]
- Corces M.R., Trevino A.E., Hamilton E.G., Greenside P.G., Sinnott-Armstrong N.A., Vesuna S., Satpathy A.T., Rubin A.J., Montine K.S., Wu B. An improved ATAC-seq protocol reduces background and enables interrogation of frozen tissues. Nat. Methods. 2017;14:959–962. doi: 10.1038/nmeth.4396. [DOI] [PMC free article] [PubMed] [Google Scholar]
- Davies J.O.J., Telenius J.M., McGowan S.J., Roberts N.A., Taylor S., Higgs D.R., Hughes J.R. Multiplexed analysis of chromosome conformation at vastly improved sensitivity. Nat. Methods. 2016;13:74–80. doi: 10.1038/nmeth.3664. [DOI] [PMC free article] [PubMed] [Google Scholar]
- Day A., Dong J., Funari V.A., Harry B., Strom S.P., Cohn D.H., Nelson S.F. Disease gene characterization through large-scale co-expression analysis. PLoS ONE. 2009;4:e8491. doi: 10.1371/journal.pone.0008491. [DOI] [PMC free article] [PubMed] [Google Scholar]
- de Wit E., Vos E.S.M., Holwerda S.J.B., Valdes-Quezada C., Verstegen M.J.A.M., Teunissen H., Splinter E., Wijchers P.J., Krijger P.H.L., de Laat W. CTCF Binding Polarity Determines Chromatin Looping. Mol. Cell. 2015;60:676–684. doi: 10.1016/j.molcel.2015.09.023. [DOI] [PubMed] [Google Scholar]
- Denas O., Sandstrom R., Cheng Y., Beal K., Herrero J., Hardison R.C., Taylor J. Genome-wide comparative analysis reveals human-mouse regulatory landscape and evolution. BMC Genomics. 2015;16:87. doi: 10.1186/s12864-015-1245-6. [DOI] [PMC free article] [PubMed] [Google Scholar]
- Despang A., Schöpflin R., Franke M., Ali S., Jerković I., Paliou C., Chan W.-L., Timmermann B., Wittler L., Vingron M. Functional dissection of the Sox9-Kcnj2 locus identifies nonessential and instructive roles of TAD architecture. Nat. Genet. 2019;51:1263–1271. doi: 10.1038/s41588-019-0466-z. [DOI] [PubMed] [Google Scholar]
- Dixon J.R., Selvaraj S., Yue F., Kim A., Li Y., Shen Y., Hu M., Liu J.S., Ren B. Topological domains in mammalian genomes identified by analysis of chromatin interactions. Nature. 2012;485:376–380. doi: 10.1038/nature11082. [DOI] [PMC free article] [PubMed] [Google Scholar]
- Dixon J.R., Jung I., Selvaraj S., Shen Y., Antosiewicz-Bourget J.E., Lee A.Y., Ye Z., Kim A., Rajagopal N., Xie W. Chromatin architecture reorganization during stem cell differentiation. Nature. 2015;518:331–336. doi: 10.1038/nature14222. [DOI] [PMC free article] [PubMed] [Google Scholar]
- Dukler N., Gulko B., Huang Y.F., Siepel A. Is a super-enhancer greater than the sum of its parts? Nat. Genet. 2016;49:2–3. doi: 10.1038/ng.3759. [DOI] [PMC free article] [PubMed] [Google Scholar]
- Foster J.W. Mutations in SOX9 cause both autosomal sex reversal and campomelic dysplasia. Acta Paediatr. Jpn. 1996;38:405–411. doi: 10.1111/j.1442-200x.1996.tb03515.x. [DOI] [PubMed] [Google Scholar]
- Franke M., Ibrahim D.M., Andrey G., Schwarzer W., Heinrich V., Schöpflin R., Kraft K., Kempfer R., Jerković I., Chan W.-L. Formation of new chromatin domains determines pathogenicity of genomic duplications. Nature. 2016;538:265–269. doi: 10.1038/nature19800. [DOI] [PubMed] [Google Scholar]
- Funato N., Kokubo H., Nakamura M., Yanagisawa H., Saga Y. Specification of jaw identity by the Hand2 transcription factor. Sci. Rep. 2016;6:28405. doi: 10.1038/srep28405. [DOI] [PMC free article] [PubMed] [Google Scholar]
- Gokhman D., Lavi E., Prüfer K., Fraga M.F., Riancho J.A., Kelso J., Pääbo S., Meshorer E., Carmel L. Reconstructing the DNA Methylation Maps of the Neandertal and the Denisovan. Science. 2014;344:523–528. doi: 10.1126/science.1250368. [DOI] [PubMed] [Google Scholar]
- Gokhman D., Nissim-Rafinia M., Agranat-Tamir L., Housman G., García-Pérez R., Lizano E., Cheronet O., Mallick S., Nieves-Colón M.A., Li H. Differential DNA methylation of vocal and facial anatomy genes in modern humans. Nat. Commun. 2020;11:1189. doi: 10.1038/s41467-020-15020-6. [DOI] [PMC free article] [PubMed] [Google Scholar]
- Gonen N., Futtner C.R., Wood S., Garcia-Moreno S.A., Salamone I.M., Samson S.C., Sekido R., Poulat F., Maatouk D.M., Lovell-Badge R. Sex reversal following deletion of a single distal enhancer of Sox9. Science. 2018;360:1469–1473. doi: 10.1126/science.aas9408. [DOI] [PMC free article] [PubMed] [Google Scholar]
- Gordon C.T., Tan T.Y., Benko S., Fitzpatrick D., Lyonnet S., Farlie P.G. Long-range regulation at the SOX9 locus in development and disease. J. Med. Genet. 2009;46:649–656. doi: 10.1136/jmg.2009.068361. [DOI] [PubMed] [Google Scholar]
- Gordon C.T., Attanasio C., Bhatia S., Benko S., Ansari M., Tan T.Y., Munnich A., Pennacchio L.A., Abadie V., Temple I.K. Identification of novel craniofacial regulatory domains located far upstream of SOX9 and disrupted in Pierre Robin sequence. Hum. Mutat. 2014;35:1011–1020. doi: 10.1002/humu.22606. [DOI] [PMC free article] [PubMed] [Google Scholar]
- Grant C.E., Bailey T.L., Noble W.S. FIMO: scanning for occurrences of a given motif. Bioinformatics. 2011;27:1017–1018. doi: 10.1093/bioinformatics/btr064. [DOI] [PMC free article] [PubMed] [Google Scholar]
- Guo Y., Xu Q., Canzio D., Shou J., Li J., Gorkin D.U., Jung I., Wu H., Zhai Y., Tang Y. CRISPR Inversion of CTCF Sites Alters Genome Topology and Enhancer/Promoter Function. Cell. 2015;162:900–910. doi: 10.1016/j.cell.2015.07.038. [DOI] [PMC free article] [PubMed] [Google Scholar]
- Gupta S., Stamatoyannopoulos J.A., Bailey T.L., Noble W.S. Quantifying similarity between motifs. Genome Biol. 2007;8:R24. doi: 10.1186/gb-2007-8-2-r24. [DOI] [PMC free article] [PubMed] [Google Scholar]
- Hay D., Hughes J.R., Babbs C., Davies J.O.J., Graham B.J., Hanssen L., Kassouf M.T., Marieke Oudelaar A.M., Sharpe J.A., Suciu M.C. Genetic dissection of the α-globin super-enhancer in vivo. Nat. Genet. 2016;48:895–903. doi: 10.1038/ng.3605. [DOI] [PMC free article] [PubMed] [Google Scholar]
- Herranz D., Ambesi-Impiombato A., Palomero T., Schnell S.A., Belver L., Wendorff A.A., Xu L., Castillo-Martin M., Llobet-Navás D., Cordon-Cardo C. A NOTCH1-driven MYC enhancer promotes T cell development, transformation and acute lymphoblastic leukemia. Nat. Med. 2014;20:1130–1137. doi: 10.1038/nm.3665. [DOI] [PMC free article] [PubMed] [Google Scholar]
- Ho T.V., Iwata J., Ho H.A., Grimes W.C., Park S., Sanchez-Lara P.A., Chai Y. Integration of comprehensive 3D microCT and signaling analysis reveals differential regulatory mechanisms of craniofacial bone development. Dev. Biol. 2015;400:180–190. doi: 10.1016/j.ydbio.2015.02.010. [DOI] [PMC free article] [PubMed] [Google Scholar]
- Hughes J.R., Roberts N., McGowan S., Hay D., Giannoulatou E., Lynch M., De Gobbi M., Taylor S., Gibbons R., Higgs D.R. Analysis of hundreds of cis-regulatory landscapes at high resolution in a single, high-throughput experiment. Nat. Genet. 2014;46:205–212. doi: 10.1038/ng.2871. [DOI] [PubMed] [Google Scholar]
- Ikeda K., Uchida N., Nishimura T., White J., Martin R.M., Nakauchi H., Sebastiano V., Weinberg K.I., Porteus M.H. Efficient scarless genome editing in human pluripotent stem cells. Nat. Methods. 2018;15:1045–1047. doi: 10.1038/s41592-018-0212-y. [DOI] [PubMed] [Google Scholar]
- Jiang H., Lei R., Ding S.W., Zhu S. Skewer: a fast and accurate adapter trimmer for next-generation sequencing paired-end reads. BMC Bioinformatics. 2014;15:182. doi: 10.1186/1471-2105-15-182. [DOI] [PMC free article] [PubMed] [Google Scholar]
- Kent W.J., Sugnet C.W., Furey T.S., Roskin K.M., Pringle T.H., Zahler A.M., Haussler D. The human genome browser at UCSC. Genome Res. 2002;12:996–1006. doi: 10.1101/gr.229102. [DOI] [PMC free article] [PubMed] [Google Scholar]
- Kim D., Paggi J.M., Park C., Bennett C., Salzberg S.L. Graph-based genome alignment and genotyping with HISAT2 and HISAT-genotype. Nat. Biotechnol. 2019;37:907–915. doi: 10.1038/s41587-019-0201-4. [DOI] [PMC free article] [PubMed] [Google Scholar]
- Kortüm F., Das S., Flindt M., Morris-Rosendahl D.J., Stefanova I., Goldstein A., Horn D., Klopocki E., Kluger G., Martin P. The core FOXG1 syndrome phenotype consists of postnatal microcephaly, severe mental retardation, absent language, dyskinesia, and corpus callosum hypogenesis. J. Med. Genet. 2011;48:396–406. doi: 10.1136/jmg.2010.087528. [DOI] [PMC free article] [PubMed] [Google Scholar]
- Kurth I., Klopocki E., Stricker S., van Oosterwijk J., Vanek S., Altmann J., Santos H.G., van Harssel J.J.T., de Ravel T., Wilkie A.O.M. Duplications of noncoding elements 5′ of SOX9 are associated with brachydactyly-anonychia. Nat. Genet. 2009;41:862–863. doi: 10.1038/ng0809-862. [DOI] [PubMed] [Google Scholar]
- Labun K., Montague T.G., Gagnon J.A., Thyme S.B., Valen E. CHOPCHOP v2: a web tool for the next generation of CRISPR genome engineering. Nucleic Acids Res. 2016;44(W1):W272-6. doi: 10.1093/nar/gkw398. [DOI] [PMC free article] [PubMed] [Google Scholar]
- Labun K., Montague T.G., Krause M., Torres Cleuren Y.N., Tjeldnes H., Valen E. CHOPCHOP v3: expanding the CRISPR web toolbox beyond genome editing. Nucleic Acids Res. 2019;47(W1):W171–W174. doi: 10.1093/nar/gkz365. [DOI] [PMC free article] [PubMed] [Google Scholar]
- Langmead B., Salzberg S.L. Fast gapped-read alignment with Bowtie 2. Nat. Methods. 2012;9:357–359. doi: 10.1038/nmeth.1923. [DOI] [PMC free article] [PubMed] [Google Scholar]
- Laugsch M., Bartusel M., Rehimi R., Alirzayeva H., Karaolidou A., Crispatzu G., Zentis P., Nikolic M., Bleckwehl T., Kolovos P. Modeling the Pathological Long-Range Regulatory Effects of Human Structural Variation with Patient-Specific hiPSCs. Cell Stem Cell. 2019;24:736–752.e12. doi: 10.1016/j.stem.2019.03.004. [DOI] [PubMed] [Google Scholar]
- Lee Y.H., Saint-Jeannet J.P. Sox9 function in craniofacial development and disease. Genesis. 2011;49:200–208. doi: 10.1002/dvg.20717. [DOI] [PMC free article] [PubMed] [Google Scholar]
- Lefebvre V., Dvir-Ginzberg M. SOX9 and the many facets of its regulation in the chondrocyte lineage. Connect. Tissue Res. 2016;58:2–14. doi: 10.1080/03008207.2016.1183667. [DOI] [PMC free article] [PubMed] [Google Scholar]
- Lettice L.A., Heaney S.J.H., Purdie L.A., Li L., de Beer P., Oostra B.A., Goode D., Elgar G., Hill R.E., de Graaff E. A long-range Shh enhancer regulates expression in the developing limb and fin and is associated with preaxial polydactyly. Hum. Mol. Genet. 2003;12:1725–1735. doi: 10.1093/hmg/ddg180. [DOI] [PubMed] [Google Scholar]
- Lewis A.E., Vasudevan H.N., O’Neill A.K., Soriano P., Bush J.O. The widely used Wnt1-Cre transgene causes developmental phenotypes by ectopic activation of Wnt signaling. Dev. Biol. 2013;379:229–234. doi: 10.1016/j.ydbio.2013.04.026. [DOI] [PMC free article] [PubMed] [Google Scholar]
- Li H., Handsaker B., Wysoker A., Fennell T., Ruan J., Homer N., Marth G., Abecasis G., Durbin R., 1000 Genome Project Data Processing Subgroup The Sequence Alignment/Map format and SAMtools. Bioinformatics. 2009;25:2078–2079. doi: 10.1093/bioinformatics/btp352. [DOI] [PMC free article] [PubMed] [Google Scholar]
- Liao Y., Smyth G.K., Shi W. featureCounts: an efficient general purpose program for assigning sequence reads to genomic features. Bioinformatics. 2014;30:923–930. doi: 10.1093/bioinformatics/btt656. [DOI] [PubMed] [Google Scholar]
- Limberg M.M., Zumhagen S., Netter M.F., Coffey A.J., Grace A., Rogers J., Böckelmann D., Rinné S., Stallmeyer B., Decher N., Schulze-Bahr E. Non dominant-negative KCNJ2 gene mutations leading to Andersen-Tawil syndrome with an isolated cardiac phenotype. Basic Res. Cardiol. 2013;108:353. doi: 10.1007/s00395-013-0353-1. [DOI] [PubMed] [Google Scholar]
- Liu T., Ortiz J.A., Taing L., Meyer C.A., Lee B., Zhang Y., Shin H., Wong S.S., Ma J., Lei Y. Cistrome: an integrative platform for transcriptional regulation studies. Genome Biol. 2011;12:R83. doi: 10.1186/gb-2011-12-8-r83. [DOI] [PMC free article] [PubMed] [Google Scholar]
- Long H.K., Prescott S.L., Wysocka J. Ever-Changing Landscapes: Transcriptional Enhancers in Development and Evolution. Cell. 2016;167:1170–1187. doi: 10.1016/j.cell.2016.09.018. [DOI] [PMC free article] [PubMed] [Google Scholar]
- Lupiáñez D.G., Kraft K., Heinrich V., Krawitz P., Brancati F., Klopocki E., Horn D., Kayserili H., Opitz J.M., Laxova R. Disruptions of topological chromatin domains cause pathogenic rewiring of gene-enhancer interactions. Cell. 2015;161:1012–1025. doi: 10.1016/j.cell.2015.04.004. [DOI] [PMC free article] [PubMed] [Google Scholar]
- Martin M. Cutadapt removes adapter sequences from high-throughput sequencing reads. EMBnet. J. 2011;17:10–12. [Google Scholar]
- Martinez C.M., McGee M.D., Borstein S.R., Wainwright P.C. Feeding ecology underlies the evolution of cichlid jaw mobility. Evolution. 2018;72:1645–1655. doi: 10.1111/evo.13518. [DOI] [PubMed] [Google Scholar]
- Meloro C., Cáceres N.C., Carotenuto F., Sponchiado J., Melo G.L., Passaro F., Raia P. Chewing on the trees: Constraints and adaptation in the evolution of the primate mandible. Evolution. 2015;69:1690–1700. doi: 10.1111/evo.12694. [DOI] [PubMed] [Google Scholar]
- Minoux M., Rijli F.M. Molecular mechanisms of cranial neural crest cell migration and patterning in craniofacial development. Development. 2010;137:2605–2621. doi: 10.1242/dev.040048. [DOI] [PubMed] [Google Scholar]
- Mohun T.J., Weninger W.J. Episcopic three-dimensional imaging of embryos. Cold Spring Harb. Protoc. 2012;2012:641–646. doi: 10.1101/pdb.top069567. [DOI] [PubMed] [Google Scholar]
- Mohun T.J., Weninger W.J. Embedding embryos for high-resolution episcopic microscopy (HREM) Cold Spring Harb. Protoc. 2012;2012:678–680. doi: 10.1101/pdb.prot069583. [DOI] [PubMed] [Google Scholar]
- Moorthy S.D., Davidson S., Shchuka V.M., Singh G., Malek-Gilani N., Langroudi L., Martchenko A., So V., Macpherson N.N., Mitchell J.A. Enhancers and super-enhancers have an equivalent regulatory role in embryonic stem cells through regulation of single or multiple genes. Genome Res. 2017;27:246–258. doi: 10.1101/gr.210930.116. [DOI] [PMC free article] [PubMed] [Google Scholar]
- Mori-Akiyama Y., Akiyama H., Rowitch D.H., de Crombrugghe B. Sox9 is required for determination of the chondrogenic cell lineage in the cranial neural crest. Proc. Natl. Acad. Sci. USA. 2003;100:9360–9365. doi: 10.1073/pnas.1631288100. [DOI] [PMC free article] [PubMed] [Google Scholar]
- Osterwalder M., Barozzi I., Tissières V., Fukuda-Yuzawa Y., Mannion B.J., Afzal S.Y., Lee E.A., Zhu Y., Plajzer-Frick I., Pickle C.S. Enhancer redundancy provides phenotypic robustness in mammalian development. Nature. 2018;554:239–243. doi: 10.1038/nature25461. [DOI] [PMC free article] [PubMed] [Google Scholar]
- Parsons T.E., Weinberg S.M., Khaksarfard K., Howie R.N., Elsalanty M., Yu J.C., Cray J.J., Jr. Craniofacial Shape Variation in Twist1+/− Mutant Mice. Anat. Rec. 2014;297:826–833. doi: 10.1002/ar.22899. [DOI] [PubMed] [Google Scholar]
- Prescott S.L., Srinivasan R., Marchetto M.C., Grishina I., Narvaiza I., Selleri L., Gage F.H., Swigut T., Wysocka J. Enhancer divergence and cis-regulatory evolution in the human and chimp neural crest. Cell. 2015;163:68–83. doi: 10.1016/j.cell.2015.08.036. [DOI] [PMC free article] [PubMed] [Google Scholar]
- Qin Q., Xu Y., He T., Qin C., Xu J. Normal and disease-related biological functions of Twist1 and underlying molecular mechanisms. Cell Res. 2012;22:90–106. doi: 10.1038/cr.2011.144. [DOI] [PMC free article] [PubMed] [Google Scholar]
- Quinlan A.R., Hall I.M. BEDTools: a flexible suite of utilities for comparing genomic features. Bioinformatics. 2010;26:841–842. doi: 10.1093/bioinformatics/btq033. [DOI] [PMC free article] [PubMed] [Google Scholar]
- Rada-Iglesias A., Bajpai R., Prescott S., Brugmann S.A., Swigut T., Wysocka J. Epigenomic annotation of enhancers predicts transcriptional regulators of human neural crest. Cell Stem Cell. 2012;11:633–648. doi: 10.1016/j.stem.2012.07.006. [DOI] [PMC free article] [PubMed] [Google Scholar]
- Raia P., Boggioni M., Carotenuto F., Castiglione S., Di Febbraro M., Di Vincenzo F., Melchionna M., Mondanaro A., Papini A., Profico A. Unexpectedly rapid evolution of mandibular shape in hominins. Sci. Rep. 2018;8:7340. doi: 10.1038/s41598-018-25309-8. [DOI] [PMC free article] [PubMed] [Google Scholar]
- Rathé M., Rayyan M., Schoenaers J., Dormaar J.T., Breuls M., Verdonck A., Devriendt K., Poorten V.V., Hens G. Pierre Robin sequence: Management of respiratory and feeding complications during the first year of life in a tertiary referral centre. Int. J. Pediatr. Otorhinolaryngol. 2015;79:1206–1212. doi: 10.1016/j.ijporl.2015.05.012. [DOI] [PubMed] [Google Scholar]
- R Core Team . R Foundation for Statistical Computing; 2019. R: A language and environment for statistical computing. [Google Scholar]
- Ren G., Jin W., Cui K., Rodrigez J., Hu G., Zhang Z., Larson D.R., Zhao K. CTCF-Mediated Enhancer-Promoter Interaction Is a Critical Regulator of Cell-to-Cell Variation of Gene Expression. Mol. Cell. 2017;67:1049–1058.e6. doi: 10.1016/j.molcel.2017.08.026. [DOI] [PMC free article] [PubMed] [Google Scholar]
- Robin P. A fall of the base of the tongue considered as a new cause of nasopharyngeal respiratory impairment: Pierre Robin sequence. A translation. 1923. Plast. Reconstr. Surg. 1994;93:1301–1303. [PubMed] [Google Scholar]
- Sanchez-Castro M., Gordon C.T., Petit F., Nord A.S., Callier P., Andrieux J., Guérin P., Pichon O., David A., Abadie V. Congenital Heart Defects in Patients with Deletions Upstream of SOX9. Hum. Mutat. 2013;34:1628–1631. doi: 10.1002/humu.22449. [DOI] [PubMed] [Google Scholar]
- Schoenfelder S., Fraser P. Long-range enhancer-promoter contacts in gene expression control. Nat. Rev. Genet. 2019;20:437–455. doi: 10.1038/s41576-019-0128-0. [DOI] [PubMed] [Google Scholar]
- Shen Y., Yue F., McCleary D.F., Ye Z., Edsall L., Kuan S., Wagner U., Dixon J., Lee L., Lobanenkov V.V., Ren B. A map of the cis-regulatory sequences in the mouse genome. Nature. 2012;488:116–120. doi: 10.1038/nature11243. [DOI] [PMC free article] [PubMed] [Google Scholar]
- Shin H.Y., Willi M., HyunYoo K., Zeng X., Wang C., Metser G., Hennighausen L. Hierarchy within the mammary STAT5-driven Wap super-enhancer. Nat. Genet. 2016;48:904–911. doi: 10.1038/ng.3606. [DOI] [PMC free article] [PubMed] [Google Scholar]
- Spitz F. Gene regulation at a distance: From remote enhancers to 3D regulatory ensembles. Semin. Cell Dev. Biol. 2016;57:57–67. doi: 10.1016/j.semcdb.2016.06.017. [DOI] [PubMed] [Google Scholar]
- Spokony R.F., Aoki Y., Saint-Germain N., Magner-Fink E., Saint-Jeannet J.-P. The transcription factor Sox9 is required for cranial neural crest development in Xenopus. Development. 2002;129:421–432. doi: 10.1242/dev.129.2.421. [DOI] [PubMed] [Google Scholar]
- Suri S., Ross R.B., Tompson B.D. Craniofacial morphology and adolescent facial growth in Pierre Robin sequence. Am. J. Orthod. Dentofacial Orthop. 2010;137:763–774. doi: 10.1016/j.ajodo.2008.07.020. [DOI] [PubMed] [Google Scholar]
- Susarla S.M., Vasilakou N., Kapadia H., Egbert M., Hopper R.A., Evans K.N. Defining mandibular morphology in Robin sequence: A matched case-control study. Am. J. Med. Genet. A. 2017;173:1831–1838. doi: 10.1002/ajmg.a.38248. [DOI] [PubMed] [Google Scholar]
- Tan T.Y., Farlie P.G. Rare syndromes of the head and face-Pierre Robin sequence. Wiley Interdiscip. Rev. Dev. Biol. 2013;2:369–377. doi: 10.1002/wdev.69. [DOI] [PubMed] [Google Scholar]
- Tan T.Y., Kilpatrick N., Farlie P.G. Developmental and genetic perspectives on pierre robin sequence. Am. J. Med. Genet. Part C Semin. Med. Genetik. 2013;163:295–305. doi: 10.1002/ajmg.c.31374. [DOI] [PubMed] [Google Scholar]
- Tawil R., Ptacek L.J., Pavlakis S.G., DeVivo D.C., Penn A.S., Özdemir C., Griggs R.C. Andersen’s syndrome: potassium-sensitive periodic paralysis, ventricular ectopy, and dysmorphic features. Ann. Neurol. 1994;35:326–330. doi: 10.1002/ana.410350313. [DOI] [PubMed] [Google Scholar]
- Terhune C.E., Robinson C.A., Ritzman T.B. Ontogenetic variation in the mandibular ramus of great apes and humans. J. Morphol. 2014;275:661–677. doi: 10.1002/jmor.20246. [DOI] [PubMed] [Google Scholar]
- Terhune C.E., Ritzman T.B., Robinson C.A. Mandibular ramus shape variation and ontogeny in Homo sapiens and Homo neanderthalensis. J. Hum. Evol. 2018;121:55–71. doi: 10.1016/j.jhevol.2018.03.009. [DOI] [PubMed] [Google Scholar]
- Trainor P.A., Melton K.R., Manzanares M. Origins and plasticity of neural crest cells and their roles in jaw and craniofacial evolution. Int. J. Dev. Biol. 2003;47:541–553. [PubMed] [Google Scholar]
- Uslu V.V., Petretich M., Ruf S., Langenfeld K., Fonseca N.A., Marioni J.C., Spitz F. Long-range enhancers regulating Myc expression are required for normal facial morphogenesis. Nat. Genet. 2014;46:753–758. doi: 10.1038/ng.2971. [DOI] [PubMed] [Google Scholar]
- Varshney G.K., Pei W., LaFave M.C., Idol J., Xu L., Gallardo V., Carrington B., Bishop K., Jones M., Li M. High-throughput gene targeting and phenotyping in zebrafish using CRISPR/Cas9. Genome Res. 2015;25:1030–1042. doi: 10.1101/gr.186379.114. [DOI] [PMC free article] [PubMed] [Google Scholar]
- Villar D., Berthelot C., Aldridge S., Rayner T.F., Lukk M., Pignatelli M., Park T.J., Deaville R., Erichsen J.T., Jasinska A.J. Enhancer evolution across 20 mammalian species. Cell. 2015;160:554–566. doi: 10.1016/j.cell.2015.01.006. [DOI] [PMC free article] [PubMed] [Google Scholar]
- Visel A., Minovitsky S., Dubchak I., Pennacchio L.A. VISTA Enhancer Browser--a database of tissue-specific human enhancers. Nucleic Acids Res. 2007;35:D88–D92. doi: 10.1093/nar/gkl822. [DOI] [PMC free article] [PubMed] [Google Scholar]
- Volk A.S., Davis M.J., Narawane A.M., Abu-Ghname A., Dempsey R.F., Lambert E.M., Tran B., Wirthlin J.O., Buchanan E.P. Quantification of Mandibular Morphology in Pierre Robin Sequence to Optimize Mandibular Distraction Osteogenesis. Cleft Palate Craniofacial J. 2020;57:1032–1040. doi: 10.1177/1055665620913780. [DOI] [PubMed] [Google Scholar]
- Wagih O. ggseqlogo: a versatile R package for drawing sequence logos. Bioinformatics. 2017;33:3645–3647. doi: 10.1093/bioinformatics/btx469. [DOI] [PubMed] [Google Scholar]
- Wagner T., Wirth J., Meyer J., Zabel B., Held M., Zimmer J., Pasantes J., Bricarelli F.D., Keutel J., Hustert E. Autosomal sex reversal and campomelic dysplasia are caused by mutations in and around the SRY-related gene SOX9. Cell. 1994;79:1111–1120. doi: 10.1016/0092-8674(94)90041-8. [DOI] [PubMed] [Google Scholar]
- Welsh I.C., Hart J., Brown J.M., Hansen K., Rocha Marques M., Aho R.J., Grishina I., Hurtado R., Herzlinger D., Ferretti E. Pbx loss in cranial neural crest, unlike in epithelium, results in cleft palate only and a broader midface. J. Anat. 2018;233:222–242. doi: 10.1111/joa.12821. [DOI] [PMC free article] [PubMed] [Google Scholar]
- Wickham H. Springer; 2016. ggplot2: Elegant Graphics for Data Analysis. [Google Scholar]
- Wilderman A., VanOudenhove J., Kron J., Noonan J.P., Cotney J. High-Resolution Epigenomic Atlas of Human Embryonic Craniofacial Development. Cell Rep. 2018;23:1581–1597. doi: 10.1016/j.celrep.2018.03.129. [DOI] [PMC free article] [PubMed] [Google Scholar]
- Wyganowska-Świątkowska M., Przystańska A. The Meckel’s cartilage in human embryonic and early fetal periods. Anat. Sci. Int. 2011;86:98–107. doi: 10.1007/s12565-010-0093-3. [DOI] [PubMed] [Google Scholar]
- Yue F., Cheng Y., Breschi A., Vierstra J., Wu W., Ryba T., Sandstrom R., Ma Z., Davis C., Pope B.D., Mouse ENCODE Consortium A comparative encyclopedia of DNA elements in the mouse genome. Nature. 2014;515:355–364. doi: 10.1038/nature13992. [DOI] [PMC free article] [PubMed] [Google Scholar]
- Zeevaert R., Foulquier F., Dimitrov B., Reynders E., Van Damme-Lombaerts R., Simeonov E., Annaert W., Matthijs G., Jaeken J. Cerebrocostomandibular-like syndrome and a mutation in the conserved oligomeric Golgi complex, subunit 1. Hum. Mol. Genet. 2009;18:517–524. doi: 10.1093/hmg/ddn379. [DOI] [PubMed] [Google Scholar]
- Zellner E.G., Reid R.R., Steinbacher D.M. The Pierre Robin Mandible is Hypoplastic and Morphologically Abnormal. J. Craniofac. Surg. 2017;28:1946–1949. doi: 10.1097/SCS.0000000000003974. [DOI] [PubMed] [Google Scholar]
- Zhang Y., Liu T., Meyer C.A., Eeckhoute J., Johnson D.S., Bernstein B.E., Nusbaum C., Myers R.M., Brown M., Li W., Liu X.S. Model-based analysis of ChIP-Seq (MACS) Genome Biol. 2008;9:R137. doi: 10.1186/gb-2008-9-9-r137. [DOI] [PMC free article] [PubMed] [Google Scholar]
- Zhang Y., Blackwell E.L., McKnight M.T., Knutsen G.R., Vu W.T., Ruest L.B. Specific inactivation of Twist1 in the mandibular arch neural crest cells affects the development of the ramus and reveals interactions with hand2. Dev. Dyn. 2012;241:924–940. doi: 10.1002/dvdy.23776. [DOI] [PMC free article] [PubMed] [Google Scholar]
Associated Data
This section collects any data citations, data availability statements, or supplementary materials included in this article.
Supplementary Materials
Data Availability Statement
The accession number for Gene Expression Ombnibus (GEO) where the ChIP-seq, ATAC-seq, and RNA-seq datasets generated in this study are available is: GSE145327 (https://www.ncbi.nlm.nih.gov/geo/query/acc.cgi?acc=GSE145327). The accession number for the Sequence Read Archive (SRA) BioProject where the 10X Genomics linked-read sequencing data is available is: PRJNA648128.