

Abstract
Oncogenic mutations in RAS genes, like KRASG12D or NRASG12D, trap Ras in the active state and cause myeloproliferative disorder and T cell leukemia (T-ALL) when induced in the bone marrow via Mx1CRE. The RAS exchange factor RASGRP1 is frequently overexpressed in T-ALL patients. In T-ALL cell lines overexpression of RASGRP1 increases flux through the RASGTP/RasGDP cycle. Here we expanded RASGRP1 expression surveys in pediatric T-ALL and generated a RoLoRiG mouse model crossed to Mx1CRE to determine the consequences of induced RASGRP1 overexpression in primary hematopoietic cells. RASGRP1-overexpressing, GFP-positive cells outcompeted wild type cells and dominated the peripheral blood compartment over time. RASGRP1 overexpression bestows gain-of-function colony formation properties to bone marrow progenitors in medium containing limited growth factors. RASGRP1 overexpression enhances baseline mTOR-S6 signaling in the bone marrow, but not in vitro cytokine-induced signals. In agreement with these mechanistic findings, hRASGRP1-ires-EGFP enhances fitness of stem- and progenitor- cells, but only in the context of native hematopoiesis. RASGRP1 overexpression is distinct from KRASG12D or NRASG12D, does not cause acute leukemia on its own, and leukemia virus insertion frequencies predict that RASGRP1 overexpression can effectively cooperate with lesions in many other genes to cause acute T cell leukemia.
Keywords: Leukemia, bone marrow, T-ALL, RAS signaling, RASGRP1, cytokines, progenitor, stem cells, hematopoiesis
INTRODUCTION
Acute lymphoblastic leukemia (ALL) is an aggressive bone marrow (BM) malignancy. Approximately 15% of pediatric and 25% of adult cases of ALL are diagnosed as T-cell ALL (T-ALL) cog. In the clinic, T-ALL patients receive combination chemotherapy, sometimes combined with BM transplantation1. Understanding the molecularly altered biochemical pathways implicated in T-ALL is critical to developing effective molecular therapy (precision medicine). One commonly affected pathway is the RAS pathway with roughly 50% of all patient T-ALL cases demonstrating hyperactive RAS signals in the BM2. There are two major mechanisms of leukemogenic RAS signals in T-ALL patients; the first consists of somatic activating mutations of small RAS GTPases themselves and a second mechanism is through deregulated overexpression of the RAS activator RASGRP1 (RAS guanine nucleotide releasing protein 1)3,4.
Oncogenic mutations in RAS are among the most common somatic mutations in cancer. Mutations in glycine at codon 12 in KRAS (KRASG12) are prevalent in cancer and result in severely impaired GTPase activity and elevated levels of constitutively active, GTP-bound KRAS5. In hematopoietic malignancies, mutations in NRAS are 2 to 3 times more frequent than those in KRAS6,7, including pediatric T-ALL8. Generation of KrasG12D mice aided the field of cancer research and oncogenic RAS signaling; these mice express a mutation of glycine to aspartic acid at codon 12 from the endogenous Kras locus in a controlled and inducible manner via a LoxP-STOP-LoxP cassette5. In BM cells, oncogenic KRASG12D can be inducibly expressed using Mx1CRE transgenic mice; in this model CRE is expressed from the IFN-α/β-inducible Mx1 promoter by administration of polyinosinic-polycytidylic acid (pIpC)9. Such KRASG12D mice develop a lethal myeloproliferative disease (MPD) resulting in death around 35 days10,11. In the background a T-ALL exists, which is suppressed by the MPD, but can be revealed via transplantation of KRASG12D hematopoietic stem cells into irradiated recipient mice11–13. Mx1CRE-driven NRASG12D mutation does not lead to acute MPD14. Instead mice develop a chronic myeloproliferative disorder and succumb to hematological disease by 15 months on a C57Bl/6 × 129/Sv.jae background but displaying a median survival of 588 days on a C57Bl/6 background15.
We reported deregulated overexpression of the RAS guanine nucleotide exchange factor RASGRP1 in T-ALL patients3,4. RASGRP1 has a growth promoting role in T-cell leukemia3 and skin cancer16. RASGRP1 overexpression through retroviral transduction or via transgenic expression in thymocytes can trigger a leukemic phenotype17–19, but to date no genetic animal model exists to overexpress RASGRP1 in the BM in a controlled and inducible manner. As a consequence, mechanistic insights into overexpression of this RASGEF in an in vivo mouse model are lacking. Here we characterized a new RoLoRiG mouse model that allows for pIpC-induced overexpression of RASGRP1 and tracing of these BM cells with an ires-EGFP cassette. We report that overexpression of RASGRP1 results in increased baseline signals, increased spontaneous colony formation in vitro, and increased stem- and progenitor- cell fitness in vivo in the native bone hematopoiesis setting without acute leukemia development.
RESULTS
Inducible overexpression of hRASGRP1: RoLoRiG mouse generation
The small GTPase RAS is activated through RAS guanine nucleotide exchange factors (RASGEFs) and deactivated by RASGAPs (RAS GTPase Activating Proteins)20,21. We previously analyzed Affymetric gene array data on 107 pediatric T-ALL patients treated on COG (Children Oncology Group) studies 9404 and AALL043422. We reported a unique range from low to high expression of RASGRP1 that was not seen for RASGRP2, RASGRP3, or RASGRP4, nor for the other RASGEFs RASGRF1, RASGRF2, SOS1, and SOS23. Likewise, expression levels of ten RASGAP family members where fairly even over these 107 pediatric T-ALL patients23. Capitalizing on HTSeq24 and DESeq packages25 for gene expression normalization, we next analyzed RASGRP1 mRNA expression levels in 265 pediatric (n=250, age < 18yrs) and young adult (n=15, age ≥18) T-ALL from the COG AALL0434 cohort22 and observed a 100-fold range in expression levels (Figure 1A). Using integrated genomic analysis, Liu et al.8 identified six subsets of T-ALL that are characterized by six distinct genomic nodes and also represent different T cell development stages (Figure 1B)8. Examination of these LMO2/LYL1-, HOXA-, TLX3-, TLX1-, NKX2–1-, and TAL1- subsets did not reveal a clear pattern for RasGRP1 expression based on these nodes (Figure 1C). During normal T cell development, RasGRP1 levels are low in early thymocyte progenitors (DN, double negative), increase significantly in DP cells (CD4+CD8+; double positive) and peak in SP (single positive) thymocytes to drop again in peripheral T cells26,27. Thus, the RasGRP1 expression we observe in the six genomic nodes does not follow the physiological pattern seen for normal mouse T cell development.
Figure 1: T-ALL patient analysis and mouse models.
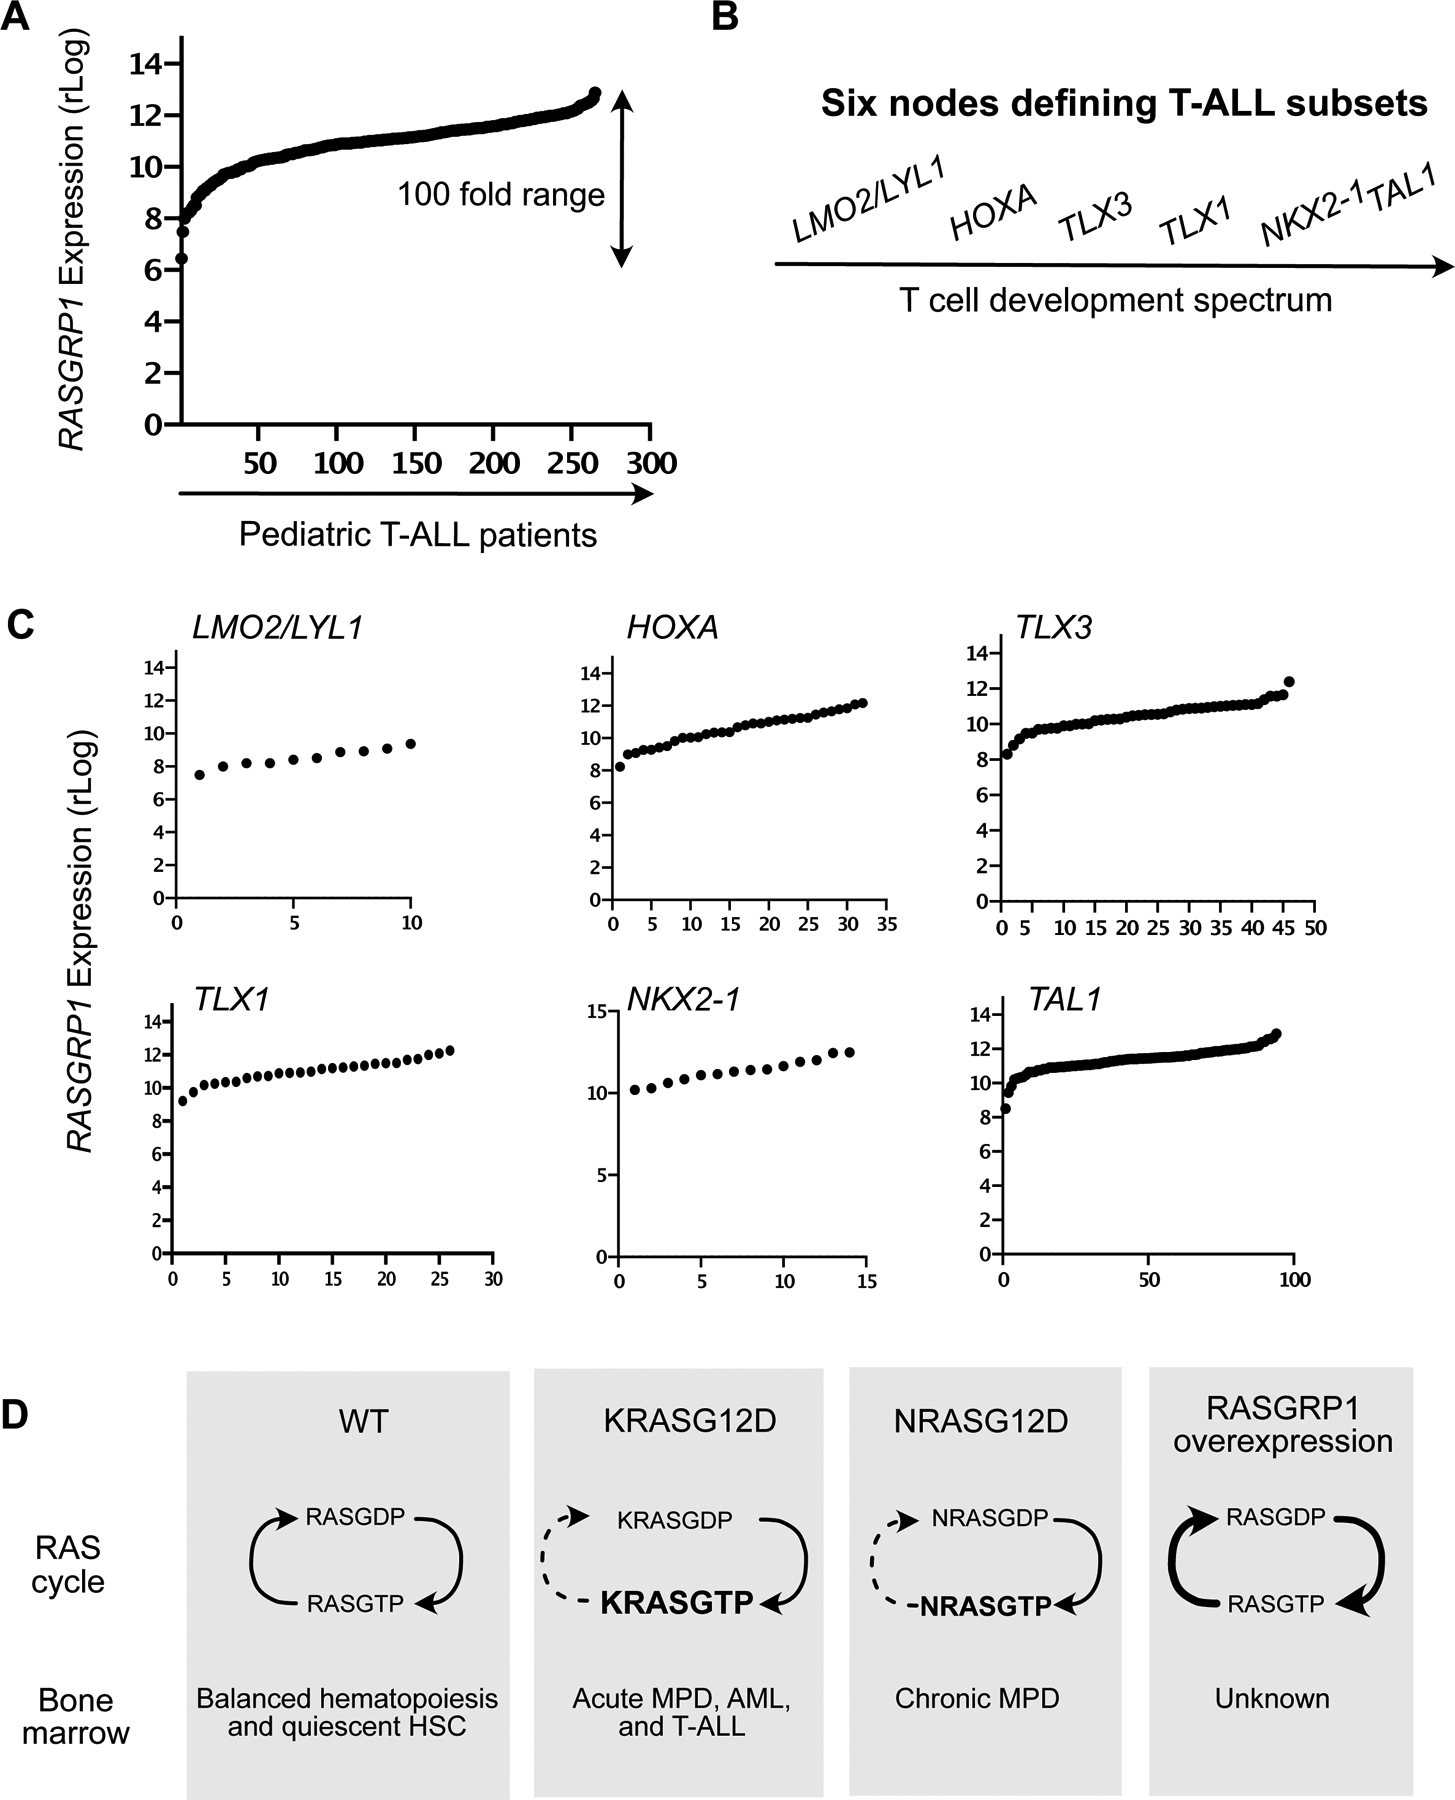
(A) Regularized log (rLog, normalized by DESeq2 R package) gene expression values of RASGRP1 expression in 264 pediatric T-ALL patients.
(B) Schematic of six subtypes in T-ALL.
(C) rLog values of RASGRP1 expression, plotted in the distinct LMO2/LYL1-, HOXA-, TLX3-, TLX1-, NKX2–1-, and TAL1- nodes.
(D) Schematic representation of possible signaling networks in the BM of normal, oncogenic KrasG12D and hRASGRP1 overexpressing mice.
Hematopoietic stem- and progenitor- cell homeostasis is regulated by the BM niche28 and cytokines released by stromal cells in this niche29. Cytokines can trigger RAS activation and RASGTP transmits signals to downstream effector kinase pathways, such as the RAF-MEK-ERK, Phosphatidylinositol 3-kinase (PI3K)-AKT and mTORC1-S6 and mTORC2-AKT pathways4,20,30,31. In T-ALL cell lines, KRASG12D causes high baseline RASGTP levels4,32, whereas overexpressed RASGRP1 constitutively loads RAS with GTP and RASGTP is constantly hydrolyzed back to inactive RASGDP4 (Figure 1D). KrasG12D in hematopoietic cells leads to elevated RASGTP levels at baseline11,15, whereas increases in RASGTP are more modest for NrasG12D15. Examination of RASGTP-effector kinase pathways in KrasG12D and NrasG12D BM subsets reveals differential perturbations depending on the cytokine stimulus used and the BM subset analyzed14,15,33. The biochemical and cellular consequences of RASGRP1 overexpression in BM are unknown (Figure 1D).
A new RoLoRiG mouse model: Blood analysis reveals that hRASGRP1 overexpression bestows increased fitness to T-, B-, and myeloid- lineages
To create a model for overexpression of RASGRP1 in the BM, a cassette containing LoxP-STOP-LoxP, followed by hRASGRP1-ires-EGFP was knocked into the Rosa26 locus34, in the reverse orientation and driven by the CAG promoter35. We termed this strain RoLoRiG (for Rosa26-LoxSTOPLox-RASsGRP1-ires-GFP) (Figure 2A) and maintained it on a C57Bl/6 background. RoLoRiG mice were crossed to Mx1CRE mice and genotyped to verify RoLoRiG and Mx1CRE alleles (Supplemental Figure S1A). A single dose of pIpC given to RoLoRiG+/+Mx1CRE+ mice resulted in expression of human RASGRP1 at levels in the range of what is observed for the human T-ALL cell line Jurkat4,21. In contrast, no hRASGRP1 expression was detected for RoLoRiG+/+Mx1CRE- mice (Figure 2B).
Figure 2: In vivo accumulation of hRASGRP1-overexpressing cells in RoLoRiG mouse model.

(A) Schematic representation of the RoLoRiG model with overexpression of hRASGRP1-ires-EGFP. hRASGRP1 stands for human RASGRP1. hRASGRP1-ires-EGFP construct was knocked into the Rosa26 locus. A stop codon is flanked by LoxP sites, which is excised when CRE recombinase is induced by injection of polyinosinic-polycytidylic acid (pIpC).
(B) Representative Western Blot showing expression of hRASGRP1 detected with a human-specific monoclonal antibody in lymph node protein lysates of RoLoRiG+/+ Mx1CRE+ mice, three months following pIpC injection. The Jurkat T-cell line was used as a positive control for hRASGRP1, TBP as loading control.
(C) Percentages of GFP+ cells in peripheral blood of RoLoRiG+/+ Mx1CRE+ mice on days 21, 62, and 94 after pIpC injection. Data are presented as mean ± SEM. Each symbol represents a single mouse in all figures (n>4 in Figure 2C).
(D, E, F) GFP+ cells within of T-, myeloid-, and B- cells in RoLoRiG+/+Mx1CRE+ mice with or without pIpC injection on days 21, 62 and 94.
(G) Splenic weights from RoLoRiG+/+Mx1CRE- and RoLoRiG+/+Mx1CRE+ mice (n>7). Figures 2G–2J are at 94 days post pIpC injection.
(H) Percentage of T-, myeloid-, and B- cells in spleens of RoLoRiG+/+Mx1CRE- and RoLoRiG+/+Mx1CRE+ mice (n=6 or more). Increased percentages of CD11b+ cells were accompanied with decreases in B220+ B cells and CD3+ T cells.
(I) Percentages of GFP+ cells in spleens of RoLoRiG+/+Mx1CRE+ mice with or without pIpC injection (n=6 or more).
(J) Percentages of GFP+ cells in BM of RoLoRiG+/+Mx1CRE+ mice with or without pIpC injection (n>6).
We induced a cohort of RoLoRiG+/+Mx1CRE+ mice (homozygous for the RoLoRiG allele) with one single dose of pIpC and monitored health and general wellbeing. Overall, induced overexpression of RASGRP1 did not lead to a shortened life span or signs of severe lymphopenia and acute leukemia in a period of 400 days (data not shown). This is in sharp contrast to KrasG12DMx1CRE mice, which develop a profound MPD to which mice succumb roughly one month after pIpC10–13, but similar to NrasG12DMx1CRE mice on a C57Bl/6 background15. It should be mentioned that in the KrasG12DMx1CRE studies mice were on a mixed background and several injections/doses of pIpC were administered to mice as opposed to one dose in our RoLoRiG study. Some RoLoRiG mice developed skin papillomas on their ears and tails, irrespective of pIpC injections and presumably caused by increased local IFN-α/β levels in the skin (Supplemental Figure S1B). Such skin papillomas are also reported in the KrasG12DMx1CRE model10.
Tracking the mononuclear blood cell compartment longitudinally, we observed that GFP+ cells made up increasingly larger proportions as days 21, 62, and 94 evolve in RoLoRiG+/+Mx1CRE+ mice (Figure 2C) as well as in RoLoRiG+/−Mx1CRE+ mice with one RoLoRiG allele (Supplemental Figure S1C). We observed modestly spontaneous increases in GFP+ cells without pIpC injection (Figure 2C), as the Mx1CRE cassette is known to cause a certain level of spontaneous CRE activity in most mouse facilities. Induced KrasG12DMx1CRE mice display severe MPD and increases in total white blood cells10–13. Analysis of T-, B- and myeloid- cells in peripheral blood from RoLoRiG+/+Mx1CRE+ mice revealed that hRASGRP1 overexpression does not lead to overt changes (Supplemental Figures S2A–D). As before, the RoLoRiG+/−Mx1CRE+ mice with only one RoLoRiG allele had a comparable phenotype (Supplemental Figure S2E) and for the remainder of the study we therefore limited assays to RoLoRiG+/+Mx1CRE+ mice and RoLoRiG+/+Mx1CRE-- mice (without a functional CRE).
Notably, measuring the exact fraction of GFP+ cells, we observed that T-, B- and myeloid- cells with hRASGRP1-ires-EGFP expression efficiently outcompeted GFP− cells in a time- and pIpC- dependent manner (Figures 2D–F and Supplemental Figure S2F). When pIpC is not administered, GFP+ cells eventually also outgrow negative cells because of the leakiness of Mx1CRE. At day 94, we observed mild splenomegaly in RoLoRiG+/+Mx1CRE+ mice (Figure 2G) and increased percentages of splenic CD11b+ myeloid cells (Figure 2H). The single, pIpC-driven genetic recombination event in BM cells resulted in a large proportion of GFP+ splenocytes over time (Figure 2I). Collectively, these results demonstrate that expression of RASGRP1-ires-GFP bestows an advantage over GFP− cells and that this effect originates in the BM. Indeed, analysis of the BM from RoLoRiG+/+Mx1CRE+ mice, which received one injection of pIpC showed enrichment for GFP+ cells (Figure 2J).
hRasGRP1 overexpression does not impact homeostatic expansion following transplantation
Hematopoiesis and lineage development in the BM have classically been studied through transplantation of stem cells (LSK cells - Lineage−Sca+c-Kit+ cells) and allow for direct comparisons when done competitively. It should be noted that recipient mice receive irradiation to create space in the BM, resulting in an empty niche with abundantly available cytokines and many consider this an “injury and homeostatic expansion” model36. To assess lineage development by hRASGRP1-overexpressing hematopoietic stem cells in the BM, we introduced RoLoRiG+/+Mx1CRE+ or RoLoRiG+/+Mx1CRE- LSK cells in a competitive manner (Figure 3A) using congenic marking through CD45 alleles (Supplemental Figure S3A). RoLoRiG+/+Mx1CRE- LSK cells were used as control to avoid the leakiness issue of Mx1CRE. CD45.2 RoLoRiG+/+Mx1CRE+ or RoLoRiG+/+Mx1CRE- LSK cells filled the peripheral blood compartment with unexpected, similar efficiency and similar contribution to T-, B- and myeloid- cell lineages (Supplemental Figures S3B–S3D). Reconstitution by LSK cells with pIpC-induced hRASGRP1 overexpression resulted in modest splenomegaly (Figure 3B) and mildly increased percentages of CD11b+ myeloid cells in the spleen (Figure 3C).
Figure 3: hRASGRP1 overexpression in a bone marrow transfer model.

(A) RoLoRiG+/+Mx1CRE- or RoLoRiG+/+Mx1CRE+ mice were injected with pIpC at 4 weeks of age. BM cells were freshly isolated (7–8 weeks) from donor mice (CD45.2), which were either RoLoRiG+/+Mx1CRE- or RoLoRiG+/+Mx1CRE+. Sorted 10 000 LSK cells were co-injected i.v. with 5×10⁵ carrier cells (CD45.1) into lethally irradiated recipients (CD45.1/CD45.2). Recipient mice were bled every 4 weeks until the final analysis at the endpoint (22 weeks). BM: bone marrow; LSK: Lin−Sca1+c-kit+; PB: Peripheral blood; pIpC: polyinosinic-polycytidylic acid. Data are presented as mean ± SEM of n=2 independent experiments. Congenic alleles allow for accurate enumeration of cell populations that are donor-derived (CD45.2) or are radiation-resistant host cells (CD45.1/CD45.2) (Supplemental Figure S3A).
(B) Spleen weight from RoLoRiG+/+Mx1CRE- and RoLoRiG+/+Mx1CRE+ mice at endpoint (n>9). Each dot represents a single mouse. **p<0.01.
(C) Percentage of T-, myeloid and B-cells in spleen of RoLoRiG+/+Mx1CRE- and RoLoRiG+/+Mx1CRE+ mice at endpoint (n>9). **p<0.01.
(D-G) Analyses of percentages of LSK, PreGM, MEP, GMP and CMP within PreGM, and CLP in the BM. (n=9 or more). For additional subsets, see Supplemental Figure S4.
We next focused on the immature lineages in the BM (Figures 3D–G and Supplemental Figures 4A and 4B). In the context of this injury and homeostatic expansion model, RoLoRiG+/+Mx1CRE+ transplanted LSK cells did not have an advantage compared to RoLoRiG+/+Mx1CRE- LSK cells; we observed similar percentages of LSK, LT-HSC, ST-HSC, and MPP cell populations (Figure 3E and Supplemental Figures S4A–S4E). We also observed roughly equal numbers for PreGM, MEP, GMP, and CMP populations (Figures 3FE and 3F). CLP percentages were increased by two-fold in when RoLoRiG+/+Mx1CRE+ LSK cells are transplanted in comparison to RoLoRiG+/+Mx1CRE- LSK (Figure 3G) and B220+ B-cells demonstrate a modest decrease (Supplemental Figure S4F). Thus, hRASGRP1-ires-GFP expressing LSK cells do not outperform wildtype LSK cells when investigated in a radiation/transplantation approach, which was somewhat unexpected given the fact that hRASGRP1-ires-GFP outgrow GFP-negative cell populations in a non-transplantation setting (Figures 2 and 3A). hRASGRP1-ires-GFP expressing LSK cells also contrast KRASG12D and NRASG12D expressing LSK cells, which are reported to display higher repopulating ability into the different cell lineages in the blood when transplanted into lethally irradiated mice13,37.
Bone marrow characteristics under abundant cytokine stimulation
We previously uncovered that overexpression of RASGRP1 synergizes with cytokine receptor signals to aberrantly induce downstream RAS- and effector kinase- signals in T-ALL cell line models3,4,21,38, but these RASGRP1 signals have never been investigated in primary BM cells. Searching for mechanistic insights into the consequences of RoLoRiG in hematopoietic cells, we employed colony formation assays to determine the clonogenic capacity of hematopoietic progenitors as well as signaling assays (Figure 4A).
Figure 4: Cytokine-induced bone marrow colony formation and signaling.

(A) 50 000 total BM cells from either RoLoRiG+/+Mx1CRE- or RoLoRiG+/+Mx1CRE+ mice were seeded in cytokine-rich (M3434) medium. Representative images of the different colonies are shown after 7 days of incubation (100 μm Scale bar). Original magnification 10X. CFU: clonogenic forming units. For cytokine-induced signaling assays, cells were sorted, rested, stimulated, and processed for phosphor-antibody staining.
(B-C) CFU potential of RoLoRiG+/+Mx1CRE- and RoLoRiG+/+Mx1CRE+ cells grown in cytokine-rich medium (n>15). (B) Clonogenic (CFU) potential of RoLoRiG+/+Mx1CRE- and RoLoRiG+/+Mx1CRE+ cells grown in cytokine-rich medium (n>15). (C) As in Figure 4B but in the presence of inhibitors of Ras kinase effector pathways: GDC0941 (0.1μM), U0126 (5μM) and Rapamycin (0.1μM) (n>3).
(D) Analysis of p-STAT3 (Y705) and p-STAT5 (Y694) levels in rested and GM-CSF (40ng/ml) stimulated, sorted CD11B+ cells from RoLoRiG+/+Mx1CRE- and RoLoRiG+/+Mx1CRE+ mice. N = 4 independent experiments. ***p<0.001. Unstimulated RoLoRiG+/+Mx1CRE- samples were arbitrarily set at 100. For isotype control antibody staining see Supplemental Figure S5.
(E) As in Figure 4D, assessment of p-AKT (S473), p-ERK (T202/Y204), and p-S6 (S235/S236) levels. N = 4 independent experiments. ***p<0.001, *p<0.05.
We explored clonogenic capacity of RoLoRiG+/+Mx1CRE+ or RoLoRiG+/+Mx1CRE- BM cells with in vitro CFU (colony forming unit) assays in cytokine-supplemented M3434 CFU assay medium through differential quantification of the colonies based on morphological characteristics39. In cytokine-rich M3434 medium, overexpression of hRASGRP1-ires-EGFP resulted in modestly higher clonogenic capacity of total CFU and GM-CFU (Figure 4B). hRASGRP1-ires-EGFP did not impact the efficiency for E- and GEMM-CFU in M3434 medium (Figure 4B). RASGTP (active RAS) can signal to (PI3K)-AKT, AKT-mTOR (mammalian target of Rapamycin), and RAF-MEK-ERK resulting in stimulation of survival-, metabolic-, and cell cycle- changes40,41. Inclusion of pan-PI3K inhibitor GDC0941, MEK inhibitor U0126, and mTOR inhibitor Rapamycin revealed that the GM-CFU colony-forming capacity in cytokine-rich M3434 medium was only sensitive to addition of Rapamycin (Figure 4C). The effects of mTOR inhibition on colony formation in M3434 were both measurable in RoLoRiG+/+Mx1CRE+ or RoLoRiG+/+Mx1CRE- BM cells (Figure 4C).
To investigate cytokine-mediated signaling in BM cells, we focused on myeloid cells given our GM-CFU results. Sorted CD11b+ RoLoRiG+/+Mx1CRE- or RoLoRiG+/+Mx1CRE+ cells were rested and subsequently stimulated with GM-CSF (Figure 4A). GM-CSF stimulation resulted in the expected phosphorylation of STAT3 and STAT5 in either RoLoRiG+/+Mx1CRE- or RoLoRiG+/+Mx1CRE+ cells, indicative of efficient GM-CSF-JAK-STAT signaling (Figure 4D and Supplemental Figure S5). Downstream of RAS, GM-CSF-triggered modest induction of pAKT, but much more robustly induced pERK- and pS6- levels (Figure 4E and Supplemental Figure S5). In T-ALL cell lines, cytokines robustly trigger ERK and AKT pathways that are significantly reduced when RASGRP1-expression levels are decreased3,38. Surprisingly, hRASGRP1 expression did not impact the magnitude of the induction of these effector kinase pathways in sorted CD11b+ cells stimulated with GM-CSF. In fact, the only noticeable difference was the modestly increased p-S6 signal when comparing unstimulated Mx1CRE- to Mx1CRE+ RoLoRiG+/+ CD11b+ cells (Figure 4E).
hRasGRP1 overexpression triggers spontaneous colony formation and baseline S6 signaling
Cytokines are produced and released by stromal cells residing in the BM niche and act on hematopoietic progenitors29, but stem cell niches are generally competitive environments42. To mimic a physiological in vivo situation of competition for limited amounts of available cytokines in the BM niche, we exploited cytokine-bare medium M323111. M3231 was supplemented with low concentrations of either GM-CSF (0.01ng/ml) or of lymphoid-trophic IL-7 (0.1–10 ng/ml) (Figure 5A). As expected, control RoLoRiG+/+Mx1CRE- BM cells resulted in almost no colony formation under these conditions (Figure 5B and 5C). By contrast, RoLoRiG+/+Mx1CRE+ cells yielded substantial colony formation, both for GM-CSF and for IL-7 (Figure 5B and 5C). GDC0941, Rapamycin, and U0126 inhibitors all impacted the numbers of colonies by GM-CSF in M3231 (Figure 5B), implicating that PI3K-, mTOR-, and MEK- effector kinase signals all contribute to sustain colony formation and outgrowth in limiting growth factor conditions.
Figure 5: RasGRP1 overexpression drives spontaneous bone marrow colony formation and S6 signaling.

(A) BM CFU analysis in cytokine-poor (M3231) medium. supplemented with either GM-CSF (GM-CFU) or IL-7 (PreB-CFU). Representative images following 7 days of incubation (100 μm Scale bar). Original magnification 10X. Schematic of baseline signaling assays in whole BM.
(B) Clonogenic (CFU) potential of RoLoRiG+/+Mx1CRE- and RoLoRiG+/+Mx1CRE+ cells grown in M3231 with 0.01 ng/ml of GM-CSF and inhibitors: GDC0941 (0.1μM), U0126 (5μM) and Rapamycin (0.1μM) (n>4).
(C) Clonogenic (PreB-CFU) potential of RoLoRiG+/+Mx1CRE- and RoLoRiG+/+Mx1CRE+ cells using 0.1, 1 and 10 ng/ml of IL-7 (n>3).
(D) Analysis of baseline p-STAT3 (Y705), p-STAT5 (Y694), p-AKT (S473), p-ERK (T202/Y204), and p-S6 (S235/S236) signals in RoLoRiG+/+Mx1CRE- and RoLoRiG+/+Mx1CRE+ total BM, immediately fixed after isolation. Mean fluorescence intensity is depicted by the numerical value. Data is representative of four independent experiments.
For the analysis of tonic signaling43 one isolates cells as quickly as possible followed by immediate fixation and analysis of cells ex vivo (Figure 5A). Analysis of tonic signals in freshly harvested total BM revealed that baseline pSTAT3- and pSTAT5- signals can be detected when the staining of cells with phospho-specific antibodies is compared to staining with isotype control antibodies (Figure 5D). These baseline pSTAT3- and pSTAT5- signals likely reflect the cytokine- and chemokine- signals received by BM cells immediately prior to harvesting from their niche and immediate fixation. Measurements of baseline pAKT-, pERK-, and pS6- levels that lie downstream of RAS revealed that activities through AKT- and S6- pathways in hematopoietic cells were more prevalent on a whole than the ones through the ERK pathway (Figure 5E). Moreover, when comparing RoLoRiG+/+ Mx1CRE+ BM to RoLoRiG+/+Mx1CRE- BM, we observed increased baseline S6 signals when hRASGRP1 is overexpressed (Figure 5E).
hRASGRP1 overexpression results in increased fitness of stem cells in the native BM
In general, a classic hematopoietic developmental scheme is believed to follow a hierarchical order, as depicted in Figure 344,45. However, important nuances have been uncovered when native hematopoiesis is compared to the hematopoiesis that occurs following irradiation and transplantation36,46. Focusing on native hematopoiesis, RoLoRiG+/+Mx1CRE+ mice receiving one dose of pIpC revealed significantly increased percentages in LSK cells (Figure 6A) with increased LT-HSC but comparable ST-HSC (Figure 6B). In addition, higher percentages of MPP (Figures 6C) and CLP (Figures 6D) were detected in RoLoRiG+/+Mx1CRE+ mice. Increases in PreGM cells (Figure 6E) stemmed from higher percentages of MEP and GMP in RoLoRiG+/+Mx1CRE+ mice with normal CMP (Figure 6F).
Figure 6: Increased fitness in Native hematopoiesis in RoLoRiG+/+ mice.

(A) Percentage of LSK in the BM of RoLoRiG+/+Mx1CRE- or RoLoRiG+/+Mx1CRE+ mice (n>18). In panel 6A and all subsequent panels in figure 6, data are presented as mean ± SEM. Each symbol represents a single mouse. *p<0.05, **p<0.01, ***p<0.001.
(B-F) Percentage of specific developmental stages in the BM RoLoRiG+/+Mx1CRE- or RoLoRiG+/+Mx1CRE+ mice, analogous to the developmental gating scheme used in Figure 3.
(G) Inclusion of the ires-EGFP cassette allows for specific assessment of the GFP+ fraction within each of the hematopoietic subsets within the BM.
(H-K) Proportions of GFP+ cells within in RoLoRiG+/+Mx1CRE+ mice with or without pIpC injection. (H. LSK; I. MPP, ST-HSC and LT-HSC cells; J. CLP cells; K. MEP, GMP and CMP cells.
The inclusion of the ires-EGFP cassette allowed for quantitative assessment of the fraction of GFP+ cells in each of the BM stem- and progenitor- populations, examined 94 days after one single dose of pIpC (Figure 6G). These analyses revealed a striking pattern: in RoLoRiG+/+Mx1CRE+ mice all populations revealed percentages of GFP+ cells that approached 100 percent (Figures 6H–6K). By contrast, in KrasG12DMx1CRE mice, BM FLK2−LSK cell numbers are reduced by 2-fold following 2 weeks of pIpC injection, while numbers of these cells increase in spleen13. Thus, the one-time induced GFP+ fraction takes over the BM in a sustained manner, demonstrating that RASGRP1 overexpression provides increased fitness to the stem cell populations.
DISCUSSION
High levels of RASGRP1 expression are seen in many T-ALL patients and the RoLoRiG model allowed for the analysis of signaling- and functional- traits as a result of hRASGRP1 overexpression in primary hematopoietic cells for the first time. We established that hRASGRP1 overexpression bestows increased fitness onto stem- and progenitor- cells without causing acute leukemia, a phenotype that is very distinct from oncogenic KRASG12D expression driven by Mx1CRE and more similar to NRASG12D expression in the BM.
The fact that hRASGRP1-ires-EGFP or NRASG12D expression14,15,33,37 in the BM alone do not lead to acute leukemia, the notion that NRAS mutations are more frequent than KRAS mutations in leukemia6–8, and our reports that overexpression of RASGRP1 is often observed in T-ALL patients3, suggests that additional hits play a role. This “two-hit” theory was already described almost 50 years ago by Knudson et al.47, many research groups have based their work on this theory48–51, and Molony leukemia virus insertions in genes such as Evi1 in the NRASG12D mouse result in acute leukemia15. To explore “two-hit” for RASGRP1 overexpression we plotted co-occurrence for the top 8 SL3–3 leukemia virus insertion sites in our previously reported mouse leukemia screen3. Such analyses can predict redundancy and cooperation in oncogenesis. For example, the Pvt1 locus was demonstrated to encode microRNAs that control MYC expression and co-insertions for Pvt1 and MYC are not found in these SL3–3 driven leukemias52 (Figure 7). SL3–3 insertions in RasGRP1 frequently co-occur with insertions in Evi5, Notch1, Ahi1, GFi1, Myc, RRas2, and particularly Pvt1 (Figure 7) and future work is required to understand the mechanisms here. For example, does the increased fitness from RASGRP1 expression allow for acquisition of additional mutations without decreasing viability of the (pre) leukemic cell or does RASGRP1 have bimodal functions such as the ones described for NRASG12D with stem cell renewing- and proliferation enhancing- properties in distinct cell subsets37?
Figure 7: Co-insertion table of SL3-3 leukemia virus insertions.

SL3–3 leukemia virus insertions that resulted in T-ALL in mice were mapped against each other to understand the relationship between the top 8 SL3–3 insertion sites.
Prominent features in our RoLoRiG model are the increased stem cell fitness in native hematopoiesis, the increased (mTOR) S6 signals at baseline, and the enhanced spontaneous colony formation. mTOR is an interesting node in hematopoiesis and leukemia that deserves more research. TSC (Tuberous sclerosis) genes are negative regulators of mTOR signaling and downregulation of TSC2 gene expression has been reported in BM samples of acute leukemia patients53. Raptor is a critical component of the mTORC1 complex31 and Raptor deletion results in compromised ex vivo colony formation with small irregular colonies54, corroborating our results with the mTOR inhibitor Rapamycin. Deletion of Raptor by a Mx1CRE driver does not lead to altered BM progenitor cell frequencies54. However, in the context of T-ALL with PTEN deletion, Raptor deletion reduces T-ALL, arguing that mTORC1 is a critical effector in leukemia with PTEN loss54,55. Loss of Rictor, component of mTORC2, has little effect on normal HSC function, but similarly to Raptor deletion, deletion of Rictor normalizes the HSC proliferation in PTEN null mice and also prevented the T-ALL55,56. Baseline signaling has remained a relatively understudied area of signal transduction and we believe it will be of interest to carefully characterize baseline signals in the context of native hematopoiesis36,46 and leukemia.
MATERIALS AND METHODS
Plasmid cloning and generation of mice with hRasGRP1 over-expression
The expression construct was generated by cloning the various components into targeting ROSA vector (ROSA-HR). Vector was obtained by introducing first a flanked Neo/STOP cassette and then the hRasGRP1 cDNA cassette, IRES-EGFP, and human polA sequences into a Rosa26 targeting vector that already contain a ubiquitous CAG promoter cassette (Figure. 1A). This construct was transfected into ES cells by electroporation in optimized condition (5×10⁶ cells in presence of 40 μg linearized plasmid, 260V, 500 uF). Positive selection started 48 h after electroporation by adding 200 μg/ml of G418 in 96-well plates. Positive clones were further screened by southern blotting. Furthermore, the hybridization with internal probe did not indicate that any of the ES cells screened contained an additional randomly integrated copy of the targeting plasmid. At the age of 4 weeks mice received a single intraperitoneal injection of polyinosinic-polycytidylic acid (pIpC) (1μg/250μl/mouse) (Sigma, San Luis, MO, US) to induce the expression of hRASGRP1 and GFP from the Rosa26 locus.
Genotyping
Western blotting
To analyze hRASGRP1 overexpression under basal conditions by western blot, cells of interest were washed with phosphate-buffered saline (PBS) and lysates were prepared by adding NP40 lysis buffer supplemented with protease and phosphatase inhibitors [10 mM sodium fluoride, 2 mM sodium orthovanadate, 0.5 mM EDTA, 2 mM phenylmethylsulfonyl fluoride, 1 mM sodium molybdate, aprotonin (10 mg/ml), leupeptin (10 mg/ml), pepstatin (1 mg/ml)]. Lysates were incubated for 20 min at 4°C, centrifuged at 13 000rpm and debris-free lysates were transferred to new collection tubes. Western blotting analysis was performed with antibodies specific for hRASGRP1 (H120, Santa Cruz Biotechnology, Dallas, TX, US) and TBP (#8515, Cell Signaling, Danvers, MA, US). Western blots were visualized and quantified with enhanced chemiluminescence and imaging on a Fuji LAS 4 000 image station (GE Healthcare, Chicago, IL, US)3.
Single cell suspension generation from tissues
Mice were euthanized 3 to 6 months after pIpC injection. Tibia and femurs of mice were collected and cleaned from flesh. Bones were then crushed using mortar and pestle in Hank’s Balanced Salt Solution (HBSS; UCSF cell culture facility) containing 2% of FBS. Cells were filtered through a 70 μm strainer. Spleen and thymus were harvested from the mice and mashed through a 70 μm cell strainer. Red blood cell lysis was performed for all tissues with ACK buffer (150 mM NH4Cl, 10 mM KHCO3, 0.1 mM Na2EDTA at pH 7.2–7.4). Bone marrow (BM) cells were washed once with HBSS, then loaded onto a Histopaque-1119 (Sigma, San Luis, MO, US) density gradient and centrifuged at 1500 rpm with no break for 5 min to separate bone debris from cells. Splenocytes and thymocytes were washed once with HBSS/2% FBS. All cells were then counted and prepared for experimental setup.
LSK cell transplantation
BM cells from RoLoRiG+/+Mx1CRE- or RoLoRiG+/+Mx1CRE+ mice were isolated as described earlier. Cells were blocked with Rat IgG and stained for lineage markers (CD3, CD4, CD5, CD8, CD11b, B220, Ter119), c-Kit and Sca-1 under sterile conditions. LSK cells were then sorted using FACS Aria by gating on GFP+Lin−cKit+Sca1+ population in RoLoRiG+/+Mx1CRE+ samples or on all cells in RoLoRiG+/+Mx1CRE- samples. CD45.1+/CD45.2+ mice were lethally irradiated (9.5Gy) and injected in the lateral tail vein57 with 10×103 LSK from either RoLoRiG+/+Mx1CRE- or RoLoRiG+/+Mx1CRE+ (CD45.2+) mice. Each LSK sample was mixed together with 5×10⁵ unfractionated adult BM cells (CD45.1+). Donor chimerism in peripheral blood (PB) was assessed by flow cytometry at 4, 6, 10, 14, and 18 weeks post transplantation. For hematopoietic tissue analysis, mice were euthanized at 18 and 22 weeks after cell transplantation.
Hematopoietic and donor chimerism analysis
PB was collected from mice tail vain into a tube containing PBS with FACS buffer (2mM EDTA, 2% FBS and 0.09% NaN3). Blood cells were lysed using ACK buffer. Cells were centrifuged for 5 minutes at 500 g, supernatant was discarded, and cells were suspended in FACS buffer for flow cytometry staining. The following antibodies were used: α-CD3-APC, α-CD11b-VioletFluor450, α-B220-PerCP-Cy5.5, α-CD45.1-PE-Cy7, α-CD45.2-PE to analyze T-, B- and myeloid cells and the chimerism after LSK transplantation.
BM cells were blocked with Rat IgG for 30 minutes at 4°C. Cells were stained with lineage markers (CD3, CD4, CD5, CD8, CD11b, B220, Ter119); c-kit and Sca-1 for LSK and PreGM populations; CD150 and CD48 for MPP, ST-HSC and LT-HSC; CD16/CD32 and CD34 for CMP, GMP, MEP populations; Flk2 and IL7Rμ for CLP population as previously described (Fig 3A)58,59. Samples were acquired on a BD LSRII Fortessa (BD, Franklin Lakes, NJ, US). FlowJo software was used to analyze the data. Antibodies information is on Table 1.
Table 1:
Primary and secondary antibodies used in this study
| Antibody | Supplier | Reference | Dilution |
|---|---|---|---|
| B220-PE-Cy7 | Tonbo Bioscience | 60-0452-U100 | 1:200 |
| B220-PerCP-Cy5.5 | Tonbo Bioscience | 65-0452-U100 | 1:100 |
| c-Kit-PerCP-Cy5.5 | BioLegend | 105823-BL | 1:200 |
| CD3-APC | Tonbo Bioscience | 20-0032-U100 | 1:200 |
| CD3-PE-Cy7 | BD Bioscience | 560591 | 1:100 |
| CD4-PE-Cy7 | eBioscience | 25-0042-82 | 1:200 |
| CD4-PerCP-Cy5.5 | Tonbo Bioscience | 65-0042-U100 | 1:500 |
| CD4-VioletFluor450 | Tonbo Bioscience | 75-0042-U100 | 1:200 |
| CD5-PE-Cy7 | eBioscience | 501128881 | 1:100 |
| CD8-APC | Tonbo Bioscience | 60-0081-U100 | 1:200 |
| CD8-PE-Cy7 | Tonbo Bioscience | 60-0081-U100 | 1:100 |
| CD11b-PE-Cy7 | Tonbo Bioscience | 60-0112-U025 | 1:1000 |
| CD11b-VioletFlour 450 | Tonbo Bioscience | 75-0112-U100 | 1:200 |
| CD16/CD32-eFluor450 | eBioscience | 48-0161-80 | 1:50 |
| CD25-APC | Tonbo Bioscience | 20-0251-U025 | 1:400 |
| CD34-biotin | BioLegend | 119304-BL | 1:50 |
| CD44-PE | BD Bioscience | 553134 | 1:2000 |
| CD45.1-PE-Cy7 | BD Bioscience | 560578 | 1:200 |
| CD45.2-PE | Tonbo Bioscience | 50-0454-U100 | 1:200 |
| CD48-Pacific Blue | BioLegend | 103418-BL | 1:200 |
| CD150-PE | BioLegend | 115904-BL | 1:100 |
| Flk2-PE | eBioscience | 12-1351-82 | 1:50 |
| IL7Rα-biotin | Tonbo Bioscience | 50-1271-U100 | 1:100 |
| Sca-1-APC | BioLegend | 122512 | 1:500 |
| Sca-1-Pacific Blue | BioLegend | 122519 | 1:400 |
| Streptavidin-APC | Invitrogen | SA1005 | 1:400 |
| Streptavidin-PE | Invitrogen | S866 | 1:400 |
| Ter119-PE-Cy7 | BioLegend | 116221-BL | 1:200 |
| anti-Human RASGRP1 | Santa Cruz | H-120 | 1:1000 |
| anti-TBP | Cell Signaling | #8515 | 1:1000 |
| HRP Goat anti-Rabbit | Southern Biotech | 4050-05 | 1:10000 |
| pERK (T202/Y204) | Cell Signaling | 4377S | 1:200 |
| pAKT (S473) | Cell Signaling | 4058L | 1:100 |
| pGSK3β(S9) | Cell Signaling | 5558S | 1:200 |
| pS6 Ribosomal (S235/S236) | Cell Signaling | 2211L | 1:500 |
| pSTAT3-PE (Y705) | BD Biosciences | 612569 | 1:10 |
| pSTAT5-PE (Y694) | BD Biosciences | 612567 | 1:10 |
| mIgG2a-PE (MOPC-173) | BD Biosciences | 558595 | 1:10 |
| mIgG1k-PE (MOPC-21) | BD Biosciences | 551436 | 1:10 |
Clonogenic forming unit assay
Primary mouse clonogenic progenitor assays or colony forming units (CFU) assays were performed by plating 5×10⁵ unfractionated nucleated BM cells in methylcellulose M3434 (StemCell Technologies, Vancouver, Canada) in 1 ml duplicates. Colonies were counted and scored after 7 days of incubation using standard morphological criteria39. To assay granulocyte/macrophage (GM-CFU), unfractionated nucleated BM cells (5×10⁵) were suspended in methylcellulose medium (M3231, StemCell Technologies) with 0.01 ng/ml murine GM-CSF (Peprotech, Rocky Hill, NJ, US) and plated in 1 ml duplicates. Colonies were counted after 7 days. To assay PreB-cell colonies (PreB-CFU), unfractionated nucleated BM cells (5×10⁵) were suspended in methylcellulose medium (M3231, StemCell Technologies) with 0.1, 1 and 10ng/ml murine IL-7 (Peprotech) and plated in 1-ml duplicates. Colonies were counted after 7 days. Representative images were taken with a Keyence BZ-X710 microscope (Keyence, Itasca, IL, US). Images were viewed with the Keyence BZ-X viewer and BZ-X analyzer. Image brightness and contrast were edited using Affinity Designer. To assess the effect of known chemical inhibitors on CFUs from either RoLoRiG+/+Mx1CRE- or RoLoRiG+/+Mx1CRE+ mice, cells were plated in the absence or presence of U0126 MEK inhibitor (5μM), PI3K inhibitor GDC-0941 (0.1μM) or mTOR inhibitor rapamycin (0.1μM).
Statistics, reagents and animal models
Results are shown as mean ± SEM and the normality of data was checked using the D’Agostino-Pearson test. For variables with a normal distribution, Student’s t test and one-way ANOVA were used to compare the significance of differences between experimental groups. For variables with no normal distribution, Mann–Whitney U test or Kruskal–Wallis test was applied. Statistical analysis was performed using GraphPad Prism version 6.00. A p-value<0.05 was considered significant and indicated with an asterisk.
For in vivo experiments we used a minimum of 4 mice per group. For in vitro, a minimum of 3 independent repetitions were carried out. Specific sample size is indicated in figure legends. No randomization or blinding was carried out since it was not applicable to our study. Variation between samples was assumed to be similar.
To minimize variation in our studies, a single clone was isolated by JPR through limiting dilution of Jurkat E6–1 T cells in 1999 in Art Weiss’ lab and were designated Jurkat E6–1-clone1. Cells were expanded and 150 cryovials of the cells were cryopreserved60. Antibodies source is detailed in Table 1.
In animal models, both female and male mice were used in all our studies and included BoyJ, C57BL6 RoLoRiG+/+Mx1CRE− or RoLoRiG+/+Mx1CRE+ and F1 of C57BL6 and BoyJ breeding. The age of mice was indicated in each experimental setting (specified in figure legends). In transplantation experiments, BoyJ mice were used as carrier BM at 7–8 weeks old (CD45.1), and F1 mice from BoyJ and C57BL6 breeding were used as recipient mice at 7–8 weeks old (CD45.1/CD45.2). RoLoRiG+/+Mx1CRE− or RoLoRiG+/+Mx1CRE+ mice were used as donor BM at 7–8 weeks old (CD45.2). For all other experiments RoLoRiG+/+Mx1CRE− or RoLoRiG+/+Mx1CRE+ mice only were used.
All mice were bred and maintained under specific pathogen-free conditions at the laboratory animal resource center of UCSF. All mice were housed and treated in accordance with the guidelines at the Institutional Animal Care and Use Committee guidelines of the UCSF, protocol AN180563–02
Supplementary Material
ACKNOWLEDGEMENTS
This work was supported by an Alex’ Lemonade Stand Foundation Innovator Award, the NIH/NCI (R01 - CA187318), and the NIH/NHLBI (R01 - HL120724) (all to JPR). Further support came from a Leukemia & Lymphoma Society grant (to MM) and the Rothschild Fellowship for postdoctoral fellows in the Natural, Exact or Life Sciences and Engineering (to LK), and PD is a Mark Foundation Momentum Fellow supported by a fellowship from the Mark Foundation for Cancer Research; and by NCI grants CA021765 (St Jude Comprehensive Cancer Center Support Grant), an NCI R35 Outstanding Investigator Award (R35 CA197695) and a St. Baldrick’s Foundation Robert J. Arceci Innovation award. We thank the members of the Roose lab and the Heme-Onc community at UCSF for useful suggestions and comments. We thank UCSF flow cytometry facility and DRC Center Grant NIH P30 DK063720. We thank Emmanuelle Passague and her lab for kindly providing us Mx1-CRE mice.
Footnotes
Conflict of interest disclosure
Jeroen Roose is a co-founder and scientific advisor of Seal Biosciences, Inc. and on the scientific advisory committee for the Mark Foundation for Cancer Research. C.G.M. receives research funding from Loxo Oncology, Abbvie, and Pfizer, and speaking fees from Amgen.
Supplementary information is available at Oncogene’s website.
REFERENCES
- 1.Terwilliger T & Abdul-Hay M Acute lymphoblastic leukemia: a comprehensive review and 2017 update. Blood Cancer J 7, e577, doi: 10.1038/bcj.2017.53 (2017). [DOI] [PMC free article] [PubMed] [Google Scholar]
- 2.von Lintig FC, Huvar I, Law P, Diccianni MB, Yu AL & Boss GR Ras activation in normal white blood cells and childhood acute lymphoblastic leukemia. Clin Cancer Res 6, 1804–1810 (2000). [PubMed] [Google Scholar]
- 3.Hartzell C, Ksionda O, Lemmens E, Coakley K, Yang M, Dail M et al. Dysregulated RasGRP1 Responds to Cytokine Receptor Input in T Cell Leukemogenesis. Science signaling 6, ra21, doi: 10.1126/scisignal.2003848 (2013). [DOI] [PMC free article] [PubMed] [Google Scholar]
- 4.Ksionda O, Melton AA, Bache J, Tenhagen M, Bakker J, Harvey R et al. RasGRP1 overexpression in T-ALL increases basal nucleotide exchange on Ras rendering the Ras/PI3K/Akt pathway responsive to protumorigenic cytokines. Oncogene 35, 3658–3668, doi: 10.1038/onc.2015.431 (2016). [DOI] [PMC free article] [PubMed] [Google Scholar]
- 5.Jackson EL, Willis N, Mercer K, Bronson RT, Crowley D, Montoya R et al. Analysis of lung tumor initiation and progression using conditional expression of oncogenic K-ras. Genes Dev 15, 3243–3248, doi: 10.1101/gad.943001 (2001). [DOI] [PMC free article] [PubMed] [Google Scholar]
- 6.Schubbert S, Shannon K & Bollag G Hyperactive Ras in developmental disorders and cancer. Nat Rev Cancer 7, 295–308, doi:nrc2109 [pii] 10.1038/nrc2109 (2007). [DOI] [PubMed] [Google Scholar]
- 7.Bowen DT, Frew ME, Hills R, Gale RE, Wheatley K, Groves MJ et al. RAS mutation in acute myeloid leukemia is associated with distinct cytogenetic subgroups but does not influence outcome in patients younger than 60 years. Blood 106, 2113–2119, doi: 10.1182/blood-2005-03-0867 (2005). [DOI] [PubMed] [Google Scholar]
- 8.Liu Y, Easton J, Shao Y, Maciaszek J, Wang Z, Wilkinson MR et al. The genomic landscape of pediatric and young adult T-lineage acute lymphoblastic leukemia. Nat Genet 49, 1211–1218, doi: 10.1038/ng.3909 (2017). [DOI] [PMC free article] [PubMed] [Google Scholar]
- 9.Kuhn R, Schwenk F, Aguet M & Rajewsky K Inducible gene targeting in mice. Science 269, 1427–1429 (1995). [DOI] [PubMed] [Google Scholar]
- 10.Chan IT, Kutok JL, Williams IR, Cohen S, Kelly L, Shigematsu H et al. Conditional expression of oncogenic K-ras from its endogenous promoter induces a myeloproliferative disease. J Clin Invest 113, 528–538, doi: 10.1172/JCI20476 (2004). [DOI] [PMC free article] [PubMed] [Google Scholar]
- 11.Braun BS, Tuveson DA, Kong N, Le DT, Kogan SC, Rozmus J et al. Somatic activation of oncogenic Kras in hematopoietic cells initiates a rapidly fatal myeloproliferative disorder. Proc Natl Acad Sci U S A 101, 597–602 (2004). [DOI] [PMC free article] [PubMed] [Google Scholar]
- 12.Kindler T, Cornejo MG, Scholl C, Liu J, Leeman DS, Haydu JE et al. K-RasG12D-induced T-cell lymphoblastic lymphoma/leukemias harbor Notch1 mutations and are sensitive to gamma-secretase inhibitors. Blood 112, 3373–3382 (2008). [DOI] [PMC free article] [PubMed] [Google Scholar]
- 13.Sabnis AJ, Cheung LS, Dail M, Kang HC, Santaguida M, Hermiston ML et al. Oncogenic Kras initiates leukemia in hematopoietic stem cells. PLoS Biol 7, e59 (2009). [DOI] [PMC free article] [PubMed] [Google Scholar]
- 14.Wang J, Liu Y, Li Z, Du J, Ryu MJ, Taylor PR et al. Endogenous oncogenic Nras mutation promotes aberrant GM-CSF signaling in granulocytic/monocytic precursors in a murine model of chronic myelomonocytic leukemia. Blood 116, 5991–6002, doi: 10.1182/blood-2010-04-281527 (2010). [DOI] [PMC free article] [PubMed] [Google Scholar]
- 15.Li Q, Haigis KM, McDaniel A, Harding-Theobald E, Kogan SC, Akagi K et al. Hematopoiesis and leukemogenesis in mice expressing oncogenic NrasG12D from the endogenous locus. Blood 117, 2022–2032, doi: 10.1182/blood-2010-04-280750 (2011). [DOI] [PMC free article] [PubMed] [Google Scholar]
- 16.Oki-Idouchi CE & Lorenzo PS Transgenic overexpression of RasGRP1 in mouse epidermis results in spontaneous tumors of the skin. Cancer Res 67, 276–280 (2007). [DOI] [PMC free article] [PubMed] [Google Scholar]
- 17.Klinger MB, Guilbault B, Goulding RE & Kay RJ Deregulated expression of RasGRP1 initiates thymic lymphomagenesis independently of T-cell receptors. Oncogene 24, 2695–2704 (2005). [DOI] [PubMed] [Google Scholar]
- 18.Oki T, Kitaura J, Watanabe-Okochi N, Nishimura K, Maehara A, Uchida T et al. Aberrant expression of RasGRP1 cooperates with gain-of-function NOTCH1 mutations in T-cell leukemogenesis. Leukemia 26, 1038–1045, doi: 10.1038/leu.2011.328 (2012). [DOI] [PubMed] [Google Scholar]
- 19.Norment AM, Bogatzki LY, Klinger M, Ojala EW, Bevan MJ & Kay RJ Transgenic expression of RasGRP1 induces the maturation of double-negative thymocytes and enhances the production of CD8 single-positive thymocytes. J Immunol 170, 1141–1149 (2003). [DOI] [PubMed] [Google Scholar]
- 20.Jun JE, Rubio I & Roose JP Regulation of Ras Exchange Factors and Cellular Localization of Ras Activation by Lipid Messengers in T Cells. Frontiers in immunology 4, 239, doi: 10.3389/fimmu.2013.00239 (2013). [DOI] [PMC free article] [PubMed] [Google Scholar]
- 21.Ksionda O, Limnander A & Roose JP RasGRP Ras guanine nucleotide exchange factors in cancer. Front Biol (Beijing) 8, 508–532, doi: 10.1007/s11515-013-1276-9 (2013). [DOI] [PMC free article] [PubMed] [Google Scholar]
- 22.Winter SS, Dunsmore KP, Devidas M, Wood BL, Esiashvili N, Chen Z et al. Improved Survival for Children and Young Adults With T-Lineage Acute Lymphoblastic Leukemia: Results From the Children’s Oncology Group AALL0434 Methotrexate Randomization. J Clin Oncol 36, 2926–2934, doi: 10.1200/JCO.2018.77.7250 (2018). [DOI] [PMC free article] [PubMed] [Google Scholar]
- 23.Ksionda O, Melton AA, Bache J, Tenhagen M, Bakker J, Harvey R et al. RasGRP1 overexpression in T-ALL increases basal nucleotide exchange on Ras rendering the Ras/PI3K/Akt pathway responsive to protumorigenic cytokines. Oncogene, doi: 10.1038/onc.2015.431 (2015). [DOI] [PMC free article] [PubMed] [Google Scholar]
- 24.Anders S, Pyl PT & Huber W HTSeq--a Python framework to work with high-throughput sequencing data. Bioinformatics (Oxford, England) 31, 166–169, doi: 10.1093/bioinformatics/btu638 (2015). [DOI] [PMC free article] [PubMed] [Google Scholar]
- 25.Love MI, Huber W & Anders S Moderated estimation of fold change and dispersion for RNA-seq data with DESeq2. Genome Biol 15, 550, doi: 10.1186/s13059-014-0550-8 (2014). [DOI] [PMC free article] [PubMed] [Google Scholar]
- 26.Kortum RL, Sommers CL, Pinski JM, Alexander CP, Merrill RK, Li W et al. Deconstructing Ras signaling in the thymus. Mol Cell Biol 32, 2748–2759, doi: 10.1128/MCB.00317-12 (2012). [DOI] [PMC free article] [PubMed] [Google Scholar]
- 27.Priatel JJ, Teh SJ, Dower NA, Stone JC & Teh HS RasGRP1 transduces low-grade TCR signals which are critical for T cell development, homeostasis, and differentiation. Immunity 17, 617–627 (2002). [DOI] [PubMed] [Google Scholar]
- 28.Morrison SJ & Scadden DT The bone marrow niche for haematopoietic stem cells. Nature 505, 327–334, doi: 10.1038/nature12984 (2014). [DOI] [PMC free article] [PubMed] [Google Scholar]
- 29.Zhang CC & Lodish HF Cytokines regulating hematopoietic stem cell function. Curr Opin Hematol 15, 307–311, doi: 10.1097/MOH.0b013e3283007db5 (2008). [DOI] [PMC free article] [PubMed] [Google Scholar]
- 30.Vigil D, Cherfils J, Rossman KL & Der CJ Ras superfamily GEFs and GAPs: validated and tractable targets for cancer therapy? Nat Rev Cancer 10, 842–857, doi:nrc2960 [pii] 10.1038/nrc2960 (2010). [DOI] [PMC free article] [PubMed] [Google Scholar]
- 31.Myers DR, Wheeler B & Roose JP mTOR and other effector kinase signals that impact T cell function and activity. Immunol Rev 291, 134–153, doi: 10.1111/imr.12796 (2019). [DOI] [PMC free article] [PubMed] [Google Scholar]
- 32.Mues M & Roose JP Distinct oncogenic Ras signals characterized by profound differences in flux through the RasGDP/RasGTP cycle. Small GTPases 8, 20–25, doi: 10.1080/21541248.2016.1187323 (2017). [DOI] [PMC free article] [PubMed] [Google Scholar]
- 33.Wang J, Kong G, Liu Y, Du J, Chang YI, Tey SR et al. Nras(G12D/+) promotes leukemogenesis by aberrantly regulating hematopoietic stem cell functions. Blood 121, 5203–5207, doi: 10.1182/blood-2012-12-475863 (2013). [DOI] [PMC free article] [PubMed] [Google Scholar]
- 34.Soriano P Generalized lacZ expression with the ROSA26 Cre reporter strain. Nat Genet 21, 70–71 (1999). [DOI] [PubMed] [Google Scholar]
- 35.Okabe M, Ikawa M, Kominami K, Nakanishi T & Nishimune Y ‘Green mice’ as a source of ubiquitous green cells. FEBS Lett 407, 313–319 (1997). [DOI] [PubMed] [Google Scholar]
- 36.Sun J, Ramos A, Chapman B, Johnnidis JB, Le L, Ho YJ et al. Clonal dynamics of native haematopoiesis. Nature 514, 322–327, doi: 10.1038/nature13824 (2014). [DOI] [PMC free article] [PubMed] [Google Scholar]
- 37.Li Q, Bohin N, Wen T, Ng V, Magee J, Chen SC et al. Oncogenic Nras has bimodal effects on stem cells that sustainably increase competitiveness. Nature 504, 143–147, doi: 10.1038/nature12830 (2013). [DOI] [PMC free article] [PubMed] [Google Scholar]
- 38.Ksionda O, Mues M, Wandler AM, Donker L, Tenhagen M, Jun J et al. Comprehensive analysis of T cell leukemia signals reveals heterogeneity in the PI3 kinase-Akt pathway and limitations of PI3 kinase inhibitors as monotherapy. PloS one 13, e0193849, doi: 10.1371/journal.pone.0193849 (2018). [DOI] [PMC free article] [PubMed] [Google Scholar]
- 39.Romero-Moya D, Bueno C, Montes R, Navarro-Montero O, Iborra FJ, Lopez LC et al. Cord blood-derived CD34+ hematopoietic cells with low mitochondrial mass are enriched in hematopoietic repopulating stem cell function. Haematologica 98, 1022–1029, doi: 10.3324/haematol.2012.079244 (2013). [DOI] [PMC free article] [PubMed] [Google Scholar]
- 40.Downward J Cancer biology: signatures guide drug choice. Nature 439, 274–275 (2006). [DOI] [PubMed] [Google Scholar]
- 41.Schubbert S, Bollag G & Shannon K Deregulated Ras signaling in developmental disorders: new tricks for an old dog. Curr Opin Genet Dev 17, 15–22, doi:S0959-437X(06)00239-5 [pii] 10.1016/j.gde.2006.12.004 (2007). [DOI] [PubMed] [Google Scholar]
- 42.Stine RR & Matunis EL Stem cell competition: finding balance in the niche. Trends Cell Biol 23, 357–364, doi: 10.1016/j.tcb.2013.03.001 (2013). [DOI] [PMC free article] [PubMed] [Google Scholar]
- 43.Myers DR, Norlin E, Vercoulen Y & Roose JP Active Tonic mTORC1 Signals Shape Baseline Translation in Naive T Cells. Cell reports 27, 1858–1874 e1856, doi: 10.1016/j.celrep.2019.04.037 (2019). [DOI] [PMC free article] [PubMed] [Google Scholar]
- 44.Seita J & Weissman IL Hematopoietic stem cell: self-renewal versus differentiation. Wiley Interdiscip Rev Syst Biol Med 2, 640–653, doi: 10.1002/wsbm.86 (2010). [DOI] [PMC free article] [PubMed] [Google Scholar]
- 45.Wilson A & Trumpp A Bone-marrow haematopoietic-stem-cell niches. Nat Rev Immunol 6, 93–106, doi: 10.1038/nri1779 (2006). [DOI] [PubMed] [Google Scholar]
- 46.Zhang Y, Gao S, Xia J & Liu F Hematopoietic Hierarchy - An Updated Roadmap. Trends Cell Biol 28, 976–986, doi: 10.1016/j.tcb.2018.06.001 (2018). [DOI] [PubMed] [Google Scholar]
- 47.Knudson AG Jr. Mutation and cancer: statistical study of retinoblastoma. Proc Natl Acad Sci U S A 68, 820–823 (1971). [DOI] [PMC free article] [PubMed] [Google Scholar]
- 48.Gilliland DG & Griffin JD The roles of FLT3 in hematopoiesis and leukemia. Blood 100, 1532–1542 (2002). [DOI] [PubMed] [Google Scholar]
- 49.Montes R, Ayllon V, Prieto C, Bursen A, Prelle C, Romero-Moya D et al. Ligand-independent FLT3 activation does not cooperate with MLL-AF4 to immortalize/transform cord blood CD34+ cells. Leukemia 28, 666–674, doi: 10.1038/leu.2013.346 (2014). [DOI] [PubMed] [Google Scholar]
- 50.Sanjuan-Pla A, Bueno C, Prieto C, Acha P, Stam RW, Marschalek R et al. Revisiting the biology of infant t(4;11)/MLL-AF4+ B-cell acute lymphoblastic leukemia. Blood 126, 2676–2685, doi: 10.1182/blood-2015-09-667378 (2015). [DOI] [PMC free article] [PubMed] [Google Scholar]
- 51.Sun C, Chang L & Zhu X Pathogenesis of ETV6/RUNX1-positive childhood acute lymphoblastic leukemia and mechanisms underlying its relapse. Oncotarget 8, 35445–35459, doi: 10.18632/oncotarget.16367 (2017). [DOI] [PMC free article] [PubMed] [Google Scholar]
- 52.Beck-Engeser GB, Lum AM, Huppi K, Caplen NJ, Wang BB & Wabl M Pvt1-encoded microRNAs in oncogenesis. Retrovirology 5, 4 (2008). [DOI] [PMC free article] [PubMed] [Google Scholar]
- 53.Xu Z, Wang M, Wang L, Wang Y, Zhao X, Rao Q et al. Aberrant expression of TSC2 gene in the newly diagnosed acute leukemia. Leuk Res 33, 891–897, doi: 10.1016/j.leukres.2009.01.041 (2009). [DOI] [PubMed] [Google Scholar]
- 54.Kalaitzidis D, Sykes SM, Wang Z, Punt N, Tang Y, Ragu C et al. mTOR complex 1 plays critical roles in hematopoiesis and Pten-loss-evoked leukemogenesis. Cell stem cell 11, 429–439, doi: 10.1016/j.stem.2012.06.009 (2012). [DOI] [PMC free article] [PubMed] [Google Scholar]
- 55.Kentsis A & Look AT Distinct and dynamic requirements for mTOR signaling in hematopoiesis and leukemogenesis. Cell stem cell 11, 281–282, doi: 10.1016/j.stem.2012.08.007 (2012). [DOI] [PubMed] [Google Scholar]
- 56.Magee JA, Ikenoue T, Nakada D, Lee JY, Guan KL & Morrison SJ Temporal changes in PTEN and mTORC2 regulation of hematopoietic stem cell self-renewal and leukemia suppression. Cell stem cell 11, 415–428, doi: 10.1016/j.stem.2012.05.026 (2012). [DOI] [PMC free article] [PubMed] [Google Scholar]
- 57.Sanjuan-Pla A, Romero-Moya D, Prieto C, Bueno C, Bigas A & Menendez P Intra-Bone Marrow Transplantation Confers Superior Multilineage Engraftment of Murine Aorta-Gonad Mesonephros Cells Over Intravenous Transplantation. Stem Cells Dev 25, 259–265, doi: 10.1089/scd.2015.0309 (2016). [DOI] [PubMed] [Google Scholar]
- 58.Pietras EM, Reynaud D, Kang YA, Carlin D, Calero-Nieto FJ, Leavitt AD et al. Functionally Distinct Subsets of Lineage-Biased Multipotent Progenitors Control Blood Production in Normal and Regenerative Conditions. Cell Stem Cell 17, 35–46, doi: 10.1016/j.stem.2015.05.003 (2015). [DOI] [PMC free article] [PubMed] [Google Scholar]
- 59.Herault A, Binnewies M, Leong S, Calero-Nieto FJ, Zhang SY, Kang YA et al. Myeloid progenitor cluster formation drives emergency and leukaemic myelopoiesis. Nature 544, 53–58, doi: 10.1038/nature21693 (2017). [DOI] [PMC free article] [PubMed] [Google Scholar]
- 60.Roose JP, Diehn M, Tomlinson MG, Lin J, Alizadeh AA, Botstein D et al. T Cell Receptor-Independent Basal Signaling via Erk and Abl Kinases Suppresses RAG Gene Expression. PLoS Biol 1, E53 (2003). [DOI] [PMC free article] [PubMed] [Google Scholar]
Associated Data
This section collects any data citations, data availability statements, or supplementary materials included in this article.