

Abstract
Objective:
The effect of rifapentine plus isoniazid on efavirenz pharmacokinetics was characterized in AIDS Clinical Trials Group protocol A5279 (NCT01404312). The present analyses characterize pharmacogenetic interactions between these drugs, and with nevirapine.
Methods:
A subset of HIV-positive individuals receiving efavirenz- or nevirapine-containing antiretroviral therapy in A5279 underwent pharmacokinetic evaluations at baseline, and again weeks 2 and 4 after initiating daily rifapentine plus isoniazid. Associations with polymorphisms relevant to efavirenz, nevirapine, isoniazid and rifapentine pharmacokinetics were assessed.
Results:
Of 128 participants, 101 were evaluable for associations with rifapentine and its active 25-desacetyl metabolite, 87 with efavirenz, and 38 with nevirapine. In multivariable analyses, NAT2 slow acetylators had greater week 4 plasma concentrations of rifapentine (p = 2.6 × 10⁻³) and 25-desacetyl rifapentine (p = 7.0 × 10⁻⁵) among all participants, and in efavirenz and nevirapine subgroups. NAT2 slow acetylators also had greater plasma efavirenz and nevirapine concentration increases from baseline to week 4, and greater decreases from baseline in clearance. CYP2B6 poor metabolizers had greater efavirenz concentrations at all weeks, and greater nevirapine concentrations at baseline. None of 47 additional polymorphisms in 11 genes were significantly associated with pharmacokinetics.
Conclusions:
Among HIV-positive individuals receiving efavirenz or nevirapine, and who then initiated rifapentine plus isoniazid in A5279, NAT2 slow acetylators had greater rifapentine and 25-desacetyl rifapentine concentrations, and greater increases from baseline in plasma efavirenz and nevirapine concentrations. These associations are likely mediated by greater isoniazid exposure in NAT2 slow acetylators.
Introduction
Tuberculosis and human immunodeficiency virus (HIV) are major causes of death worldwide [1]. Isoniazid is a cornerstone of latent tuberculosis infection (LTBI) treatment, but because of difficulties with adherence [2], shorter regimens for LTBI have been studied. A 3-month regimen of once-weekly rifapentine plus isoniazid was as effective as 9 months of daily isoniazid in HIV-negative individuals [3, 4]. A subsequent randomized trial in HIV-positive persons showed that 3 months of weekly rifapentine and isoniazid was as effective and better tolerated than 9 months of daily isoniazid [5].
Protocol A5279 (NCT01404312) of the AIDS Clinical Trials Group (ACTG) was a randomized, open-label trial comparing 1 month of daily rifapentine (300 mg, 450mg or 600 mg depending on weight) plus isoniazid (300 mg) with 9 months of daily isoniazid (300 mg alone) in HIV-positive patients [6]. Of 3000 enrolled, half were receiving antiretroviral therapy, which included efavirenz or nevirapine. The 1 month regimen was noninferior to the 9 month regimen for preventing tuberculosis, and had a higher completion percentage [6].
Efavirenz and nevirapine are P450 (CYP) substrates [7, 8], and rifapentine induces cytochrome CYP isoforms [9], raising concern that rifapentine might lower efavirenz and nevirapine exposure. An analysis involving a subset of 87 A5279 participants showed that rifapentine plus isoniazid did not meaningfully reduce efavirenz mid-dosing concentrations [10], but increased nevirapine clearance by 30% [11].
Genetic polymorphisms predict increased plasma exposure and toxicity with isoniazid, efavirenz and nevirapine. Isoniazid is acetylated by N-acetyltransferase 2 [12], and NAT2 loss-of-function alleles are frequent [12–15]. One or two copies of such alleles confer intermediate or slow acetylator phenotypes, respectively, and progressively greater isoniazid exposure [12–15]. Slow acetylator alleles increase risk for isoniazid hepatotoxicity [16–18] and possibly neuropathy [19, 20].
Plasma efavirenz exposure is predicted by CYP2B6 polymorphisms [21], especially CYP2B6 516G→T (rs3745274) [22–24], 983T→C (rs28399499) [24–26], and 15582C→T (rs4803419) [24]. Studies have associated CYP2B6 poor metabolizer genotypes with efavirenz adverse events [21] including central nervous system symptoms [22, 27, 28] and suicidality [29]. Plasma nevirapine clearance also occurs through CYP2B6, less so through CYP3A and other isoforms, and increased nevirapine exposure is also associated with these CYP2B6 loss-of-function polymorphisms [23, 30–33]. Risk of rash with nevirapine is increased in CYP2B6 poor metabolizers [34].
The rifamycin antibiotic, rifampicin, potently induces hepatic CYP isoforms, and in a study of 11 healthy, HIV-negative volunteers modestly and variability reduced efavirenz plasma exposure [35]. However, some patients receiving tuberculosis therapy that includes isoniazid with rifampicin, and who have CYP2B6 and/or NAT2 loss-of-function polymorphisms, experience increased efavirenz exposure [36–38]. This is likely mediated by isoniazid, as isoniazid without rifamycins also reduces efavirenz clearance among CYP2B6 poor metabolizers [37]. The mechanism may involve isoniazid inhibition of CYP2A6, a minor pathway for efavirenz elimination [37–40]. Less is known about rifapentine, but in healthy volunteers, rifapentine decreased midazolam area under the concentration-time curve (AUC) by 92%, suggesting that rifapentine may induce CYP3A4 more than does rifampin [41].
There are fewer data regarding nevirapine interactions with antituberculous drugs. Among 164 newborns given nevirapine following delivery from HIV-positive mothers, concomitant rifampicin plus isoniazid was associated with 33% lower nevirapine trough concentrations [42]. Conversely, among 21 patients randomized to placebo or isoniazid while receiving antiretroviral therapy, isoniazid was associated with a 24% increase in median nevirapine AUC [43].
The present study characterized the pharmacogenetics of interactions between isoniazid plus rifapentine with efavirenz and nevirapine in a subgroup of A5279 participants, an a priori objective of A5279.
METHODS
Study Population
Study A5279 was a multicenter, randomized, open-label clinical trial comparing a 4-week daily rifapentine and isoniazid regimen with a standard 9-month daily isoniazid regimen to prevent tuberculosis in HIV-positive participants [6]. Pharmacokinetic evaluations were planned for the first 90 participants each on efavirenz-containing and nevirapine-containing antiretroviral therapy for at least 4 weeks prior to entry, and who were randomized to rifapentine plus isoniazid. Institutional review boards of the participating institutions approved the study, and participants gave written informed consent.
Procedures
Rifapentine dosing was weight-based (300 mg, 450 mg, or 600 mg). Isoniazid dosing was 300 mg daily with pyridoxine 25 mg. Isoniazid and rifapentine were taken together with food. Efavirenz dosing was 600 mg once daily, and nevirapine 200 mg twice daily. Plasma was collected for pharmacokinetic evaluations at entry (week 0, before starting rifapentine and isoniazid) and at weeks 2 and 4 (with rifapentine and isoniazid). For pharmacologic evaluation of efavirenz, mid-dosing interval plasma was collected. For nevirapine, trough plasma samples were collected at weeks 0, 2 and 4. Efavirenz and nevirapine were quantified by ultra-performance liquid chromatography [44]. Rifapentine and 25-desacetyl rifapentine were quantified by liquid chromatography/tandem mass spectrometry [45]. Pharmacokinetic parameter estimation was accomplished using maximuma posteriori probability–Bayesian estimation implemented in ADAPT II (Biomedical Simulations Resource at the University of Southern California, Los Angeles) [46]. Plasma concentrations from weeks 2 and 4 were taken together to estimate the apparent oral clearance (CL/F) of efavirenz and nevirapine with concomitant rifapentine and isoniazid.
Genetic Polymorphisms
Human DNA was extracted from whole blood. We genotyped 59 polymorphisms of interest, in CYP2B6, CYP2A6, CYP3A4, CYP3A5, HNF4A, NAT2, NR1I2, NR1I3, SLCO1B1, TRIM4, UGT1A1, and intragenic. These included CYP2B6 polymorphisms that predict efavirenz exposure, and NAT2 polymorphisms that predict isoniazid exposure. Genotyping was done in VANTAGE (Vanderbilt Technology for Advanced Genomics) using MassARRAY® iPLEX Gold (Agena Bioscience™, California, USA) and Taqman (ThermoFisher Scientific, Massachusetts, USA). Assay design is available upon request. We excluded 11 polymorphisms with minor allele frequencies less than 5%. Polymorphisms that define CYP2B6 or NAT2 metabolizer status were not excluded. Genotyping efficiency exceeded 96% for all polymorphisms, and 100% for 45 of 48 polymorphisms. All were in Hardy-Weinberg equilibrium among self-identified Blacks, Asians and Hispanics analyzed separately after correcting for multiple comparisons, except NR1I2 rs3732360 (Hardy-Weinberg p=6.1×10⁻⁶ among Blacks) which was excluded from analyses. Several polymorphisms with nominal Hardy-Weinberg P-values <0.05 were not excluded (rs11045819, rs11045872 and rs4149032 in Blacks, p>0.04 for each). Analyses ultimately included 47 polymorphisms (Supplemental Material).
Statistical analysis
Associations were assessed using linear regression models. Associations between pharmacokinetic parameters, CYP2B6 metabolizer group, and NAT2 acetylator group were assessed using STATA version 15.1 (StataCorp, College Station, Texas, USA). Associations with the 47 polymorphisms were assessed using PLINK version 1.07 [47]. Efavirenz and nevirapine concentrations were log10 transformed. For concentration associations, we included efavirenz values between 9 and 30 hours post dose, nevirapine values between 10 and 15 hours post dose, and rifapentine and 25-desacetyl rifapentine values between 10 and 36 hours post dose. Individuals without baseline body mass index (BMI) data were excluded.
Composite CYP2B6 metabolizer genotype was defined based on combinations of three polymorphisms as follows: normal (1: 15582CC-516GG-983TT or 2: 15582CT-516GG-983TT); intermediate (3: 15582TT-516GG-983TT; 4: 15582CC-516GT-983TT; 5: 15582CC-516GG-983CT; 6: 15582CT-516GT-983TT; or 7: 15582CT-516GG-983CT); and poor (8: 15582CC-516TT-983TT; 9: 15582CC-516GT-983CT; 10: 15582CC-516GG-983CC [24]. For NAT2, genotypes were categorized based on combinations of rs1801280 (NAT2*5), rs1799930 (NAT2*6), rs1799931 (NAT2*7), and rs1801279 (NAT2*14), as slow if homozygous for the variant allele at any locus or heterozygous at 2 or more loci; intermediate if heterozygous at a single locus; or rapid if no variant allele [48]. Analyses with CYP2B6 and NAT2 genotype groups did not correct for multiple comparisons. For the 47 polymorphisms and 6 phenotype comparisons (i.e., 2 phenotypes, log10 absolute concentration and CL/F, each with 3 time considerations, week 0, week 4, and change from week 0 to week 4) we used Bonferroni correction (significance threshold P = 1.9×10⁻⁴). Two-sided tests were used.
RESULTS
Participant characteristics
Analyses included 128 participants evaluable for pharmacogenetics associations during at least one study week, including 87 for efavirenz, 38 for nevirapine, and 106 for both rifapentine and 25-desacetyl rifapentine. Black participants were overrepresented in the efavirenz group, and females and Thai participants in the nevirapine group. Overall, 14 (11%) of participants were CYP2B6 poor metabolizers, and 46 (36%) were NAT2 slow acetylators (Table 1).
Table 1.
Baseline characteristics of A5279 participants included in genetic association analyses
| Total (n=128)a | Efavirenz Group (n=87)b | Nevirapine Group (n=38)b | RPT/INH Group (n=106)b | |
|---|---|---|---|---|
| Age in years, median (range) | 35 (13 – 61) | 35 (13 – 61) | 38 (13 – 53) | 36 (13 – 61) |
| Sex | ||||
| female; n (%) | 74 (58) | 43 (49) | 27 (71) | 59 (56) |
| male; n (%) | 54 (42) | 44 (51) | 11 (29) | 47 (44) |
| Race/Ethnicity; n (%) | ||||
| Asian, Pacific Islander | 59 (46) | 33 (38) | 26 (68) | 54 (51) |
| Black | 58 (45) | 44 (51) | 11 (29) | 43 (41) |
| Hispanic | 10 (8) | 9 (10) | 1 (3) | 8 (8) |
| White | 1 (1) | 1 (1) | 0 (0) | 1 (1) |
| Country; n (%) | ||||
| Thailand | 58 (45) | 32 (37) | 26 (68) | 53 (50) |
| South Africa | 35 (27) | 34 (39) | 0 (0) | 26 (25) |
| United States of America | 14 (11) | 13 (15) | 0 (0) | 11 (10) |
| Botswana | 12 (9) | 5 (6) | 6 (16) | 8 (8) |
| Kenya | 5 (4) | 0 (0) | 5 (13) | 5 (5) |
| Peru | 4 (3) | 3 (3) | 1 (3) | 3 (3) |
| BMI in kg/m2, median (range) | 22.6 (15,3 – 41.7) | 23.2 (15.4 – 41.7) | 20.5 (15.3 – 35.4) | 22.5 (15.3 – 41.7) |
| CYP2B6 metabolizer genotype; n (%) | ||||
| normal | 43 (34) | 25 (29) | 17 (45) | 36 (34) |
| intermediate | 71 (55) | 51 (59) | 18 (47) | 58 (55) |
| poor | 14 (11) | 11 (13) | 3 (8) | 12 (11) |
| NAT2 metabolizer genotype; n (%) | ||||
| rapid | 22 (17) | 15 (17) | 7 (18) | 16 (15) |
| intermediate | 59 (46) | 40 (46) | 17 (45) | 50 (47) |
| slow | 46 (36) | 32 (37) | 14 (37) | 40 (38) |
Includes 128 participants with both CYP2B6 genotype data and week 0 efavirenz or nevirapine concentration data.
For efavirenz, nevirapine and rifapentine, we included only individuals with available data for CYP2B6 genotype, NAT2 genotype, and sex. For efavirenz and rifapentine we also required data for BMI.
Efavirenz pharmacokinetics
In analyses that controlled for BMI and sex, higher efavirenz concentrations and slower CL/F were most strongly associated CYP2B6 poor metabolizer genotype at all weeks. At baseline, the geometric mean efavirenz concentration was 5.9-times greater in CYP2B6 poor (9,863 ng/mL) than in normal metabolizers (1,680 ng/mL). At week 4, NAT2 genotype was also associated with efavirenz pharmacokinetics. In contrast, change in both efavirenz concentrations and CL/F from baseline to week 4 were more strongly associated with NAT2 acetylator status. For change in efavirenz concentration, the NAT2 p=9.7×10⁻⁶ (β coefficient = 0.42) while CYP2B6 p=0.029 (β coefficient = 0.12). Lower BMI and female sex were independently associated with higher efavirenz concentrations and slower efavirenz CL/F at each week (Table 2). Associations with efavirenz concentrations at week 2, and with change from baseline to week 2, were similar to associations at week 4 (Supplemental Material).
Table 2.
Multivariable models of efavirenz and nevirapine PK parameter associations with CYP2B6 genotype, NAT2 genotype, sex, and body mass index.
| n | Plasma Concentration β coefficient, P-value |
n | Plasma Clearanced β coefficient, P-value |
|
|---|---|---|---|---|
| Efavirenz | ||||
| Week 0 (without INH/RPT) | 87 | 82 | ||
| CYP2B6 genotype | 0.63, 2.0×10⁻¹⁴ | −0.60, 2.9×10⁻¹¹ | ||
| NAT2 genotype | 0.01, 0.89 | 0.15, 0.061 | ||
| Body mass index | −0.29, 8.9×10⁻⁵ | 0.30, 5.2×10⁻⁵ | ||
| Female sex | 0.19, 0.015 | −0.21, 8.0×10⁻³ | ||
| Week 4 (with INH/RPT) | 80 | 80 | ||
| CYP2B6 genotype | 0.53, 5.9×10⁻¹² | −0.57, 6.2×10⁻¹⁸ | ||
| NAT2 genotype | 0.22, 1.2×10⁻³ | −0.22, 2.0×10⁻⁴ | ||
| Body mass index | −0.37, 2.3×10⁻⁷ | 0.39, 9.4×10⁻⁸ | ||
| Female sex | 0.27, 6.4×10⁻⁴ | −0.39, 5.6×10⁻⁸ | ||
| Change, week 0 to week 4 | 80 | 80 | ||
| CYP2B6 genotype | 0.12, 0.029 | −0.14, 0.15 | ||
| NAT2 genotype | 0.42, 9.7×10⁻⁶ | −0.44, 5.9×10⁻⁶ | ||
| Body mass index | −0.25, 2.3×10⁻³ | 0.18, 0.010 | ||
| Female sex | 0.30, 5.0×10⁻³ | −0.29, 3.9 ×10⁻³ | ||
| Nevirapine | ||||
| Week 0 (without INH/RPT) | 36 | 36 | ||
| CYP2B6 genotype | 0.46, 1.7×10⁻³ | −0.50, 8.6×10⁻⁴ | ||
| NAT2 genotype | −0.11, 0.39 | −0.04, 0.79 | ||
| Female sex | 0.38, 0.010 | −0.16, 0.17 | ||
| Week 4 (with INH/RPT) | 36 | 35 | ||
| CYP2B6 genotype | 0.24, 0.027 | −0.16, 0.11 | ||
| NAT2 genotype | 0.48, 2.9×10⁻⁴a | −0.38, 6.9×10⁻³ | ||
| Female sex | 0.39, 0.013 | −0.46, 0.012 | ||
| Change, week 0 to week 4 | 34 | 35 | ||
| CYP2B6 genotype | −0.05, 0.66 | 0.08, 0.45 | ||
| NAT2 genotype | 0.61, 3.7×10⁻⁵a | −0.36, 0.037a | ||
| Female sex | 0.20, 0.24 | −0.43, 0.014 |
These associations with NAT2 genotype persisted at p<0.05 in analyses limited to self-identified Asian, Pacific Islanders.
There were no significant interactions between NAT2 genotype and CYP2B6 genotypes (at P<0.05) identified in any of these analyses.
log10 transformations were used for absolute efavirenz and nevirapine concentrations.
Clearance data (“week 4”) were generated using concentration data from both week 2 and week 4.
Relationships between CYP2B6 genotype, NAT2 genotype, and efavirenz concentrations at weeks 0, 2 and 4 are shown in Figure 1. Among all participants, efavirenz concentrations increased from week 0 to week 2 in 33 (39%) of 85. Among NAT2 rapid acetylators, efavirenz concentrations increased from week 0 to week 2 in 1 (7%) of 14, whereas among NAT2 slow acetylators, efavirenz concentrations increased from week 0 to week 2 in 23 (74%) of 31. Among NAT2 intermediate acetylators, change in efavirenz concentrations varied by CYP2B6 genotype, with increased efavirenz concentrations in 0 (0%) of 12 CYP2B6 normal metabolizers, and increased efavirenz concentrations in 9 (32%) of 28 CYP2B6 intermediate or poor metabolizers. Findings were similar for change from week 0 to week 4. Relationships between CYP2B6 genotype, NAT2 genotype, and efavirenz CL/F at week 0 and week 2/4 mirrored concentration data (Supplemental Material).
Figure 1. Relationships between CYP2B6 metabolizer genotype, NAT2 acetylator genotype, and plasma efavirenz concentrations among 85 efavirenz group participants.

Each panel indicates which CYP2B6 metabolizer genotype and NAT2 acetylator genotype is represented. The percentages in each panel represent individuals in whom efavirenz concentrations increased from baseline (week 0) to week 2. Red lines and markers represent individuals in whom efavirenz concentrations increased from baseline to week 2. Note that Y-axes differ among the graphs. The graphs only include individual who also had data for BMI, sex, and efavirenz concentration data between 9 hours and 30 hours post dose. EFV = efavirenz. * Not represented is one individual with nevirapine concentrations of 38,061 ng/mL and 58,589 ng/mL at baseline and week 2, respectively. Green dashed lines represent an efavirenz concentration of 4000 ng/mL, the suggested threshold for increased toxicity [21].
The only individual to experience grade 3 ALT or AST elevation was an Asian female in the efavirenz group, with a BMI of 19.9 kg/m2, and both CYP2B6 poor metabolizer and NAT2 slow acetylator genotypes. From week 0 to week 2 her efavirenz concentration increased from 18,340 to 27,874 ng/mL (the highest value in the entire cohort), ALT increased from 19 to 140 IU/L, AST increased from 24 to 69 IU/L, and her week 2 rifapentine and 25-desacetyl rifapentine concentrations were 23,646 and 36,161 ng/mL, respectively (among the highest in the cohort). She discontinued study before week 4.
Exploratory analyses beyond CYP2B6 and NAT2 groups included 47 polymorphisms. Each polymorphism was included separately in the above models, adjusting for CYP2B6 metabolizer genotype, NAT2 acetylator genotype, BMI, and sex. There were no consistent associations, and none withstood correction for multiple comparisons. At week 0, the lowest P-values for log10 efavirenz concentration and CL/F were NR1I2 rs4688040 (P=0.05) and NAT2 rs4646244 (P=0.0041), respectively. At week 2, the lowest P-values for log10 efavirenz concentration and CL/F were HNF4A rs2071197 (P=0.06) and CYP3A5 rs776746 (P=0.0033), respectively. The lowest P-values for change from week 0 to week 2 in log10 efavirenz concentration and CL/F were SLCO1B1 rs4363657, rs4149081, rs11045879 (for each, P=0.0024) and NAT2 rs1208 (P=0.015), respectively. Association with each polymorphism are in Supplemental Material.
Nevirapine pharmacokinetics
In analyses that controlled for sex, higher nevirapine concentrations and slower CL/F at week 0 were associated with CYP2B6 poor metabolizer genotypes. At baseline, the geometric mean nevirapine concentration was 1.85-times greater in CYP2B6 poor (9,885 ng/mL) than in normal metabolizers (5,334 ng/mL). In contrast, higher nevirapine concentrations and slower CL/F at week 4 were more strongly associated with NAT2 slow acetylator genotype. Change from baseline to week 4 in nevirapine concentrations and CL/F were associated with NAT2 genotype but not CYP2B6 genotype. For change in nevirapine CL/F from baseline to week 4, NAT2 p=3.7×10⁻⁵ (β coefficient = 0.61) while CYP2B6 p=0.66 (β coefficient = −0.05). At week 4, geometric mean nevirapine concentrations were 2.3-times higher in NAT2 slow (6,173 ng/mL) than in rapid acetylators (2,749 ng/mL). Female sex was associated with nevirapine concentrations and CL/F in some models (Table 2). Body mass index was not significantly associated with nevirapine pharmacokinetics in multivariable models, so was not included. Genetic associations with nevirapine concentrations at week 2, and change from baseline to week 2, were similar to associations at week 4 (Supplemental Material).
Analyses were repeated among just the 26 Asian participants in the nevirapine group. Results were similar to those for all participants. For log10 nevirapine concentration at week 4 among Asian participants, NAT2 p=1.3×10⁻⁴ (β coefficient = 0.59) and CYP2B6 p=0.22 (β coefficient = 0.16). At week 4, geometric mean nevirapine concentrations among Asians were 3.1-times higher in NAT2 slow (6,958 ng/mL) than in rapid acetylators (2,259 ng/mL) (Supplemental Material).
Temporal relationships between CYP2B6 genotype, NAT2 genotype, and nevirapine concentrations at weeks 0, 2 and 4 are shown in Figure 2. Among NAT2 rapid and intermediate acetylators, nevirapine concentrations decreased from week 0 to week 2 in 21 (95%) of 22 participants, whereas among NAT2 slow acetylators, nevirapine concentrations increased from week 0 to week 2 in 8 (62%) of 13 participants. Temporal relationships between CYP2B6 genotype, NAT2 genotype, and nevirapine CL/F at week 0 and week 2/4 mirrored concentration results (Supplemental Material).
Figure 2. Relationships between CYP2B6 metabolizer genotype, NAT2 acetylator genotype, and plasma nevirapine concentrations among 35 nevirapine group participants.

Each panel indicates which CYP2B6 metabolizer genotype and NAT2 acetylator genotype is represented. The percentages in each panel represent individuals in whom nevirapine concentrations increased from baseline (week 0) to week 2. Red lines and markers represent individuals in whom nevirapine concentrations increased from baseline to week 2. Note that Y-axes differ among the graphs. The graphs only include individual who also had data for sex, and nevirapine concentration data between 10 hours and 15 hours post dose. NVP = nevirapine.
For exploratory analyses, each of 47 polymorphisms was included separately in the above models, adjusting for CYP2B6 metabolizer genotype, NAT2 acetylator genotype, and sex. There were no consistent associations, and none withstood correction for multiple comparisons. At week 0, the lowest P-values for log10 nevirapine concentration and CL/F were NAT2 rs1799930 (P=0.030) and NAT2 rs4271002 (P=0.035), respectively. At week 2, the lowest P-values for log10 nevirapine concentration and CL/F were NR1I2 rs4688040 (P=0.003) and SLCO1B1 rs10841753 (P=7.2×10⁻⁴), respectively. The lowest P-values for change from week 0 to week 2 in log10 nevirapine concentration and CL/F were NR1I2 rs7643645 (P=0.0037) and SLCO1B1 rs10841753 (P=0.0056), respectively. Association with each polymorphism are in Supplemental Material.
Associations with rifapentine and 25-desacetly rifapentine concentrations
In analyses that controlled for BMI, sex, and time since prior rifapentine dose, NAT2 slow acetylator genotype was associated with higher concentrations of rifapentine and/or 25-desacetyl rifapentine, more so at week 4 than at week 2. Among all participants at week 4, NAT2 genotype was associated with concentrations of rifapentine (P=2.6×10⁻³, β= 0.25) and 25-desacetyl rifapentine (P=7.0×10⁻⁵, β= 0.33). This was also seen in efavirenz and nevirapine groups analyzed separately. Lower BMI, female sex, and shorter time since prior rifapentine dose were also associated with higher rifapentine and 25-desacetyl rifapentine concentrations. There were no associations between CYP2B6 genotype and rifapentine or 25-desacetyl rifapentine concentrations (Table 3). Results were similar among 26 Asian participants in the nevirapine group (Supplemental Material). Relationships between NAT2 genotype and week 4 rifapentine and 25-desacetyl rifapentine concentrations among all participants, and stratified by efavirenz and nevirapine group, are shown in Figure 3.
Table 3.
Multivariable models of rifapentine and desacetyl- rifapentine concentration associations with CYP2B6 genotype, NAT2 genotype, sex, body mass index, and rifapentine dose.
| n | Plasma RPT β coefficient, P-value |
Plasma des-RPT β coefficient, P-value |
|
|---|---|---|---|
| All participants | |||
| Week 2 | 101 | ||
| NAT2 genotype | 0.12, 0.095 | 0.24, 5.0 ×10⁻³ | |
| CYP2B6 genotype | 0.0005, 0.99 | −0.01, 0.3091 | |
| Body mass index | −0.13, 0.046 | −0.16, 0.026 | |
| Female sex | 0.31, 3.4×10⁻⁴ | 030, 1.0×10⁻³ | |
| Hours since rifapentine dose | −0.56, 9.4×10⁻¹¹ | −0.44, 2.5×10⁻⁶ | |
| Week 4 | 101 | ||
| NAT2 genotype | 0.25, 2.6×10⁻³ | 0.33, 7.0×10⁻⁵ | |
| CYP2B6 genotype | 0.05, 0.55 | 0.07, 0.37 | |
| Body mass index | −0.17, 0.04 | −0.21, 0.011 | |
| Female sex | 0.34, 9.6×10⁻⁵ | 0.37, 2.6×10⁻⁵ | |
| Hours since rifapentine dose | −0.46, 3.0×10⁻⁸ | −0.29, 3.8×10⁻⁴ | |
| Efavirenz groupa | |||
| Week 2 | 63 | ||
| NAT2 genotype | 0.097, 0.36 | 0.20, 0.075 | |
| CYP2B6 genotype | 0.003, 0.96 | 0.07, 0.51 | |
| Body mass index | −0.14, 0.081 | −0.17, 0.069 | |
| Female sex | 0.25, 0.031 | 0.26, 0.036 | |
| Hours since rifapentine dose | −0.60, 1.1×10⁻⁶ | −0.52, 2.7×10⁻⁵ | |
| Week 4 | 65 | ||
| NAT2 genotype | 0.24, 0.024 | 0.32, 8.0×10⁻³ | |
| CYP2B6 genotype | 0.12, 0.25 | −0.10, 0.28 | |
| Body mass index | −0.07, 0.3951 | −0.15, 0.17 | |
| Female sex | 0.25, 0.024 | 0.25, 0.018 | |
| Hours since rifapentine dose | −0.50, 2.3×10⁻⁶ | −0.37, 2.0×10⁻⁴ | |
| Nevirapine groupa | |||
| Week 2 | 38 | ||
| NAT2 genotypeb | 0.16, 0.21 | 0.31, 0.028 | |
| CYP2B6 genotype | 0.06, 0.70 | 0.046, 0.76 | |
| Female sex | 0.36, 8.5×10⁻³ | 0.26, 0.067 | |
| Hours since rifapentine dose | −0.45, 1.3×10⁻³ | −0.29, 0.045 | |
| Week 4 | 35 | ||
| NAT2 genotypeb | 0.31, 0.063 | 0.41, 1.7×10⁻³ | |
| CYP2B6 genotype | 0.012, 0.50 | 0.19, 0.30 | |
| Female sex | 0.38, 9.1×10⁻³ | 0.46, 5.9×10⁻³ | |
| Hours since rifapentine dose | −0.27, 0.099 | −0.020, 0.90 |
Rifapentine dose was not included in efavirenz and nevirapine subgroup analyses to avoid overfitting the models.
These associations with NAT2 genotype persisted at p<0.05 in analyses limited to self-identified Asian, Pacific Islanders (data not shown).
Figure 3. Relationships between NAT2 acetylator genotype and plasma concentrations of rifapentine and 25-desacetyl rifapentine at week 4.
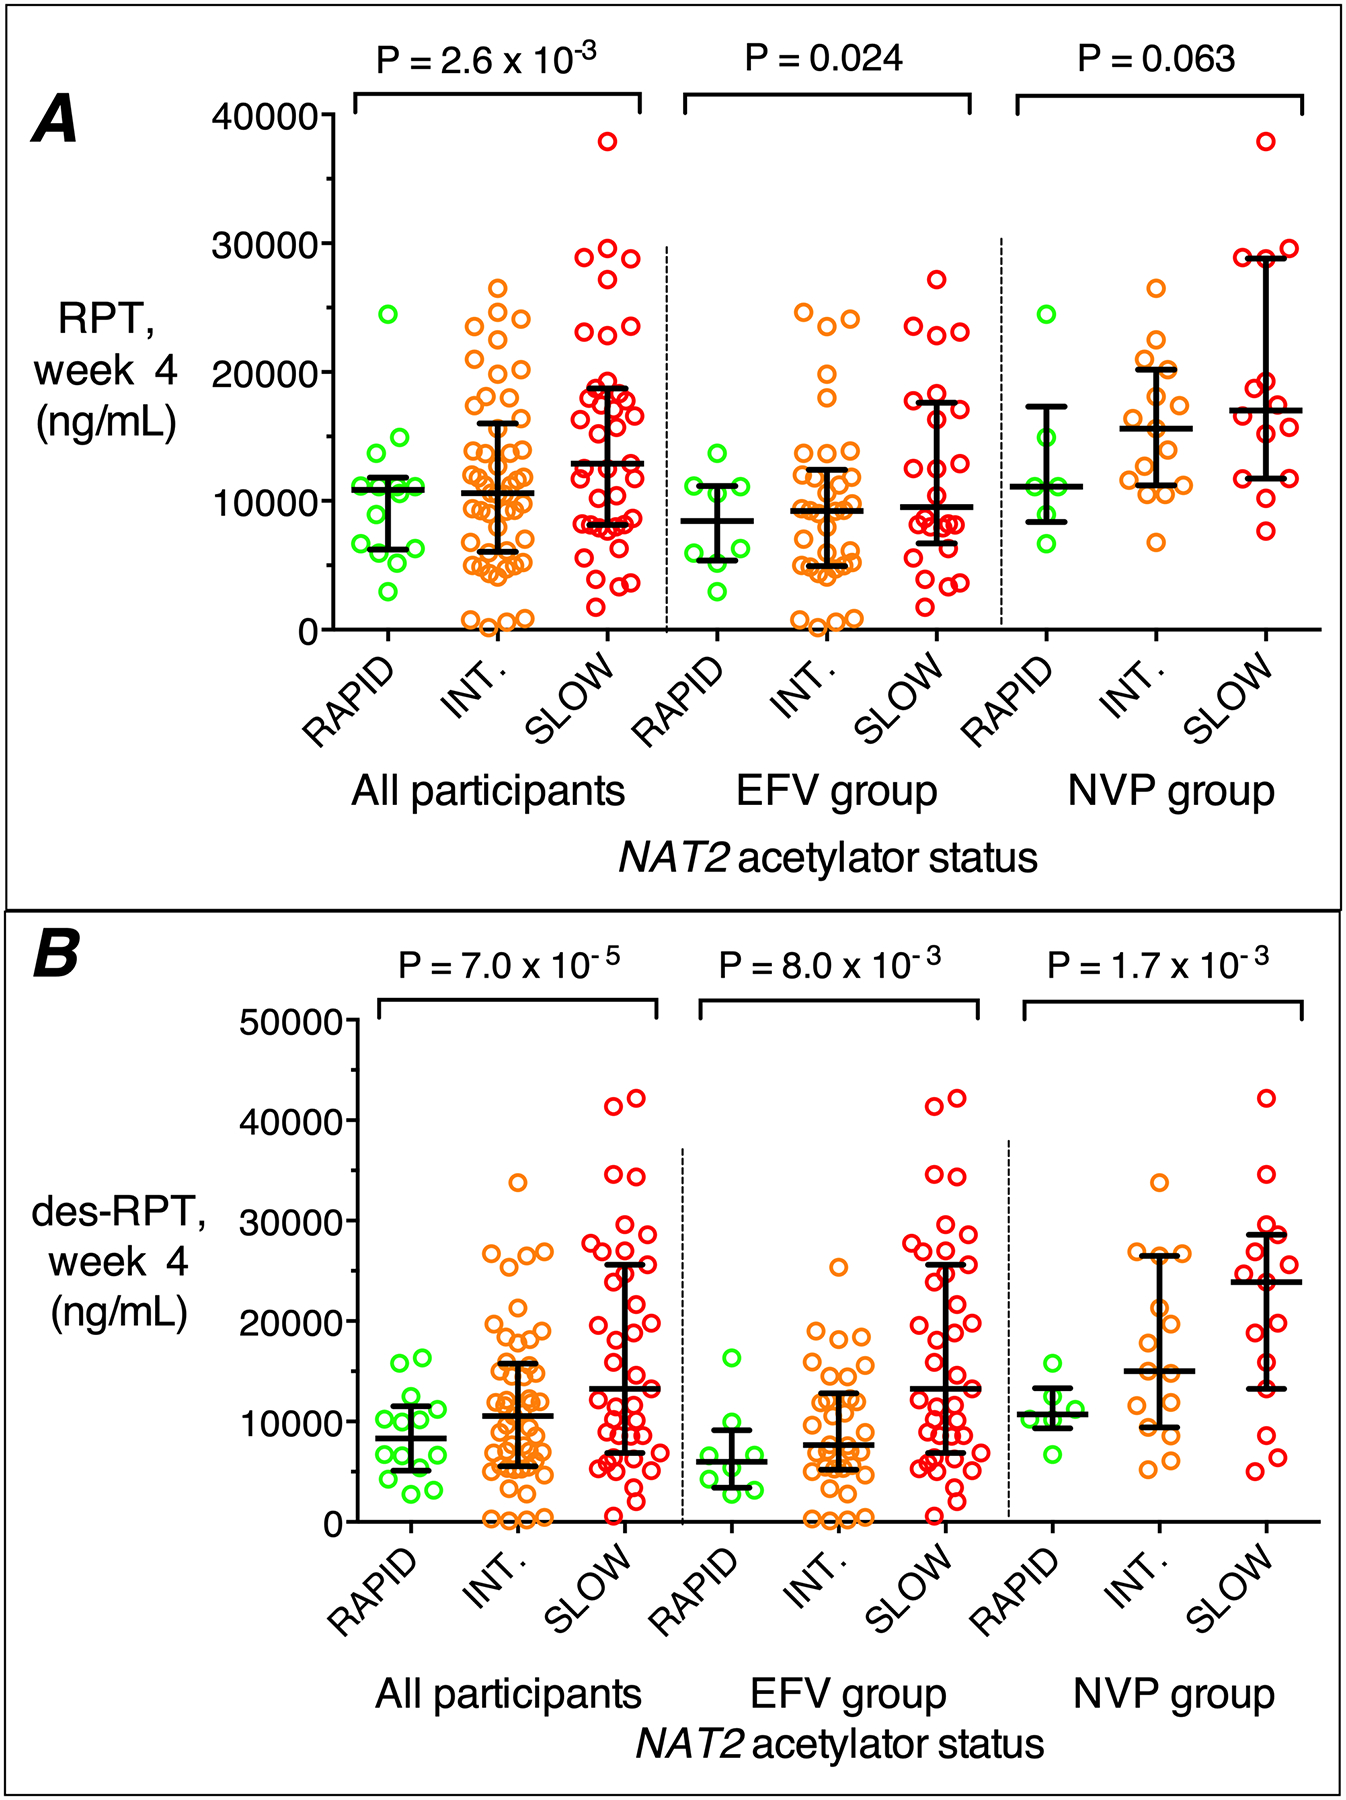
Panel A: associations of rifapentine with NAT2 acetylator genotype among all participants, and in the efavirenz (EFV) group, and the nevirapine (NVP) group analyzed separately. Panel B: associations of plasma 25-desacetyl rifapentine with NAT2 acetylator genotype among all participants, and in the efavirenz (EFV) group, and the nevirapine (NVP) group analyzed separately. RAP, rapid; INT, intermediate; SLO, slow. P-values are from linear regression models that included CYP2B6 genotype, BMI, sex, and hours since rifapentine dose. The graphs only include individual who also had data for CYP2B6 genotype, BMI, sex, and rifapentine concentration data between 10 hours and 36 hours post dose. Error bars indicate medians and 75th percentiles.
For exploratory analyses, each of 47 polymorphisms was included separately in the above models, while adjusting for NAT2 acetylator genotype, BMI, sex, and time since prior rifapentine dose (We did not adjust for BMI in nevirapine subgroup analyses). There were no consistent associations, and none withstood correction for multiple comparisons. At week 4 among all participants, the lowest P-values for rifapentine and 25-desacetyl rifapentine concentrations were UGT1A1 rs887829 (P= 0.0068) and SLCO1B1 rs4149056 (P= 0.0045), respectively. At week 4 in the efavirenz group, the lowest P-values for rifapentine and 25-desacetyl rifapentine concentrations were NAT2 rs1799929 (P= 0.0085) and NAT2 rs1041983 (P= 0.083), respectively. At week 4 in the nevirapine group, the lowest P-values for rifapentine and 25-desacetyl rifapentine concentrations were SLCO1B1 rs2291075 (P= 0.029) and NR1I2 rs1523130 (P= 0.044), respectively. Of note, SLCO1A1 521T→C (rs4149056) that predicts decreased organic anion transporting polypeptide 1B1 (OATP1B1) activity was nominally associated in all participants with lower 25-desacetyl rifapentine concentrations at week 2 (p=0.043) and week 4 (p=0.0045), and in the efavirenz group with lower week 4 rifapentine (p=0.043) and 25-desacetyl rifapentine (p=0.018) concentrations. Associations of rifapentine and 25-desacetyl rifapentine with each polymorphism are provided in Supplemental Material.
The geometric mean rifapentine concentration at week 4 was 1.34-times higher in NAT2 slow (12,224 ng/mL) than in rapid acetylators (9,126 ng/mL), while 25-desacetyl rifapentine concentration was 1.62-times higher in NAT2 slow (12,356 ng/mL) than in rapid acetylators (7,612 ng/mL). In the efavirenz group, the geometric mean rifapentine concentration at week 4 was 1.33-times higher in NAT2 slow (10,003 ng/mL) than in rapid acetylators (7,530 ng/mL), while 25-desacetyl rifapentine concentration was 1.66-times higher in NAT2 slow (9,772 ng/mL) than in rapid acetylators (5,874 ng/mL). In the nevirapine group, the geometric mean rifapentine concentration at week 4 was 1.48-times higher in NAT2 slow (17,489 ng/mL) than in rapid acetylators (11,794 ng/mL), while 25-desacetyl rifapentine concentration was 1.75-times higher in NAT2 slow (18,786 ng/mL) than in rapid acetylators (10,754 ng/mL). Among Asians in the nevirapine group, the geometric mean rifapentine concentration at week 4 was 1.86-times higher in NAT2 slow (19,609 ng/mL) than in rapid acetylators (10,529 ng/mL), while 25-desacetyl rifapentine concentration was 2.16-times higher in NAT2 slow (21,404 ng/mL) than in rapid acetylators (9,889 ng/mL).
DISCUSSION
Protocol A5279 showed that 1 month of rifapentine plus isoniazid was noninferior to 9 months of isoniazid for preventing tuberculosis, and had a higher treatment completion percentage [6]. The present analysis involving a subset of 128 efavirenz or nevirapine recipients from the rifapentine plus isoniazid arm of A5279 who underwent pharmacokinetic evaluations provides novel observations. We report that NAT2 slow acetylators had significantly higher rifapentine and 25-desacetyl rifapentine concentrations among all participants, and in efavirenz and nevirapine subgroups. This was most pronounced among Asians in the nevirapine group, in whom the geometric mean rifapentine and 25-desacetyl rifapentine concentration at week 4 were approximately 2-times higher in NAT2 slow acetylators than in rapid acetylators.
We also report that NAT2 slow acetylator genotype, but not CYP2B6 genotype, was associated with higher nevirapine concentrations, slower nevirapine CL/F at week 4, and greater change from baseline to week 4 among all participants, and among Asians analyzed separately. At week 4, geometric mean nevirapine concentrations were 2.3-times higher in NAT2 slow acetylators than in rapid acetylators. Both CYP2B6 poor metabolizer genotype and NAT2 slow acetylator genotype were associated with higher efavirenz concentrations and slower efavirenz CL/F at week 4, with CYP2B6 genotype having a stronger association. In contrast, change from baseline to week 4 in efavirenz concentrations and CL/F were associated with NAT2 genotype, but little if any with CYP2B6 genotype. Increased efavirenz concentrations from baseline to week 4 were most frequent among NAT2 slow acetylators, but were also found in NAT2 intermediate acetylators with CYP2B6 intermediate or poor metabolizer genotypes.
The effect of NAT2 genotype on rifapentine, 25-desacetyl rifapentine, nevirapine and efavirenz pharmacokinetics is likely mediated by greater isoniazid exposure among slow acetylators [12–15]. Rifapentine, nevirapine and efavirenz are not NAT2 substrates, while isoniazid is a mechanism-based inhibitor of CYP3A4, CYP2A6, CYP1A2 and CYP2C19 [49]. Hepatic CYP isoforms metabolize all four analytes in this study, and higher isoniazid exposure likely inhibits their metabolism, resulting in slower CL/F and higher concentrations. For efavirenz, inhibition of CYP2A6 may be important, while for rifapentine, 25-desacetyl rifapentine and nevirapine, CYP3A4 may be most important.
Increased expression of various drug metabolizing enzymes and transporters is induced by rifapentine [50], nevirapine and efavirenz. Resultant plasma concentrations and changes over time in the present study likely reflect competition between enzyme induction by these compounds, and enzyme inhibition by isoniazid.
Female sex and lower BMI and were independently associated with higher concentrations of rifapentine, 25-desacetyl rifapentine and efavirenz, and slower efavirenz CL/F. Female sex but not lower BMI was also associated with higher nevirapine concentrations and slower nevirapine CL/F. As expected, CYP2B6 poor metabolizers had higher baseline concentrations of efavirenz and nevirapine [21, 23, 30–33]. Exploratory analyses involving 47 polymorphisms found no consistent associations with pharmacokinetics of rifapentine, 25-desacetyl rifapentine, efavirenz or nevirapine.
This study had limitations. We did not study the effect of NAT2 slow acetylator status on rifapentine and 25-desacetyl rifapentine in the presence of isoniazid without efavirenz or nevirapine, but we anticipate that such concentrations would be increased. Isoniazid concentrations were not quantified. The sample size for genetic association analyses was modest, limiting our ability to more thoroughly interrogate associations. For the 47 exploratory polymorphisms, some nominally significant associations may be true despite not withstanding multiple comparisons. As exploratory analyses only involved 47 selected polymorphisms, other variants may be associated with study drug pharmacokinetics. We did not genotype CYP2B6 alleles that identify rapid metabolizers (CYP2B6*4 and *22) because these are infrequent and have only modest effect on efavirenz pharmacokinetics.
This study has implications. For antiretrovirals, increased plasma exposure in NAT2 slow acetylators may increase risk for adverse events with efavirenz [21], such as central nervous system symptoms [22, 27, 28], suicidality [29], hepatic injury [51] or QT prolongation [52], and increase risk for rash with nevirapine [34]. For rifapentine, NAT2 acetylator status may increase risk for microbiologic treatment failure in rapid acetylators, or toxicities such as hypersensitivity or hepatotoxicity in slow acetylators.
In summary, among HIV-positive individuals who were receiving antiretroviral therapy including either efavirenz or nevirapine, and then initiated daily rifapentine and isoniazid in protocol A5279, NAT2 acetylator genotype was associated with interindividual differences in pharmacokinetics for rifapentine, 25-desacetyl rifapentine, efavirenz and nevirapine. CYP2B6 metabolizer genotype was also associated with interindividual pharmacokinetic differences for efavirenz, but not for rifapentine, 25-desacetyl rifapentine or nevirapine. Implications of these findings for treatment of LTBI warrant study in larger cohorts.
Supplementary Material
Acknowledgments.
We thank all the individuals living with HIV, who volunteered for ACTG protocol A5279. We thank the study participants and the staff at each of the clinical trials sites as well as the Antiviral Pharmacology Laboratory at the University of Nebraska Medical Center. We thank Laura Moran, clinical trials specialist for A5279; Ann Walawander and Jimi Tutko, data managers for A5279; and Marilyn Maroni and Sanofi Aventis. The National Institute of Allergy and Infectious Diseases (NIAID)/National Institutes of Health (NIH) also approved the design of the study. Conduct of the study was entirely the responsibility of the investigators, with regulatory oversight by the NIAID. Data collection, management, and interpretation were entirely the responsibility of the investigators. All authors had full access to all data. The corresponding author had the final responsibility to submit for publication.
Rifapentine was provided by Sanofi-Aventis (France) free of charge. Isoniazid was provided from multiple manufacturers.
The content is solely the responsibility of the authors and does not necessarily represent the official views of the NIAID or the NIH. Financial support. This work was supported by the NIAID of the NIH (AI068634, AI068636, AI106701 and AI134307). Clinical site support was provided in part by the NIAID (AI069463, AI069438, AI068632, AI069432, AI069477, AI069481 and AI069423). Additional support included AI069439, AI110527, AI077505, AI120790 (DWH).
Footnotes
Declaration of Interests:
Susan Swindells: reports research grants to her institution from ViiV Healthcare.
Richard E. Chaisson: Has consulted for Sanofi. His spouse is Merck stockholder.
Other authors have nothing to report
Contributor Information
David W. Haas, Vanderbilt University School of Medicine, Nashville, TN; Meharry Medical College, Nashville, TN
Anthony T. Podany, Antiviral Pharmacology Laboratory, UNMC Center for Drug Discovery, University of Nebraska Medical Center, Omaha
Yajing Bao, Statistical and Data Analysis Center, Harvard T.H. Chan School of Public Health, Boston, Massachusetts.
Susan Swindells, Infectious Diseases, Internal Medicine, University of Nebraska Medical Center, Omaha.
Richard E. Chaisson, Center for Tuberculosis Research, Johns Hopkins University School of Medicine, Baltimore, Maryland
Noluthando Mwelase, Helen Joseph Hospital, University of Witwatersrand University, Johannesburg, South Africa.
Khuanchai Supparatpinyo, Research Institute for Health Sciences and Faculty of Medicine, Chiang Mai University, Thailand.
Lerato Mohapi, University of the Witwatersrand and Baragwanath Hospital, Soweto, South Africa.
Amita Gupta, Center for Clinical Global Health Education, Johns Hopkins University School of Medicine, Baltimore, Maryland.
Constance A. Benson, Antiviral Research Center, University of California, San Diego
Paxton Baker, Vanderbilt University Medical Center, Nashville, TN.
Courtney V. Fletcher, Antiviral Pharmacology Laboratory, UNMC Center for Drug Discovery, University of Nebraska Medical Center, Omaha
REFERENCES
- 1.World Health Organization. Tuberculosis (TB). 2019. Available at: https://www.who.int/tb/areas-of-work/tb-hiv/en/. Accessed January 31, 2019.
- 2.Horsburgh CR Jr., Goldberg S, Bethel J, Chen S, Colson PW, Hirsch-Moverman Y, et al. Latent TB infection treatment acceptance and completion in the United States and Canada. Chest. 2010;137(2):401–9. [DOI] [PubMed] [Google Scholar]
- 3.Sterling TR, Villarino ME, Borisov AS, Shang N, Gordin F, Bliven-Sizemore E, et al. Three months of rifapentine and isoniazid for latent tuberculosis infection. The New England journal of medicine. 2011;365(23):2155–66. [DOI] [PubMed] [Google Scholar]
- 4.Martinson NA, Barnes GL, Moulton LH, Msandiwa R, Hausler H, Ram M, et al. New regimens to prevent tuberculosis in adults with HIV infection. N Engl J Med. 2011;365(1):11–20. [DOI] [PMC free article] [PubMed] [Google Scholar]
- 5.Sterling TR, Scott NA, Miro JM, Calvet G, La Rosa A, Infante R, et al. Three months of weekly rifapentine and isoniazid for treatment of Mycobacterium tuberculosis infection in HIV-coinfected persons. AIDS. 2016;30(10):1607–15. [DOI] [PMC free article] [PubMed] [Google Scholar]
- 6.Swindells S, Ramchandani R, Gupta A, Benson CA, Leon-Cruz J, Mwelase N, et al. One Month of Rifapentine plus Isoniazid to Prevent HIV-Related Tuberculosis. N Engl J Med. 2019;380(11):1001–11. [DOI] [PMC free article] [PubMed] [Google Scholar]
- 7.Ward BA, Gorski JC, Jones DR, Hall SD, Flockhart DA, Desta Z. The cytochrome P450 2B6 (CYP2B6) is the main catalyst of efavirenz primary and secondary metabolism: implication for HIV/AIDS therapy and utility of efavirenz as a substrate marker of CYP2B6 catalytic activity. J Pharmacol Exp Ther. 2003;306(1):287–300. [DOI] [PubMed] [Google Scholar]
- 8.Riska P, Lamson M, MacGregor T, Sabo J, Hattox S, Pav J, et al. Disposition and biotransformation of the antiretroviral drug nevirapine in humans. Drug Metab Dispos. 1999;27(8):895–901. [PubMed] [Google Scholar]
- 9.Williamson B, Dooley KE, Zhang Y, Back DJ, Owen A. Induction of influx and efflux transporters and cytochrome P450 3A4 in primary human hepatocytes by rifampin, rifabutin, and rifapentine. Antimicrob Agents Chemother. 2013;57(12):6366–9. [DOI] [PMC free article] [PubMed] [Google Scholar]
- 10.Podany AT, Bao Y, Swindells S, Chaisson RE, Andersen JW, Mwelase T, et al. Efavirenz Pharmacokinetics and Pharmacodynamics in HIV-Infected Persons Receiving Rifapentine and Isoniazid for Tuberculosis Prevention. Clin Infect Dis. 2015;61(8):1322–7. [DOI] [PMC free article] [PubMed] [Google Scholar]
- 11.Podany AT. Nevirapine Pharmacokinetics in HIV-infected Persons Receiving Rifapentine and Isoniazid for TB Prevention in ACTG 5279/BRIEF TB. Presented at the 11th International Workshop on Clinical Pharmacology of Tuberculosis Drugs The Hague, The Netherlands, October 23, 2018, abstract 08. 2018. [Google Scholar]
- 12.Huang YS, Chern HD, Su WJ, Wu JC, Lai SL, Yang SY, et al. Polymorphism of the N-acetyltransferase 2 gene as a susceptibility risk factor for antituberculosis drug-induced hepatitis. Hepatology. 2002;35(4):883–9. [DOI] [PubMed] [Google Scholar]
- 13.Huang YS, Chern HD, Su WJ, Wu JC, Chang SC, Chiang CH, et al. Cytochrome P450 2E1 genotype and the susceptibility to antituberculosis drug-induced hepatitis. Hepatology. 2003;37(4):924–30. [DOI] [PubMed] [Google Scholar]
- 14.Roy PD, Majumder M, Roy B. Pharmacogenomics of anti-TB drugs-related hepatotoxicity. Pharmacogenomics. 2008;9(3):311–21. [DOI] [PubMed] [Google Scholar]
- 15.Ramachandran G, Swaminathan S. Role of pharmacogenomics in the treatment of tuberculosis: a review. Pharmacogenomics and Personalized Medicine. 2012;5:89–98. [DOI] [PMC free article] [PubMed] [Google Scholar]
- 16.Sun F, Chen Y, Xiang Y, Zhan S. Drug-metabolising enzyme polymorphisms and predisposition to anti-tuberculosis drug-induced liver injury: a meta-analysis. The International Journal of Tuberculosis and Lung Disease. 2008;12(9):994–1002. [PubMed] [Google Scholar]
- 17.Wang P, Xie S, Hao Q, Zhang C, Jiang B. NAT2 polymorphisms and susceptibility to anti-tuberculosis drug-induced liver injury: a meta-analysis. The International Journal of Tuberculosis and Lung Disease. 2012;16(5):589–95. [DOI] [PubMed] [Google Scholar]
- 18.Cai Y, Yi J, Zhou C, Shen X. Pharmacogenetic study of drug-metabolising enzyme polymorphisms on the risk of anti-tuberculosis drug-induced liver injury: a meta-analysis. PloS One. 2012;7(10):e47769. [DOI] [PMC free article] [PubMed] [Google Scholar]
- 19.Goel U, Bajaj S, Gupta O, Dwivedi N, Dubey A. Isoniazid induced neuropathy in slow versus rapid acetylators: an electrophysiological study. The Journal of the Association of Physicians of India. 1992;40(10):671–2. [PubMed] [Google Scholar]
- 20.Yamamoto M, Sobue G, Mukoyama M, Matsuoka Y, Mitsuma T. Demonstration of slow acetylator genotype of N-acetyltransferase in isoniazid neuropathy using an archival hematoxylin and eosin section of a sural nerve biopsy specimen. Journal of the Neurological Sciences. 1996;135(1):51–4. [DOI] [PubMed] [Google Scholar]
- 21.Desta Z, Gammal RS, Gong L, Whirl-Carrillo M, Gaur AH, Sukasem C, et al. Clinical Pharmacogenetics Implementation Consortium (CPIC) Guideline for CYP2B6 and Efavirenz-Containing Antiretroviral Therapy. Clin Pharmacol Ther. 2019. [DOI] [PMC free article] [PubMed] [Google Scholar]
- 22.Haas DW, Ribaudo HJ, Kim RB, Tierney C, Wilkinson GR, Gulick RM, et al. Pharmacogenetics of efavirenz and central nervous system side effects: an Adult AIDS Clinical Trials Group study. AIDS. 2004;18(18):2391–400. [PubMed] [Google Scholar]
- 23.Rotger M, Colombo S, Furrer H, Bleiber G, Buclin T, Lee BL, et al. Influence of CYP2B6 polymorphism on plasma and intracellular concentrations and toxicity of efavirenz and nevirapine in HIV-infected patients. Pharmacogenet Genom. 2005;15(1):1–5. [DOI] [PubMed] [Google Scholar]
- 24.Holzinger ER, Grady B, Ritchie MD, Ribaudo HJ, Acosta EP, Morse GD, et al. Genome-wide association study of plasma efavirenz pharmacokinetics in AIDS Clinical Trials Group protocols implicates several CYP2B6 variants. Pharmacogenet Genom. 2012;22(12):858–67. [DOI] [PMC free article] [PubMed] [Google Scholar]
- 25.Wyen C, Hendra H, Vogel M, Hoffmann C, Knechten H, Brockmeyer NH, et al. Impact of CYP2B6 983T>C polymorphism on non-nucleoside reverse transcriptase inhibitor plasma concentrations in HIV-infected patients. J Antimicrob Chemo. 2008;61(4):914–8. [DOI] [PMC free article] [PubMed] [Google Scholar]
- 26.Wang J, Sonnerborg A, Rane A, Josephson F, Lundgren S, Stahle L, et al. Identification of a novel specific CYP2B6 allele in Africans causing impaired metabolism of the HIV drug efavirenz. Pharmacogenet Genom. 2006;16(3):191–8. [DOI] [PubMed] [Google Scholar]
- 27.Lubomirov R, Colombo S, di Iulio J, Ledergerber B, Martinez R, Cavassini M, et al. Association of pharmacogenetic markers with premature discontinuation of first-line anti-HIV therapy: an observational cohort study. J Infect Dis. 2011;203(2):246–57. [DOI] [PMC free article] [PubMed] [Google Scholar]
- 28.Leger P, Chirwa S, Turner M, Richardson DM, Baker P, Leonard M, et al. Pharmacogenetics of efavirenz discontinuation for reported central nervous system symptoms appears to differ by race. Pharmacogenet Genomics. 2016;26(10):473–80. [DOI] [PMC free article] [PubMed] [Google Scholar]
- 29.Mollan KR, Tierney C, Eron JJ, Hudgens M, Gulick RM, Haubrich R, et al. Composite CYP2B6/CYP2A6 genotype and risk for suicidality among HIV-infected individuals randomly assigned to initiate efavirenz-containing regimens in AIDS Clinical Trials Group studies. Presented at the 8th IAS Conference on HIV Pathogenesis, Treatment and Prevention, 19–22 July 2015, Vancouver, British Columbia, Canada (abstract TUPEB273). 2015. [Google Scholar]
- 30.Ramachandran G, Ramesh K, Hemanth Kumar AK, Jagan I, Vasantha M, Padmapriyadarsini C, et al. Association of high T allele frequency of CYP2B6 G516T polymorphism among ethnic south Indian HIV-infected patients with elevated plasma efavirenz and nevirapine. J Antimicrob Chemother. 2009;63(4):841–3. [DOI] [PubMed] [Google Scholar]
- 31.Saitoh A, Sarles E, Capparelli E, Aweeka F, Kovacs A, Burchett SK, et al. CYP2B6 genetic variants are associated with nevirapine pharmacokinetics and clinical response in HIV-1-infected children. AIDS. 2007;21(16):2191–9. [DOI] [PubMed] [Google Scholar]
- 32.Bertrand J, Chou M, Richardson DM, Verstuyft C, Leger PD, Mentre F, et al. Multiple genetic variants predict steady-state nevirapine clearance in HIV-infected Cambodians. Pharmacogenet Genom. 2012;22(12):868–76. [DOI] [PMC free article] [PubMed] [Google Scholar]
- 33.Vardhanabhuti S, Acosta EP, Ribaudo HJ, Severe P, Lalloo U, Kumarasamy N, et al. Clinical and Genetic Determinants of Plasma Nevirapine Exposure Following an Intrapartum Dose to Prevent Mother-to-Child HIV Transmission. J Infect Dis. 2013;208(4):662–71. [DOI] [PMC free article] [PubMed] [Google Scholar]
- 34.Yuan J, Guo S, Hall D, Cammett AM, Jayadev S, Distel M, et al. Toxicogenomics of nevirapine-associated cutaneous and hepatic adverse events among populations of African, Asian, and European descent. AIDS. 2011;25(10):1271–80. [DOI] [PMC free article] [PubMed] [Google Scholar]
- 35.Kwara A, Tashima KT, Dumond JB, Poethke P, Kurpewski J, Kashuba AD, et al. Modest but variable effect of rifampin on steady-state plasma pharmacokinetics of efavirenz in healthy African-American and Caucasian volunteers. Antimicrob Agents Chemother.55(7):3527–33. [DOI] [PMC free article] [PubMed] [Google Scholar]
- 36.Kwara A, Lartey M, Sagoe KW, Court MH. Paradoxically elevated efavirenz concentrations in HIV/tuberculosis-coinfected patients with CYP2B6 516TT genotype on rifampin-containing antituberculous therapy. AIDS. 2011;25(3):388–90. [DOI] [PMC free article] [PubMed] [Google Scholar]
- 37.Dooley KE, Denti P, Martinson N, Cohn S, Mashabela F, Hoffmann J, et al. Pharmacokinetics of Efavirenz and Treatment of HIV-1 Among Pregnant Women With and Without Tuberculosis Coinfection. J Infect Dis. 2015;211(2):197–205. [DOI] [PMC free article] [PubMed] [Google Scholar]
- 38.Luetkemeyer AF, Rosenkranz SL, Lu D, Grinsztejn B, Sanchez J, Ssemmanda M, et al. Combined effect of CYP2B6 and NAT2 genotype on plasma efavirenz exposure during rifampin-based antituberculosis therapy in the STRIDE study. Clin Infect Dis. 2015;60(12):1860–3. [DOI] [PMC free article] [PubMed] [Google Scholar]
- 39.di Iulio J, Fayet A, Arab-Alameddine M, Rotger M, Lubomirov R, Cavassini M, et al. In vivo analysis of efavirenz metabolism in individuals with impaired CYP2A6 function. Pharmacogenet Genom. 2009;19(4):300–9. [DOI] [PubMed] [Google Scholar]
- 40.Abel L, Fellay J, Haas DW, Schurr E, Srikrishna G, Urbanowski M, et al. Genetics of human susceptibility to active and latent tuberculosis: present knowledge and future perspectives. Lancet Infect Dis. 2018;18(3):e64–e75. [DOI] [PMC free article] [PubMed] [Google Scholar]
- 41.Dooley KE, Bliven-Sizemore EE, Weiner M, Lu Y, Nuermberger EL, Hubbard WC, et al. Safety and pharmacokinetics of escalating daily doses of the antituberculosis drug rifapentine in healthy volunteers. Clinical pharmacology and therapeutics. 2012;91(5):881–8. [DOI] [PMC free article] [PubMed] [Google Scholar]
- 42.McIlleron H, Denti P, Cohn S, Mashabela F, Hoffmann JD, Shembe S, et al. Prevention of TB using rifampicin plus isoniazid reduces nevirapine concentrations in HIV-exposed infants. J Antimicrob Chemother. 2017;72(7):2028–34. [DOI] [PMC free article] [PubMed] [Google Scholar]
- 43.Decloedt EH, Mwansa-Kambafwile J, van der Walt JS, McIlleron H, Denti P, Smith P, et al. The pharmacokinetics of nevirapine when given with isoniazid in South African HIV-infected individuals. Int J Tuberc Lung Dis. 2013;17(3):333–5. [DOI] [PMC free article] [PubMed] [Google Scholar]
- 44.Fletcher CV, Brundage RC, Fenton T, Alvero CG, Powell C, Mofenson LM, et al. Pharmacokinetics and pharmacodynamics of efavirenz and nelfinavir in HIV-infected children participating in an area-under-the-curve controlled trial. Clin Pharmacol Ther. 2008;83(2):300–6. [DOI] [PMC free article] [PubMed] [Google Scholar]
- 45.Winchester LC, Podany AT, Baldwin JS, Robbins BL, Fletcher CV. Determination of the rifamycin antibiotics rifabutin, rifampin, rifapentine and their major metabolites in human plasma via simultaneous extraction coupled with LC/MS/MS. J Pharm Biomed Anal. 2015;104:55–61. [DOI] [PMC free article] [PubMed] [Google Scholar]
- 46.D’Argenio DZ, Schumitzky A, Wang X. ADAPT 5 user’s guide: pharmacokinetic/pharmacodynamic systems analysis software. Los Angeles: Biomedical Simulations Resource; 2009. [Google Scholar]
- 47.Purcell S, Neale B, Todd-Brown K, Thomas L, Ferreira MA, Bender D, et al. PLINK: a tool set for whole-genome association and population-based linkage analyses. Am J Hum Genet. 2007;81(3):559–75. [DOI] [PMC free article] [PubMed] [Google Scholar]
- 48.Boukouvala S. Database of arylamine N-acetyltransferases (NATs). Democritus University of Thrace; 2016. Available at: http://nat.mbg.duth.gr/. Accessed February 4, 2020, 2020. [Google Scholar]
- 49.Wen X, Wang JS, Neuvonen PJ, Backman JT. Isoniazid is a mechanism-based inhibitor of cytochrome P450 1A2, 2A6, 2C19 and 3A4 isoforms in human liver microsomes. Eur J Clin Pharmacol. 2002;57(11):799–804. [DOI] [PubMed] [Google Scholar]
- 50.Aristoff PA, Garcia GA, Kirchhoff PD, Showalter HD. Rifamycins--obstacles and opportunities. Tuberculosis (Edinb). 2010;90(2):94–118. [DOI] [PubMed] [Google Scholar]
- 51.Yimer G, Amogne W, Habtewold A, Makonnen E, Ueda N, Suda A, et al. High plasma efavirenz level and CYP2B6*6 are associated with efavirenz-based HAART-induced liver injury in the treatment of naive HIV patients from Ethiopia: a prospective cohort study. The pharmacogenomics journal. 2012;12(6):499–506. [DOI] [PubMed] [Google Scholar]
- 52.Abdelhady AM, Shugg T, Thong N, Lu JB, Kreutz Y, Jaynes HA, et al. Efavirenz Inhibits the Human Ether-A-Go-Go Related Current (hERG) and Induces QT Interval Prolongation in CYP2B6*6*6 Allele Carriers. J Cardiovasc Electrophysiol. 2016;27(10):1206–13. [DOI] [PMC free article] [PubMed] [Google Scholar]
Associated Data
This section collects any data citations, data availability statements, or supplementary materials included in this article.