

Abstract
Given high rates of co-occurring conditions in youth and adults with autism spectrum disorder (ASD), it is critical to examine the developmental trajectories of these symptoms of psychopathology. Using data from a cohort of participants (n = 194), most of whom were first assessed for ASD in very early childhood, we investigated the trajectories of co-occurring depressive, anxiety, and attention-deficit hyperactivity disorder (ADHD) symptoms from late childhood to adulthood. Additionally, childhood predictors and adult outcomes associated with these symptom trajectories were examined. Using group-based trajectory modeling, we found two distinct classes of individuals exhibiting each of these co-occurring symptom patterns: one class exhibited fairly low symptoms across time, and one class with elevated symptoms with varied fluctuation across time (ADHD symptoms starting high but decreasing, anxiety symptoms high and stable, and depressive symptoms fluctuating but peaking at clinically significant levels in young adulthood). All high trajectory classes were associated with age 9 adaptive skills; verbal IQ predicted higher anxiety and depressive symptom classes. After accounting for verbal IQ, all high symptom trajectory classes were negative predictors of objective adult outcomes. These findings call for wide-ranging considerations of the needs of individuals across ability levels, autism symptoms, and behavioral and emotional challenges.
Keywords: autism, co-occurring symptoms, development, longitudinal data, outcomes, trajectories
Individuals with autism spectrum disorder (ASD) are at higher risk for developing co-occurring mental health conditions compared to the general population. Although estimates vary due to methodological differences, approximately 70% of children with ASD meet criteria for at least one co-occurring psychiatric condition (Leyfer et al., 2006; Simonoff et al., 2008). Children, adolescents, and adults with ASD are at particularly high risk for co-occurring clinical presentation of attention-deficit hyperactivity disorder (ADHD), anxiety, and depression (Kim, Szatmari, Bryson, Streiner, & Wilson, 2000; Leyfer et al., 2006; Levy et al., 2010; Simonoff et al., 2008; Strang et al., 2012). However, little is known about the developmental trajectories of clinical symptom onset from late childhood into adulthood, and early childhood factors have not been thoroughly examined to help identify individuals most at risk for developing psychopathology.
Co-occurring Psychopathology in ASD
Co-occurrence of psychiatric symptomatology is common throughout the lifespan of individuals with ASD (Croen et al., 2015; Gordon-Lipkin, Marvin, Law, & Lipkin, 2018; Lai et al., 2019; Matson & Goldin, 2013; Salazar et al., 2015; Simonoff et al., 2008; Stringer et al., 2020). This is particularly salient because the presence of co-occurring psychiatric disorders in ASD contributes to a variety of outcomes including poorer quality of life (Sikora, Vora, Coury, & Rosenberg, 2012; Vannucchi et al., 2014), greater social impairment (Chang, Quan, & Wood, 2012), and greater perceived distress (Ozsivadjian, Knott, & Magiati, 2012). Despite documented prevalence in ASD and its impact on individual functioning, little is known about the developmental trajectories of co-occurring conditions, including how co-occurring psychopathology presents across the lifespan in this population. Further, capturing ‘pure’ co-occurring disorders among those with ASD is a difficult task; differing measurement approaches, diagnostic overshadowing, and heterogeneity in clinical presentation are pervasive (Gotham, Unruh, & Lord, 2015b; Hollocks, Lerh, Magiati, Meiser-Stedman, & Brugha, 2019; Kerns et al., 2015; Rodriguez-Seijas et al., 2019; White et al., 2015).
Anxiety disorders, mood disorders, obsessive-compulsive disorder (OCD), ADHD, and oppositional defiant disorder (ODD) represent co-occurring psychopathologies most commonly associated with a diagnosis of ASD (see Rosen, Mazefsky, Vasa, & Lerner, 2018 for a comprehensive review). Studies vary widely with regards to methodology employed, including different assessment tools, age ranges captured, and cognitive abilities of the sample. Although these co-occurring psychiatric disorders align with fifth edition of Diagnostic and Statistical Manual of Mental Disorders (DSM-5) guidelines for clinical diagnosis (Lecavalier et al., 2011), subtle differences in the cognitive and behavioral symptomatic presentations are apparent in those with ASD relative to that of neurotypical peers with similar psychiatric conditions (Rosen et al., 2018). Individual factors such as age, sex, and cognitive abilities have been hypothesized to impact the differing psychiatric profiles of individuals with ASD. However, reports examining these characteristics are somewhat inconsistent in the literature (e.g., de Bruin, Ferdinand, Meester, de Nijs, & Verheij, 2007; Gadow, Devincent, Pomeroy, & Azizian, 2005; Kreiser & White, 2015; Mazza, Rossetti, Crespi, & Clerici, 2019; Salazar et al., 2015). Greater examination of large longitudinal studies of individuals with ASD has been proposed as an avenue for determining factors associated with those with co-occurring psychiatric disorders across time. One prospective study from the Special Needs and Autism Project (SNAP; Stringer et al., 2020) found high rates of psychiatric symptoms in a population-based sample of individuals with ASD examined from age 12years to 23 years. Symptoms as measured by the Strengths and Difficulties Questionnaire (SDQ; Goodman, Ford, Simmons, & Meltzer, 2000) showed a declining pattern from childhood to early adulthood. Higher adaptive functioning early on was predictive of a faster decrease in conduct and ADHD symptoms (Stringer et al., 2020). Similarly, Woodman and colleagues (2016) examined trajectories of co-occurring psychopathology among individuals with ASD on the internalizing and externalizing scales from the Child Behavior Checklist (CBCL), and found declines in symptoms from late adolescence into adulthood. The high prevalence of multiple co-occurring psychiatric disorders, and their relation to poor social-vocational outcomes, highlights the need to characterize psychopathology across the lifespan of individuals with ASD. Further, more information about the literature examining the symptom trajectories in psychiatric symptom presentation in individuals with ASD across the lifespan is critically needed to understand predictors, outcomes, and potential factors which may mitigate later risks.
ADHD is a neurodevelopmental disorder which represents impairments in attention and/or hyperactivity in a variety of contexts, beginning early in childhood (American Psychiatric Association, 2013). In typically developing individuals, core symptoms decrease from childhood into early adulthood (Spencer, Biederman, & Mick, 2007), and the rate of trajectory changes varies as a factor of type of symptoms (i.e., hyperactivity vs. impulsivity; Spencer et al., 2007). The co-occurrence of ASD and ADHD has been demonstrated in multiple studies (Lecavalier et al., 2019; Leitner, 2014; Rommelse, Franke, Geurts, Hartman, & Buitelaar, 2010; Simonoff et al., 2008; Taurines et al., 2012). Reported prevalence rates of diagnostic co-occurrence are somewhat variable, in part because only recently the DSM-5 criteria for concurrent diagnosis of the disorders were allowed (American Psychiatric Association, 2013). Recent prevalence estimates of concurrent ASD and ADHD are veiy high (i.e., 81% in a large treatment-seeking sample; Lecavalier et al., 2019). Further, the clinical impact of co-occurring ASD and ADHD appeal’s significant (Gadow, DeVincent, & Pomeroy, 2006; Zablotsky, Bramlett, & Blumberg, 2020). Individuals with ASD and co-occurring ADHD are at greater risk for concomitant anxiety and mood disorders (Gordon-Lipkin, Marvin, Law, & Lipkin, 2018; Lecavalier et al., 2019).
The prevalence of anxiety in individuals with ASD is similarly high (White, Oswald, Ollendick, & Scahill, 2009). Anxiety disorders represent a constellation of fears which are disproportionate to the threat (see Craske & Stein, 2016). In typically developing youth, the presence of an anxiety disorder is fairly stable across time. Those who are diagnosed with an anxiety disorder in childhood are at higher risk for retaining anxiety across the lifespan (Rapee, Schniering, & Hudson, 2009). For children and adolescents with ASD, prevalence rates for presence of any anxiety disorder diagnosis hovers around 40% (van Steensel, Bögels, & Perrin, 2011), making anxiety one of the most common co-occurring psychiatric conditions. These prevalence estimates remain remarkably similar in adulthood (Hollocks et al., 2019). However, symptom manifestations of the core features of ASD and anxiety are shared in a number of contexts (Wood & Gadow, 2010) and the extent to which anxiety is different in its presentation in people with ASD is not yet fully established (Kerns & Kendall, 2012; Kerns et al., 2015; Ollendick & White, 2012; White et al., 2015).
Depression is also common and clinically impairing in individuals with ASD (Kim et al., 2000; Levy et al., 2010; Leyfer et al., 2006; Strang et al., 2012). Prevalence rates of comorbid depression diagnoses and ASD range from approximately 1.4–38% (Hollocks et al., 2019; Lainhart, 1999; Magnuson & Constantino, 2011) making clinical depression one of the most common comorbidities in ASD, along with anxiety and ADHD (Gadow, Guttmann-Steinmetz, Rieffe, & DeVincent, 2012; Strang et al., 2012). Prevalence of depression in ASD is thought to be higher for those individuals with greater cognitive capacity (Magnuson & Constantino, 2011; Mayes, Calhoun, Murray, Ahuja, & Smith, 2011; Strang et al., 2012) and to follow the same developmental trajectory seen in typically developing peers. Specifically, the rates of depression in individuals with ASD appear to increase with age between childhood and adolescence (Kessler et al., 2010; Mayes et al., 2011; Stewart, Barnard, Pearson, Hasan, & O’Brien, 2006; Thapar, Collishaw, Pine, & Thapar, 2012). In previous analyses, increases in depressive symptoms across adolescence appeared to be more prominent in females with ASD compared to males (Gotham, Brunwasser, & Lord, 2015a). Further, verbal cognitive abilities were not found to be predictor of depressive symptoms as measured by the CBCL/ Adult Behavior Checklist (ABCL) measures. Still, higher depressive symptoms contribute to distinguishing poorer outcomes in adults with ASD and higher IQs (McCauley, Pickles, Huerta, & Lord, in press). For more cognitively able adolescents and adults, the most commonly endorsed items on depression measures reflected cognitive and emotional concerns, including feelings of guilt, worthlessness, failure, pessimism, and sadness (Gotham et al., 2015b).
Developmental and Theoretical Considerations
ASD is a neurodevelopmental condition in which challenges with social communication and restrictive and repetitive behaviors manifest early in development, but may not be apparent until the social demands exceed capabilities (American Psychiatric Association, 2013). ASD is a diagnosis that includes individuals with wide-ranging strengths, challenges, and behavioral profiles. Around 30% of children with ASD in the United States have co-occurring intellectual disability (Baio et al., 2018), and many, including individuals with higher IQs, experience challenges in adaptive skills relative to same-aged peers (Alvares et al., 2020). There are unique challenges, particularly with establishing peer relationships and developing adaptive skills, that individuals with ASD experience across development that likely interact with the development of mental health concerns.
In early childhood, clinical concerns revolve around communication, social and adaptive capabilities, and maladaptive behaviors associated with ASD, such as aggression, self-injurious behavior, and hyperactivity (Zwaigenbaum et al., 2015). In preschool and later school years, children with ASD often experience difficulties with forming relationships with peers, exacerbated by co-occurring hyperactivity or problems with emotion regulation (Bauminger & Kasari, 2000; Rotheram-Fuller, Kasari, Chamberlain & Locke, 2010). Adolescence may be an especially vulnerable period for individuals with ASD, given the influence of hormonal changes and increased social demands (Picci & Scherf, 2015). Early challenges experienced by younger children become more pronounced as the social environment increases in complexity and as children are expected to have more autonomy (Steinberg, 2008). Many adults with ASD live at home after high school, are not employed or in education, and face challenges establishing friendships (Howlin, Mawhood, & Rutter, 2000; Orsmond, Shattuck, Cooper, Sterzing, & Anderson, 2013; Pickles, McCauley, Pepa, Huerta, & Lord, 2020; Roux, Shattuck, Rast, & Anderson, 2017). As such, these accumulating social and adaptive difficulties may likely contribute to the unique risks of developing co-occurring psychopathology in ASD.
Conceptually, there are similarities between symptoms of autism and symptoms of co-occurring psychopathology. Specifically, there is some overlap between dimensions of hyperactivity/impulsivity and repetitive and restrictive behaviors (RRBs) in children with ADHD (Martin, Hamshere, O’Donovan, Rutter, & Thapar, 2013) and there is evidence that children with ADHD lack social awareness (Clark, Feehan, Tinline, & Vostanis, 1999). The behavioral manifestations of both anxiety disorders and autism have overlapping features, for example intense insistence on sameness or fear and avoidance to change (Wood & Gadow, 2010). However, because anxiety is not always present, features of anxiety in people with ASD are not simply a manifestation of the core symptomology of ASD (Kerns & Kendall, 2012; Renno & Wood, 2013; White et al., 2015). Finally, depressive symptoms include social isolation and withdrawal, which can be hard to distinguish from autism symptoms (e.g., Biederman et al., 2011). The conceptual overlap between symptoms of distinct forms of psychopathology and autism are likely to have reciprocal influences across development, yet there exists limited current information about how autism severity influences the risks for different symptoms of co-occurring psychopathology.
Current Aims
The aims of the current study are to: (a) describe the trajectories of co-occurring symptoms of three forms of psychopathology (ADHD, anxiety, and depression) in individuals referred for an ASD assessment at an early age, (b) identify early childhood predictors of clinical symptom trajectories, and (c) examine how symptom trajectories predict adult outcomes.
Using a longitudinal sample of individuals, most of whom who were diagnosed with ASD in early childhood, we describe these trajectories from late childhood (age 9 years) to adulthood (age 25 years). For each symptom, we hypothesize there will be one or more classes of individuals that exhibit clinically significant levels of psychopathology symptoms across time, based on the prevalence estimates of co-occurring ADHD, anxiety, and depression (although these estimates are variable). We then consider how cognitive and adaptive skills and autism symptoms at ages 2 years, 5 years, and 9 years predict membership in co-occurring trajectory classes, and we analyze symptom trajectories as predictors of global adult outcomes at age 25 years. For ADHD symptom trajectories, we hypothesize that symptom levels will abate over time similar to typically developing children (Spencer et al., 2007), and that high symptoms will be associated with childhood levels of adaptive behavior (e.g., Stringer et al., 2020). For anxiety symptoms, we expect symptoms to be stable in accordance with typical development trajectories (e.g., Rapee et al., 2009) and prevalence studies in ASD (e.g., Hollocks et al., 2019). For depressive symptoms, we hypothesize increases across adolescence in accordance with other studies on individuals with ASD (e.g., Thapar et al., 2012). We expect negative associations between verbal intellectual abilities and high levels of anxiety and depressive symptoms (e.g., Gotham et al., 2015a; White et al., 2009). Finally, we hypothesize that higher levels of psychopathology symptoms will have a negative effect on the levels of outcomes adults achieved. Altogether, we strive to increase the understanding of the development of these co-occurring conditions and their associations with autism severity, cognitive ability, and adaptive functioning across the lifespan.
Method
Participants
The current study draws from 253 individuals participating in a longitudinal study (Lord, McCauley, Pepa, Huerta, & Pickles, 2020) recruited from three sites: 213 children under age 3 years (192 were referred for possible autism to two tertiary autism programs and 21 children of the same age with non-ASD developmental delays) from North Carolina and Chicago, and 40 children from Michigan referred for possible autism at early ages who joined the study at approximately age 13 and were followed for at the same intervals as the initial recruits. Families from North Carolina and Chicago were seen for face-to-face assessments at the following time points: age 2, 3 (ASD referrals only), 5 (North Carolina only), 9, 19, and 25/26, with some young adults seen for an additional assessment at age 21 years. Families from Michigan were seen in early adolescence, and then at ages 19 and 26 years at the same intervals as the initial families. In addition to face-to-face assessments, telephone interviews and packets of questionnaires were sent to families in regular intervals starting in early adolescence (ages 12–25 years). Of the 253 participants recruited across sites, attrition occurred due to geographical relocation, unreachable status, and refusal. The current analyses consist of 194 (79% male, 21% female) participants who had data from at least one assessment after early childhood.
In the current sample, 76% of the participants were White, 21% were African American, with the remaining 3% from other racial backgrounds (Asian, Native American/Alaska Native, Biracial). 52% of primary caregivers had a college degree or more advanced degree. Of the current sample, 22% (n = 42) have never had a diagnosis of ASD after repeated assessments by our team. We refer to them collectively as Never ASD, as opposed to Ever ASD (e.g., individuals who received an ASD diagnosis at some point throughout the course of the study). The Never ASD group shares many similarities in functioning across development and in adult outcomes with the Ever ASD group (Lord et al., 2020). Of the individuals with a diagnosis of ASD, most of these individuals received a diagnosis in early childhood that has been upheld in later assessments, but approximately 10% of the sample were judged by a blinded clinician as no longer meeting clinical criteria for an autism diagnosis in adulthood.
At their most recent adult assessments, the clinical characteristics of the current sample were varied but at mean levels that typified broad impairments, including on the Adaptive Behavior Composite on the Vineland-II (VABS-II; M = 54.47, SD = 28.04), the Autism Diagnostic Observation Schedule-2 (ADOS-2; Calibrated Severity Score [CSS]: M = 5.63, SD = 2.63, Social Affect [CSS SA]: M = 5.83, SD = 2.54, Restricted and Repetitive Behaviors [CSS RRB]: M = 6.00, SD = 2.92), and the Autism Diagnostic Interview-Revised (ADI-R; Social Interaction Domain: M = 15.86, SD = 9.93, Communication Domain: M = 11.95, SD = 7.61, Restricted Repetitive Behavior Domain: M = 4.72, SD = 3.10).
Procedure
Data collection consisted of in-person assessments administered by a trained clinician, standardized questionnaires, and phone interviews of caregivers and participants. When possible, participants reported on themselves and teachers, up through high school, were asked to report on participants in addition to information gathered from caregivers. Personnel administering the test batteries were blind to information from previous assessments, including diagnosis. The research was approved by the Institutional Review Boards at the University of North Carolina, Chapel Hill, University of Chicago, University of Michigan, Cornell University, and University of California, Los Angeles.
Diagnostic measures
The ADOS-2 (Bal et al., 2019; Lord, Rutter, DiLavore, Risi, Gotham, & Bishop, 2012) was administered by an advanced graduate student, post-doctoral fellow, or clinical psychologist trained to research-reliability at each in-person assessment (ages 2, 5, 9, 18, 21, and 25 years). In addition, the ADI-R (Lord, Rutter, & Le Couteur, 1994), a standard investigator-based interview, was administered to caregivers at ages 2, 3, 5, 9, and 18 years. A best estimate autism diagnosis at each age was determined by the study team by reviewing assessments and videos. Autism severity is calculated across modules using the CSS.
Cognitive and adaptive skills measures
During each in-person assessment, verbal and non-verbal IQs (VIQ, NVIQ respectively) were determined from a hierarchy of cognitive tests. Choice of cognitive assessment was primarily determined by expressive language abilities and age (most to least difficult to complete: Wechsler Abbreviated Scale of Intelligence (Wechsler, 1999), Differential Ability Scales (Elliott, 2007), Mullen Scales of Early Learning (Mullen, 1995). Children were initially administered the test that most reflected their verbal abilities, but were given a more or less difficult assessment when basal or ceiling scores were not achieved (see also, Anderson et al., 2014). When standard scores were unable to be calculated (e.g., the score was outside the normed range or basal/ceiling limits), ratio IQs were calculated by dividing the age equivalent score by the age of the participant and multiplying by 100 (Lord et al., 2006). A best estimate of IQ was generated for each participant at each age that reflected the best quality and most age appropriate test the team could administer. Adaptive skills were assessed using the VABS-II (survey edition) at in-person visits in early childhood and in adulthood (Sparrow, Cicchetti, & Balia, 2005).
Trajectory measures
The primary measures used to calculate trajectories of co-occurring psychopathology were the CBCL (Achenbach & Rescorla, 2001) and the ABCL (Achenbach & Rescorla, 2003) once participants were 18 years old (collectively referred to as the “ASEBA” scales). These were selected for initial analysis because of their common use and standardization across the age range, despite some limitations with their use in samples of youth with ASD (e.g., Greenlee, Shui, Veenstra-VanderWeele, & Gotham, 2016). Parents reported on comorbid symptoms of psychopathology via the ASEBA at five time points: T1: Late Childhood (M = 9.36 years, range 5.67–11.83), T2: Early Adolescence (M = 14.93 years, range 13.42–15.92), T3: Late Adolescence (M = 17.40 years, range 16.00–18.67), T4: Early Adulthood (M = 20.25 years, range 19.00–22.75), T5: Adulthood (M = 25.73 years, range 23.17–30.08).
To model ADHD symptoms, we used the Attention Problems T score of the ASEBA measures. This scale comprises items that measure concentration, impulsivity, hyperactivity, and inattention. To model anxiety symptoms, we used the Anxious/Depressed T score. This scale comprises items assessing fears, nervousness, worries, guilt, and feelings of worthlessness. To model depressive symptoms, we used the Withdrawn/Depressed T score. This scale measures depressive symptoms with items such as withdrawal from activities, shyness, sadness, social isolation, and low energy. Previous analyses have found this subscale to be congruent with a depression diagnosis when a clinical interview was also used (Pandolfi, Magyar, & Norris, 2014). In samples of individuals with ASD, alpha reliability estimates for these scales are high (Attention Problems: 0.83; Anxious/Depressed: 0.94; Withdrawn/Depressed: 0.85; Pandolfi, Magyar, & Dill, 2012). In the normed sample, correlations between these scales are high for the school-aged forms (Anxious/Depressed and Withdrawn/Depressed: 0.52; Anxious/Depressed and Attention Problems: 0.39, Withdrawn/Depressed and Attention Problems: 0.40; Achenbach & Rescorla, 2001) and the adult forms (Anxious/Depressed and Withdrawn, 0.54; Anxious/Depressed and Attention Problems, 0.60; Withdrawn and Attention Problems, 0.42; Achenbach & Rescorla, 2003).
Additional psychopathology measures collected
Additional measures of psychopathology symptoms were collected at some of the same time points as the ASEBA, including the Aberrant Behavior Checklist-Community (ABC; Aman, Singh, Stewart, & Field, 1985), the Beck Depression Inventory (second edition) (BDI-II; Beck, Steer, & Brown, 1996), the Adult Manifest Anxiety Scale (AMAS; Reynolds, Richmond, & Lowe, 2003), and the Anxiety Depression and Mood Screen (ADAMS; Esbensen, Rojahn, Aman, & Ruedrich, 2003). We elected not to generate composite/summary or latent factor scores, given our focus on trajectories and the complexity of dealing with different measurements at developmental points and questions about discrepancies between raters (which also likely changes with development). As a first step, we wanted to begin with data that are relatively easily interpreted and allow simple comparisons across measures over time including childhood and early adolescence. However, in due course, latent classes (e.g., Pickles et al., 2020) are another important approach that eventually will yield additional information about our sample in adulthood.
The ABC was administered to parents at the same time points as the CBCL/ABCL, and to teachers at the same time points up to T3 (age 17 years). The ABC is a questionnaire that contains five subscales: irritability, withdrawal, stereotypy, hyperactivity and inappropriate speech. Internal consistency alpha coefficients among each subscale range from .86 to .94 (Aman et al., 1985). Further, the measure has been widely applied to autistic populations (e.g., Kaat, Lecavalier, & Aman, 2014). The current study uses the withdrawal subscale to compare means across time by depressive symptom trajectory class, and the hyperactivity subscale to compare means across time by ADHD symptom trajectory class.
The BDI-II was administered to participants and parents as informant reports starting in adolescence (T3 to T5). The BDI-II is a 21-item measure that assesses depressive symptoms in adolescents and adults. The BDI-II has adequate alpha reliability properties among individuals with a diagnosis of ASD (α = 0.87; Gotham, Unruh, & Lord, 2015b). Although normed as a self-report measure, the present study adapted the measure to achieve concurrent caregiver ratings of their son or daughter. Higher scores on the BDI-II reflect greater depressive symptom endorsement. The current study uses the self and parent report total scores from the BDI-II to compare means across time by depressive symptom trajectory class.
The AMAS was administered to participants and parents as informant reports stalling in adolescence into adulthood (T3 to T5). The AMAS measures symptoms of anxiety in adults and has adequate internal consistency (α = .90). On the AMAS, higher scores reflect greater symptomology. The current study uses the total score derived from the AMAS to compare means across time by anxiety trajectory class.
The ADAMS was administered to parents of participants who could not report for themselves in late adolescence (T3 and T4). The ADAMS is a 28-item questionnaire addressing an individual’s behavior over a six-month period. This measure was designed to assess affective behaviors in individuals with intellectual disabilities. The informant is asked to provide information for items covering the following five subscales: manic/hyperactive behavior, depressed mood, social avoidance, general anxiety, and obsessive/compulsive behavior. Psychometric properties of the scale are adequate (test–retest reliability = .80, α = .80; Esbensen et al., 2003). Although only a subset of the current participants was assessed using the ADAMS (T3 n = 45; T4 n = 60), the current study uses the depressed mood subscale and the general anxiety subscales to compare means across time by trajectory class, for less verbally fluent participants.
Adult outcomes measures
Adult outcomes were calculated separately for more (Adult VIQ ≥ 70) and less cognitively able (Adult VIQ < 70) adults using a method described in (McCauley et al., in press). Information about adult outcomes was collected through caregiver and participant interviews using the Social and Emotional Functioning Interview—Revised (SEFI-R; Rutter et al., 1988). For more cognitively able adults, positive outcomes were defined as living independently, having employment, and having at least one true friend (someone whom participants see frequently and relies on for emotional support). A count variable was created to describe how many outcomes each individual met. For less cognitively able adults, positive outcomes were defined as having at least one peer or regular nonfamilial, nonpaid acquaintance whom they enjoy seeing regularly, daily living skills above an 8-year-old level, and regular activities to do outside the house (e.g., work, volunteering). A count variable was created to describe how many outcomes each less cognitively able individual met. Adult outcome data were available for 123 adults within the current study.
Data analysis plan
Missing data
Attrition was statistically associated with having lower parent education (p < .002) and being non-white (p < .001), but not significantly associated with gender, IQ, or ASD diagnosis when first recruited. Sample size and missing data patterns across the five time points of ASEBA collection were variable, T1: n = 115; T2: n = 73; T3: n = 119; T4; n = 71; T5: n = 95. Most participants (n = 124, 66%) received two or more measurements across the five time points (Completed 1 assessment: n = 66, 34%; Completed 2 assessments: n = 40, 21%; Completed 3 assessments: n = 34, 18%; Completed 4 assessments: n = 45 (23%); Completed 5 assessments: n = 9, 5%).
Aim 1—Estimating trajectories of comorbid psychopathology in ASD
Group based trajectory modeling was performed using the traj plugin in Stata Version 16 (Jones & Nagin, 2007; 2013; Jones, Nagin, & Roeder, 2001). Group-based trajectory modeling is a type of pattern-mixture modeling in which relatively homogenous developmental trajectories are estimated. These are estimated using maximum likelihood estimation using a general quasi-Newton procedure, and missing data are handled by estimating the model using all available information.
The five time points of CBCL data collection were used as independent variables to analyze the latent grouping of individuals in their trajectories of ADHD symptoms, anxiety symptoms, and depressive symptoms. For each group of symptoms, unconditional 2-, 3-, and 4-class models were first compared using the Bayesian information criterion (BIC) and by examining the smallest group membership percentage. After the number of classes were determined, higher order effects were tested to establish whether cubic, quadratic, linear, or intercept modeling best explained variation over time. To aid in model selection, the average posterior probabilities were evaluated to determine if they met adequate model fit (above 0.70; Nagin, 2005). For each model, the best estimate of VIQ from age 9 years was included as a time-stable covariate. We then compared whether the composition of these classes differed by diagnosis (Ever or Never ASD), gender, race, and caregiver education with chi square analyses.
Aim 2—predicting trajectory class from early childhood data
We used multinomial logistic regression models to test how the characteristics of participants in early childhood distinguished the trajectory classes. For each symptom trajectory, separate models were estimated using age 2, 5, and 9-year-old data.
Aim 3—Predicting adult outcomes from trajectory classes
We conducted ordinal regressions to examine whether trajectory class probabilities were associated with the number of positive adult outcomes achieved which were defined separately for more cognitively able adults (VIQ > 70), and less cognitively able adults (VIQ < 70) as defined above. These models included interaction terms for adult ability level and trajectory class, and included age 9 VIQ, ASD diagnosis, race, caregiver education, and age 9 CSS as covariates. All analyses reported in the current paper were conducted in Stata Version 16.
Results
ADHD symptoms trajectory classes
Table 1 displays the fit statistics and smallest group percentage for each symptom trajectory. As seen in Table 1, although the BIC indicated a better fit for the 4-class model, the differences in BIC were small and the smallest group membership in the 4-class model was under 1%, so we chose the 2-class model as the best fit for ADHD symptoms trajectory classes. The groups were labeled “Low Decreasing ADHD Symptoms” (59.1% of sample, highest order function: quadratic, p = .03) and “High Decreasing ADHD Symptoms” (40.9% of the sample, highest order function: quadratic, p = .005). The average posterior probabilities were 0.87 for the Low Decreasing ADHD Symptoms and 0.84 for the High Decreasing ADHD Symptoms trajectory classes.
Table 1.
Fit statistics for different class models tested by symptom
| ADHD symptom model selection | ||
|---|---|---|
| Model | BIC | Smallest group % |
| 2-class model | −1561.43 | 40.90 |
| 3-class model | −1556.70 | 18.52 |
| 4-class model | −1556.38 | 0.67 |
| Anxiety symptom model selection | ||
| Model | BIC | Smallest group % |
| 2-class model | −1249.96 | 30.60 |
| 3-class model | −1235.61 | 1.91 |
| 4-class model | −1234.74 | 1.82 |
| Depressive symptom model selection | ||
| Model | BIC | Smallest group % |
| 2-class model | −1522.70 | 33.80 |
| 3-class model | −1510.85 | 10.82 |
| 4-class model | −1514.34 | 3.71 |
Note: Final selected models in bold
BIC: Bayesian information criteria
The Low Decreasing ADHD Symptoms class had slightly elevated levels of ADHD symptoms as defined by the ASEBA norms at T1 (Age 9, M = 59.95, SD = 7.81), with steady decreases at each time point up to T5 (age 25, M = 54.58, SD = 3.72). The High Decreasing ADHD Symptoms class had a clinically significant T score means at T1 (age 9 years, M = 75.11, SD = 8.64), and borderline means at T2 (age 14 years, M = 69.72, SD = 8.09) and T3 (age 17 years, M = 64.65, SD = 6.41), which continued to decrease by T4 (age 20 years, M = 63.54, SD = 4.24) and T5 (age 25 years, M = 61.97, SD = 5.12). These classes did not differ by ‘Ever’ or ‘Never’ diagnosis of ASD, χ2 (1) = 0.76, p = .38, gender, χ2 (1) = 3.16, p = .08, race, χ2 (4) = 2.01, p = 0.73, nor primary caregiver education levels, χ2 (4) = 6.82, p = 0.15. Supplementary Table 1 contains the counts and descriptive characteristics of early childhood data by trajectory classes. Figure 1 displays the observed means and confidence intervals of the two trajectory classes across time.
Figure 1.
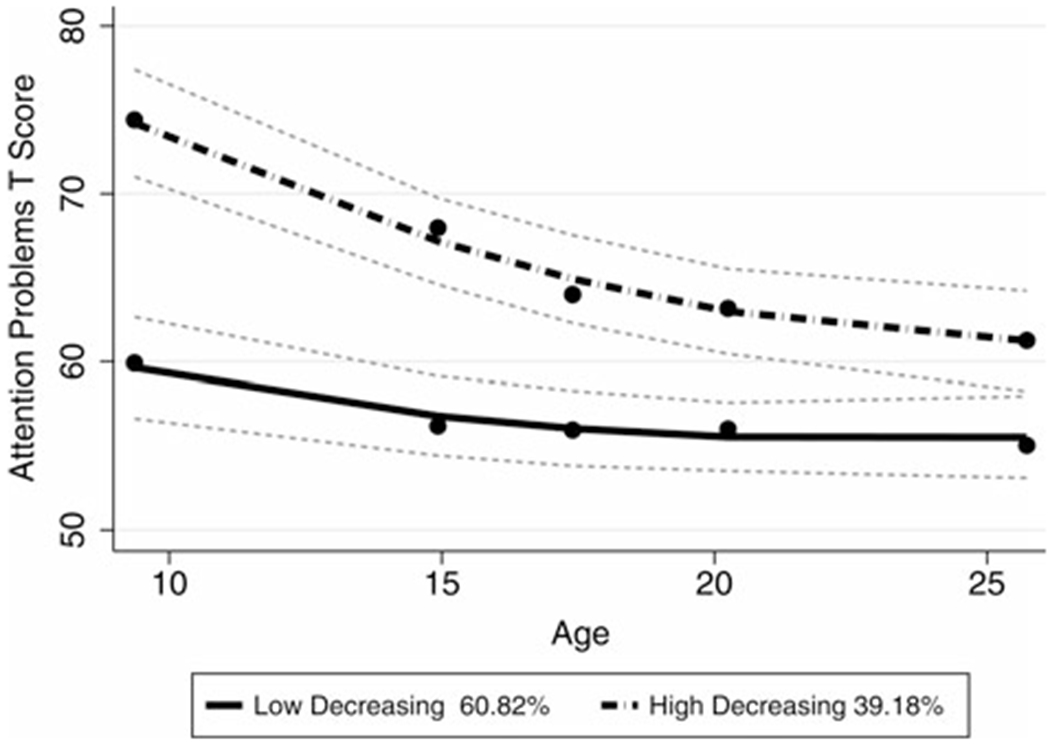
Trajectory classes derived from the attention problems symptom T score. Both groups have significant quadratic effects in the model. Dots represent observed means, lines represent estimated trajectories, and dotted lines represent the 95th confidence interval for estimated trajectories.
Convergent validity of trajectory classes with other measures of ADHD symptoms
Table 2 displays the means of hyperactivity symptoms as measured by the ABC from the current sample, indicating sample size, time point, and reporter. There were significant trajectory class differences in parent-reported hyperactivity symptoms at each time point in the same directions (decreasing) as we found for the ASEBA scale. For teacher-reported hyperactivity symptoms, the significant differences occurred only between classes at T2 (age 14).
Table 2.
Descriptive statistics for other attention-deficit/hyperactivity disorder (ADHD) measures by ADHD trajectory class
| Variable | Stable low trajectory | High decreasing trajectory | |||
|---|---|---|---|---|---|
| N | Mean (SD) | N | Mean (SD) | p value | |
| T1 ABC Hyperactivity–IR | 86 | 10.18 (8.62) | 53 | 20.46 (10.59) | .000 |
| T2 ABC Hyperactivity–IR | 92 | 6.86 (7.12) | 56 | 15.34 (7.93) | .000 |
| T3 ABC Hyperactivity–IR | 76 | 5.14 (6.85) | 53 | 13.38 (8.85) | .000 |
| T4 ABC Hyperactivity–IR | 68 | 5.01 (7.26) | 49 | 12.19 (8.62) | .000 |
| T5 ABC Hyperactivity–IR | 59 | 3.54 (4.57) | 46 | 11.43 (8.31) | .000 |
| T1 ABC Hyperactivity–TR | 56 | 11.87 (10.4) | 37 | 14.27 (9.32) | .260 |
| T2 ABC Hyperactivity–TR | 77 | 7.95 (6.43) | 49 | 14.5 (9.69) | .000 |
| T3 ABC Hyperactivity–TR | 50 | 9.7 (8.8) | 41 | 11.96 (10.69) | .271 |
| T4 ABC Hyperactivity–TR | 15 | 10.39 (8.78) | 20 | 10.74 (8.46) | .907 |
Note: ABC = Aberrant Behavior Checklist, IR = Informant report, TR = Teacher report,
Predicting high ADHD symptom trajectory class from early childhood characteristics
Multinomial logistic regression models were conducted to measure whether age 2, age 5, and age 9 characteristics predicted ADHD trajectory class membership, using the Stable Low ADHD Symptoms trajectory as the reference group. Table 3 displays the results of each model by age. At ages 2, 5, and 9 years, higher adaptive skills were significantly associated with lower odds of being in the High Decreasing ADHD Symptoms class.
Table 3.
Multinomial logistic models predicting attention-deficit/hyperactivity disorder (ADHD) symptom trajectory membership
| Class | Variable | Age 2 data (N = 151) OR (95th CI) |
Age 5 data (N = 92) OR (95th CI) |
Age 9 data (N = 142) OR (95th CI) |
|---|---|---|---|---|
| Class 1: Low decreasing | Reference group | Reference group | Reference group | |
| Class 2: High decreasing | VIQ | 1.00 (0.98–1.02) | 1.02 (0.98–1.05) | 1.02 (1.00–1.04) |
| CSS SA | 1.00 (0.83–1.20) | 0.87 (0.69–1.08) | 0.96 (0.80–1.15) | |
| CSS RRB | 0.94 (0.78–1.12) | 1.07 (0.85–1.34) | 1.12 (0.92–1.36) | |
| VABS ABC | 0.94 (0.88–0.99)* | 0.93 (0.88–0.98)* | 0.94 (0.91–0.97)*** |
Note: CSS SA = Calibrated Severity Score Social Affect; CSS RRB = Calibrated Severity Score Restricted and Repetitive Behaviors; VABS ABC = Vineland Adaptive Behavior Scale Adaptive Behavior Composite; VIQ = verbal IQ
Predicting adult outcomes from ADHD symptom trajectory class membership
An ordinal regression model was conducted to examine whether the ADHD Symptom trajectory class was associated with the number of positive outcomes adults achieved, while controlling for race, caregiver education, ASD diagnosis, CSS, and VIQ measured at age 9 years. There was a significant interaction between trajectory class and adult ability level, indicating that for more cognitively able adults in the High Decreasing ADHD Symptoms class (n = 16 in High Decreasing vs. n = 40 in Low Decreasing class), there were lower odds of achieving positive adult outcomes (B = −1.49, Odds ratio [OR] = 0.23, SE = 0.63, p = .02). For less able adults (n = 35 in High Decreasing vs. n = 32 in Low Decreasing class), membership in the High Decreasing ADHD Symptoms class was not associated with the number of adult outcomes achieved (p =.32).
Anxiety Symptoms trajectory classes
The model fit statistics indicated a 2-class model as the best fit for Anxiety symptom trajectory classes (see Table 1). The groups were labeled “Stable Low Anxiety Symptoms” (74.23% of sample, N = 144, highest order function: quadratic, p = .02) and “Stable High Anxiety Symptoms” (25.77% of the sample, N = 50, highest order function: intercept, p < .001). The average posterior probabilities were 0.84 for the Stable Low Anxiety Symptoms and 0.89 for the Stable High Anxiety Symptoms trajectory classes.
The Stable Low Anxiety Symptoms class had overall low levels of anxiety symptoms sustained throughout adolescence and early adulthood, from T1 (age 9 years, M = 51.40, SD = 3.27) to T2 (age 14 years, M = 52.29, SD = 3.59) to T3 (age 17 years, M = 53.41, SD = 4.35), and remained stable in adulthood (T4 M = 52.99, SD = 4.41; T5 M = 52.81, SD = 4.12). The Stable High Anxiety group had higher stable levels of anxiety symptoms from T1 to T5, with means that ranged from 62.95 (SD = 7.76) to 66 (SD = 8.31). These classes did not differ by Ever or Never diagnosis of ASD, χ2(1) = 0.22, p = .63, primary caregiver education, χ2(4) = 5.87, p = .21, race, χ2(4) = 3.30, p = .51, but did differ on gender, χ2(1) = 5.01, p = .03 (25% female in Stable Low vs. 10% female in Stable High class). Due to the distributions of VIQ in the classes (see Supplementary Table 1), we examined whether this relation was significant after accounting for VIQ in an analysis of covariance (ANCOVA) model, and found gender to no longer be significant, F (1, 165) = 0.11, p = .75). Figure 2 displays the two classes of anxiety symptom trajectories and their confidence intervals.
Figure 2.
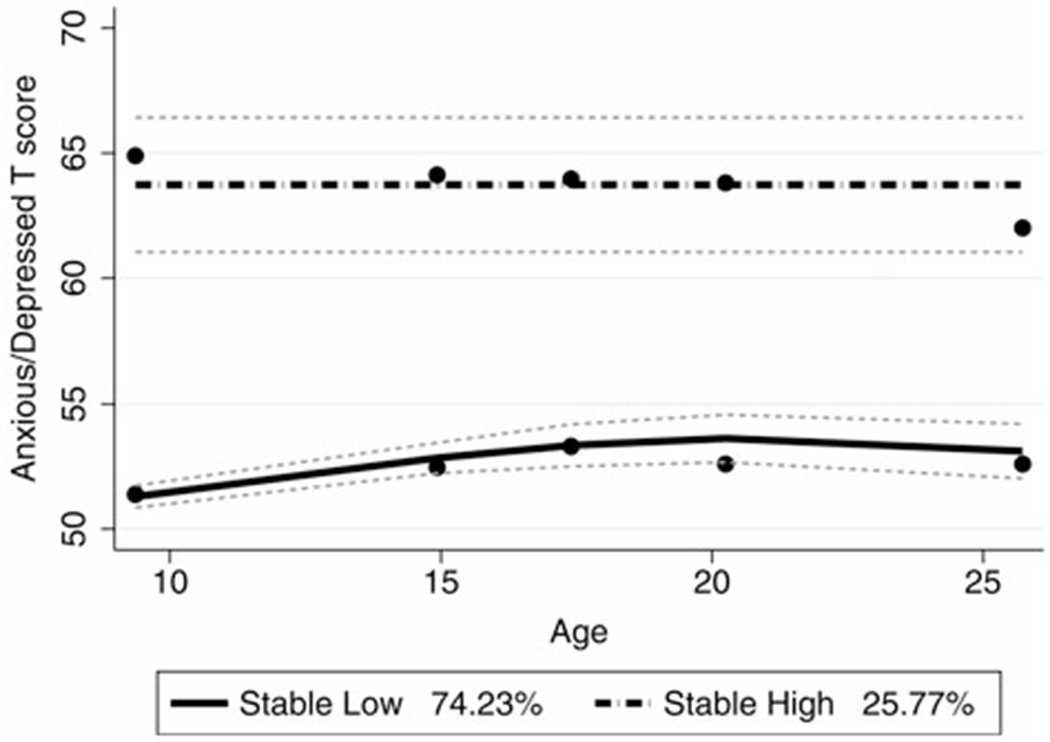
Trajectory classes derived from the anxious/depressed symptom T score. Group 1 has a significant quadratic slope, and Group 2 is an intercept model. Dots represent observed means, lines represent estimated trajectories, and dotted lines represent the 95th confidence interval for estimated trajectories.
Convergent validity of trajectory classes with other measures of anxiety symptoms
Table 4 displays the means of other measures of anxiety symptoms from the current sample, indicating sample size, time point, and reporter. Here, only parent-reported anxiety symptoms are significantly elevated in the Stable High Anxiety trajectory group compared to the Stable Low Anxiety Symptom class from late adolescence into adulthood, although trends for means on self-reported anxiety symptoms show generally similar patterns to the parent measures, especially by T5 (age 25).
Table 4.
Descriptive statistics for other anxiety measures by anxiety trajectory class
| Low increasing trajectory | High stable trajectory | ||||
|---|---|---|---|---|---|
| Variable | N | Mean (SD) | N | Mean (SD) | p value |
| T3 AMAS Total–SR | 14 | 12.88 (7.37) | 15 | 14.68 (8.01) | .54 |
| T4 AMAS Total–SR | 18 | 13.05 (6.7) | 13 | 13.27 (5.51) | .92 |
| T5 AMAS Total–SR | 13 | 13.5 (6.87) | 19 | 18.03 (7.45) | .09 |
| T3 AMAS Total–IR | 72 | 8.24 (5.31) | 23 | 17.21 (6.07) | .000 |
| T4 AMAS Total–IR | 76 | 8.98 (5.86) | 21 | 18.1 (6.45) | .000 |
| T5 AMAS Total–IR | 74 | 7.78 (4.63) | 23 | 17.87 (6.33) | .000 |
| T3 ADAMS Anxiety Symptoms–IR | 46 | 3.71 (3.08) | 2 | 2.5 (3.54) | .589 |
| T4 ADAMS Anxiety Symptoms–IR | 55 | 3.92 (4.05) | 5 | 8.6 (3.21) | .015 |
Note: AMAS = Adult Manifest Anxiety Scale, ADAMS = Anxiety Depression and Mood Screen, IR = Informant Report, SR = Self-Report
Predicting High Anxiety Symptom trajectory class from early childhood characteristics
Multinomial logistic regression models were conducted to measure whether age 2, age 5, and age 9 characteristics predicted the probability of anxiety symptom trajectory class membership, with the Stable Low Anxiety Symptom class as the reference group. Table 5 displays the results of each model by age. At ages 5 years and 9 years higher VIQ was a significant predictor of membership in the Stable High Anxiety Symptom class. At age 9 years, higher levels of adaptive skills were associated with decreased odds of being in the Stable High Anxiety Symptom class.
Table 5.
Multinomial logistic models predicting anxiety symptom trajectory membership
| Age 2 data (N = 151) | Age 5 data (N = 92) | Age 9 data (N = 142) | ||
|---|---|---|---|---|
| Class | Variable | OR (95th CI) | OR (95th CI) | OR (95th CI) |
| Class 1: Low Stable | Reference group | Reference group | Reference group | |
| Class 2: High Stable | VIQ | 1.01 (0.99–1.04) | 1.08 (1.03–1.13)** | 1.06 (1.03–1.09)*** |
| CSS SA | 1.1 (0.89–1.37) | 1.08 (0.83–1.42) | 1.09 (0.90–1.32) | |
| CSS RRB | 0.94 (0.76–1.16) | 1.23 (0.94–1.62) | 0.84 (0.69–1.02) | |
| VABS ABC | 1.04 (0.98–1.1) | 0.98 (0.93–1.04) | 0.95 (0.92–0.99)** |
Note: CSS RRB = Calibrated Severity Score Restricted and Repetitive Behaviors; CSS SA = Calibrated Severity Score Social Affect; VABS ABC = Vineland Adaptive Behavior Scale Adaptive Behavior Composite; VIQ = verbal IQ
Predicting adult outcomes from anxiety symptom trajectory class membership
An ordinal regression model was conducted to examine whether the Anxiety symptom trajectory class was associated with the number of outcomes adults achieved, while controlling for race, caregiver education, ASD diagnosis, and CSS and VIQ measured at age 9 years. There was a significant interaction between trajectory class and adult ability level, indicating that for more able adults in the Stable High Anxiety Symptom class (n = 32 in Stable High vs. n = 24 in Stable Low class), there were lower odds of achieving positive adult outcomes (B = −1.37, OR = 0.25, SE = 0.60, p = .02). For less able adults (n = 4 in Stable High vs. n = 63 in Stable Low class, membership in the Stable High Anxiety Symptom class was not associated with the number of adult outcomes achieved (p = .12).
Depressive symptoms trajectory classes
A 2-class model for depressive symptoms was the best fit. The groups were labeled “Stable Low Depressive Symptoms” (68.04% of sample, N = 132, highest order function: intercept, p < .001) and “High/Fluctuating Depressive Symptoms” (31.96% of the sample, N = 62, highest order function: cubic, p = −.03). The average posterior probabilities were 0.90 for the Stable Low Depressive Symptoms and 0.85 for the High/Fluctuating Depressive Symptoms trajectory classes.
The Stable Low Depressive Symptoms class had overall low levels of depressive symptoms throughout adolescence and early adulthood with means ranging from 54.96 (SD = 5.22) to 55.60 (SD = 5.36). The High/Fluctuating Depressive Symptoms class had stable levels of depressive symptoms from T1 (age 9 years; M = 68.45, SD = 8.02) to T2 (age 14 years; M = 64.29, SD = 5.24), increasing from T2 (age 9 years) to T3 (age 17 years; M = 67.75, SD = 7.81) and T3 to T4 (age 20 years; M = 70.21, SD = 8.31), with decreasing symptoms from T4 to T5 (age 25 years; M = 66.72, SD = 7.74). These classes did not differ by Ever or Never diagnosis of ASD, χ2 (1) = 2.73, p = .09, gender, χ2 (1) = 0.63, p = .43, race, χ2 (4) = 3.41, p = .49, nor primary caregiver education, χ2 (4) = 1.73, p = .79. Figure 3 displays the two classes of trajectories and their confidence intervals.
Figure 3.
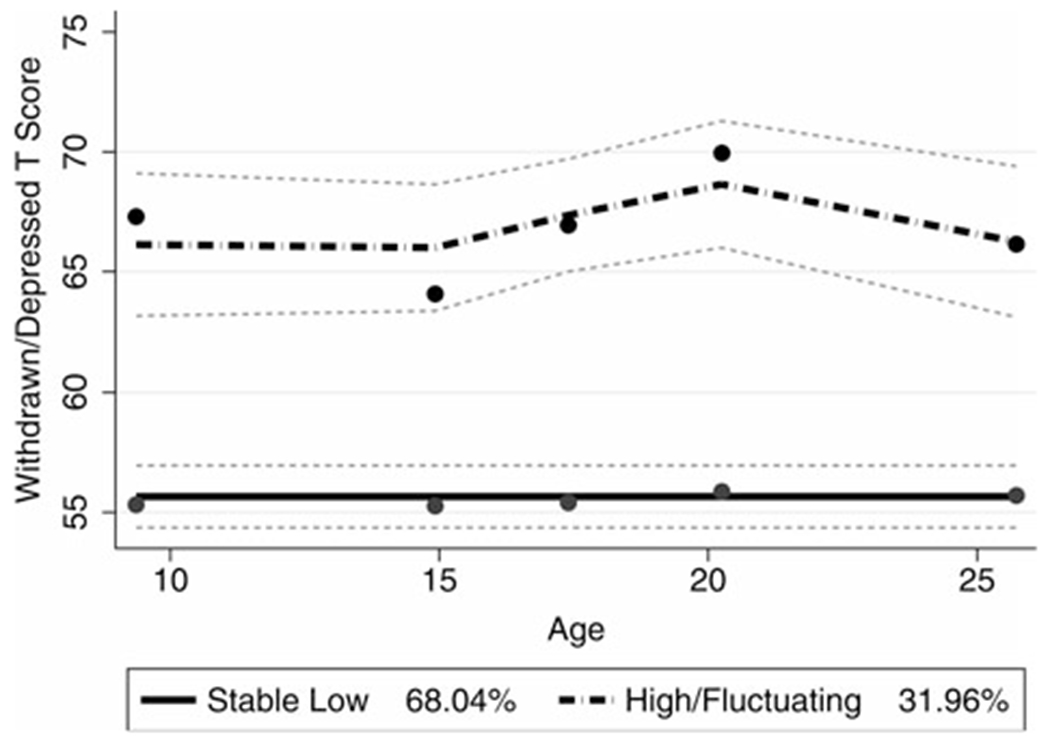
Trajectory classes derived from the withdrawn/depressed symptom T score. Group 1 is typified by a significant intercept model, Group 2 is typified by a significant cubic model. Dots represent observed means, lines represent estimated trajectories, and dotted lines represent the 95th confidence interval for estimated trajectories.
Convergent validity of trajectory classes with other measures of depressive symptoms
Table 6 displays the means of other measures of depressive symptoms from the current sample, indicating sample size, time point, and reporter. Overall, the trends across other measures of depressive symptoms show trends similar to the latent trajectories found in the group-based trajectory modeling. In addition, at least with the parent-reported ABC withdrawal, the pattern of changes across adolescence and adulthood was veiy similar to the pattern in the high trajectory from the ASEBA measures, except that they peaked in late adolescence rather than early adulthood. Individuals in the High/Fluctuating Depressive Symptoms class had significantly higher levels of depressive symptoms across other measures, with some exceptions (i.e., parent-reported BDI-II at T3 and T4, the self-reported BDI-II at T4 and T5, and the teacher-reported withdrawal scores on the ABC at T3 and T4).
Table 6.
Descriptive statistics for other depression measures by depression trajectory class
| Stable low trajectory | High trajectory | ||||
|---|---|---|---|---|---|
| Variable | N | Mean (SD) | N | Mean (SD) | p value |
| T1 ABC Withdrawal–IR | 93 | 5.66 (6.35) | 46 | 13.88 (6.98) | .000 |
| T2 ABC Withdrawal–IR | 103 | 4.75 (4.65) | 45 | 12.51 (7.65) | .000 |
| T3 ABC Withdrawal–IR | 88 | 4.65 (4.9) | 41 | 14.99 (8.99) | .000 |
| T4 ABC Withdrawal–IR | 81 | 6.07 (7.07) | 36 | 12.08 (5.94) | .000 |
| T5 ABC Withdrawal–IR | 72 | 5.98 (6.68) | 33 | 12.27 (8.78) | .000 |
| T1 ABC Withdrawal–TR | 63 | 8.79 (7.52) | 30 | 14.59 (8.96) | .002 |
| T2 ABC Withdrawal–TR | 83 | 8.64 (6.64) | 43 | 12.64 (7.44) | .003 |
| T3 ABC Withdrawal–TR | 60 | 10.9 (9.21) | 31 | 12.63 (8.83) | .392 |
| T4 ABC Withdrawal–TR | 25 | 10.6 (9.17) | 10 | 13.2 (8.08) | .439 |
| T3 BDI II- IR | 46 | 7.93 (7.36) | 18 | 8.5 (6.2) | .774 |
| T4 BDI II- IR | 36 | 5.71 (7.36) | 22 | 9.7 (8.53) | .065 |
| T5 BDI II- IR | 73 | 3.54 (4.54) | 33 | 7.31 (7.11) | .001 |
| T3 BDI II- SR | 16 | 6.95 (8.8) | 3 | 22.28 (6.29) | .011 |
| T4 BDI II- SR | 20 | 7.15 (7.74) | 14 | 9.99 (6.94) | .280 |
| T5 BDI II- SR | 21 | 9.74 (9.13) | 14 | 15.2 (10.55) | .113 |
| T3–ADAMS Depressive Symptoms–IR | 36 | 1.98 (2.55) | 12 | 3.71 (2.95) | .056 |
| T4–ADAMS Depressive Symptoms–IR | 43 | 2.12 (2.52) | 17 | 6.42 (5.62) | .000 |
Note: ADAMS = Anxiety Depression and Mood Screen; ABC = Aberrant Behavior Checklist; BDI II = Beck Depression Inventory; IR = Informant Report; TR = Teacher Report; SR = Self-Report
Predicting High Depressive Symptom trajectory class from early childhood characteristics
Multinomial logistic regression models were conducted to measure whether age 2, age 5, and age 9 characteristics predicted class membership, using the Stable Low Depressive Symptoms class as the reference group. Table 7 displays the results of each model by age. At age 2 years, none of the individual characteristics tested were significant predictors of class membership. At age 5 years, higher VIQ was associated with greater odds of being in the High/Fluctuating Depressive Symptoms class, an effect that was not significant at age 2 years or age 9 years but with similar ranges of odds ratios. At age 9 years, higher levels of autism severity-social affect (CSS SA) were associated with increased odds of being in the High/Fluctuating Depressive Symptoms trajectory class. In contrast, higher levels of adaptive skills at age 9 years were negatively associated with the odds of being in the High/Fluctuating Depressive Symptoms trajectory class.
Table 7.
Multinomial logistic models predicting depressive symptom trajectory membership
| Age 2 data (N = 151) | Age 5 data (N = 92) | Age 9 data (N = 142) | ||
|---|---|---|---|---|
| Class | Variable | OR (95th CI) | OR (95th CI) | OR (95th CI) |
| Class 1: Low Stable | Reference group | Reference group | Reference group | |
| Class 2: High Fluctuating | VIQ | 1.01 (0.99–1.04) | 1.05 (1.01–1.09)* | 1.02 (1–1.04) |
| CSS SA | 1.05 (0.87–1.27) | 1.25 (0.99–1.59) | 1.32 (1.09–1.60)** | |
| CSS RRB | 1.02 (0.85–1.23) | 1.04 (0.82–1.31) | 0.95 (0.80–1.13) | |
| VABS ABC | 0.97 (0.92–1.03) | 0.96 (0.91–1.01) | 0.97 (0.94–1.00)* |
Note: VABS ABC = Vineland Adaptive Behavior Scale Adaptive Behavior Composite
Predicting adult outcomes from depressive symptom trajectory class membership
An ordinal regression model was conducted to examine whether the probability of belonging to the High/Fluctuating Depressive Symptoms class was associated with the number of positive outcomes adults achieved, while controlling for race, caregiver education, ASD diagnosis, CSS, and VIQ measured at age 9 years. There was a significant interaction between trajectory class and adult ability level. For more cognitively able adults in the high depressive trajectory class (n = 20 in Higher/Fluctuating vs. n = 36 in Stable Low class), there were less odds of achieving positive adult outcomes (B = −1.77, OR = 0.17, SE = 0.58, p = .002). For less cognitively able adults (n = 19 in High Fluctuating vs. n = 48 in Stable Low class), the Higher/Fluctuating Depressive Symptom class was not associated with the number of adult outcomes achieved ( p = .32).
Commonalities across symptom trajectories
Table 8 displays the proportions of individuals with one or more high trajectory class in the whole sample and in the ASD ever subsample. The distributions of trajectory classes in the ASD ever subsample are reflective of the whole sample distributions, with 57% (ASD Ever) to 60% (Whole Sample) in at least one high symptom trajectory class, and 9% of the sample in all three.
Table 8.
Percentage of sample in one or more trajectory class
| N (whole sample) | % of whole sample | N (ASD Ever) | % of ASD Ever sample | |
|---|---|---|---|---|
| One high symptom trajectory (high depressive, anxiety, or ADHD symptoms) | 62 | 32% | 51 | 34% |
| High depressive and anxiety symptom trajectory | 9 | 5% | 6 | 4% |
| High depressive and ADHD symptom trajectory | 23 | 12% | 22 | 14% |
| High anxiety and ADHD symptom trajectory | 4 | 2% | 3 | 2% |
| High depressive, anxiety, and ADHD symptom trajectory | 18 | 9% | 14 | 9% |
| One or more high Symptom trajectory | 116 | 60% | 95 | 63% |
| No high symptom trajectory | 78 | 40% | 57 | 37% |
Note: ADHD = attention-deficit/hyperactivity disorder
We then examined whether the probabilities of being in the symptom trajectory classes were associated with one another using partial correlations that accounted for age 9 years VIQ. We found significant relations between the probabilities of being in the high ADHD and depressive symptom trajectories (r = .42, p < .001), between the High Decreasing ADHD and Stable High Anxiety Symptom trajectories (r = .32, p < .001) and between the High/Fluctuating Depressive and Stable High Anxiety Symptoms probabilities (r = .31, p < .001). These relations were similar without including VIQ as a covariate, except the relation between the Stable High Anxiety and High Decreasing ADHD Symptoms probabilities was no longer significant (r = .12)
Finally, we explored the possibility that baseline levels of each symptom group could influence membership in the other symptom trajectories using multinomial logistic regressions. Baseline levels of depressive symptoms (OR = 1.10, p < .001) but not anxiety symptoms (OR = 0.98, p = .41) were associated with being in the High Decreasing ADHD Symptoms class over the Stable Low ADHD Symptoms class. Neither baseline levels of depressive symptoms (OR = 1.04, p = .10) nor ADHD symptoms (OR = 1.02, p = .28) were predictive of the Stable High Anxiety Symptoms trajectory probability. Baseline levels of ADHD symptoms (OR = 1.08, p < .001) and anxiety symptoms (OR = 1.06, p = .03) were positively associated with the membership in the High/Fluctuating Depressive Symptoms class over the Stable Low Depressive Symptoms class.
Discussion
The current study documents trajectories of symptoms characteristic of ADHD, anxiety, and depression in a sample of children referred for ASD at an early age who were followed into young adulthood. Our goals were to define individuals at risk of having higher symptoms of psychopathology throughout adolescence and into adulthood, examine predictors of these risks from early childhood characteristics, and consider how having higher symptom trajectories relate to objective adult outcomes. Overall, 60% of the current sample (63% when looking at only individuals with an ASD diagnosis) belonged to one or more of the higher symptom trajectory classes, which corroborates past research looking at the prevalence of co-occurring conditions in ASD (Leyfer et al., 2006; Simonoff et al., 2008; Stringer et al., 2020). Using group-based trajectory modeling, we found two classes of each symptom trajectory that were similar in composition, one that represented overall low levels of symptoms, and one that represented more symptoms across adolescence and into adulthood. For ADHD symptoms, the higher symptom trajectory class decreased from late childhood to early adolescence, and stabilized across adolescence into adulthood. For anxiety symptoms, the higher symptom trajectory class appeared stable. For depressive symptoms, the higher symptom trajectory class fluctuated in severity, but appeared to peak during the transition to adulthood.
Higher VIQ was a predictor of higher anxiety and depressive symptom trajectory classes. This finding is consistent with past work on internalizing symptomatology in individuals with ASD (e.g., Mayes et al., 2011). This finding lends itself to a variety of interpretations. First, select symptoms of psychiatric conditions such as anxiety and depression may necessitate greater insight (including social and self-awareness; Mayes et al., 2011). This insight into potential failures to meet social demands may contribute to distress which manifests in the broad symptom classes identified by the ASEBA. Second, the effects of verbal IQ may be an artifact of measurement. Internalizing symptoms in children and adults who are minimally verbal can be difficult to assess using instruments normed for the general populations. In a recent study, individuals with cognitive impairments were most commonly diagnosed with specific phobias and separation anxiety, whereas a much wider range of anxiety disorders were found in individuals with IQs over 70 (Kerns et al., 2020). Thus, the ASEBA measures may not have been sensitive to detect the quality of anxiety in individuals with ASD and lower cognitive capacity. Indeed, the ABC subscales may better identify elevations in the behavior problems of minimally verbal autistic individuals (Fok & Bal, 2019), although we found similar stability in the withdrawal subscale as our depressive symptom trajectory analysis.
Notably, we did not find trajectory class probabilities to be influenced by gender in the current analyses. There were significantly fewer females than males in our High Stable Anxiety trajectory class, but this effect was accounted for by differences in IQ distributions. This is in contrast to an earlier report that females had greater increases in depressive and anxiety symptoms in early adulthood (Gotham et al., 2015a; Stringer et al., 2020). This discrepancy is likely reflective of differences in analytic techniques (e.g., trajectory models as opposed to generalized mixed effects models and the use of T scores over raw scores). A potential limitation in the present study is the relatively small sample of female participants. Future research should further examine the unique contributions that sex and gender may play in individuals with ASD of different cognitive abilities.
Psychopathology is a distinct and persistent challenge across development for individuals with ASD. This is evidenced from associations with early developmental factors, most notably adaptive skills. By age 9 years (age 2 years for the ADHD trajectory), early and higher adaptive skills were associated with lower odds of membership in the higher ADHD, anxiety, and depressive symptom trajectories. This finding is similar to the finding by Stringer et al. (2020) which found higher adaptive skills at age 12 to be predictive of greater declines in ADHD symptoms into young adulthood. Other studies have found similar patterns: individuals with ASD face significant challenges in adaptive skills that remain across childhood and into adulthood when compared to typically developing peers, or to cognitively matched individuals with other developmental disabilities (Lord et al., 2020; Matthews, Smith, Pollard, Ober-Reynolds, Kirwan, & Malligo, 2015; Smith, Maenner, Seltzer, 2012). For individuals with ASD, particularly individuals with higher IQ, levels of adaptive functioning fall significantly below IQ estimates (Alvares et al., 2020; Charman et al., 2011), and a recent study has found associations between the discrepancy between IQ and adaptive skills in adulthood and co-occurring anxiety and depressive symptoms (Kraper, Kenworthy, Popal, Martin, & Wallace, 2017). Adaptive functioning is a target well-suited for intervention across time, and the current evidence suggests that these skills are related to psychopathology across the lifespan, yet further examination is needed concerning the causality of these associations.
ADHD Symptom trajectories
Around 40% of our sample fell in the High Decreasing ADHD Symptoms trajectory class. This class was characterized by levels above clinical threshold in late childhood which gradually abated in adulthood. Previous studies have also described reductions in problems associated with ADHD in people with ASD (Anderson et al., 2011; Gray, Keating, Taffe, Brereton, Einfeld, & Tonge, 2012). This also mirrors the trajectory of ADHD symptoms in the general population (e.g., Döpfner et al., 2015). In previous analyses of this sample using the ABC, reductions in ADHD symptoms (hyperactivity) were associated with higher levels of VIQ (Anderson et al., 2011), but we did not find that association in our ASEBA trajectory classes.
However, despite reductions in ADHD over time, the High Decreasing ADHD Symptom class continued to have significantly more attention problems at each time point. In addition, more cognitively able adults in the higher symptom trajectory class had fewer positive adult outcomes. Greater attention problems in childhood may be a barrier to learning opportunities that can potentially cascade into difficulties for individuals to gain friends, live independently, or work independently in adulthood.
Anxiety Symptom trajectories
Around 30% of current participants had a stable trajectory of elevated anxiety symptoms, although the mean levels fell under clinical significance (T scores around 65). VIQ measured at ages 2, 5, and 9 was a positive predictor of the high anxiety symptom trajectory class, indicating that anxiety problems, at least as measured from parent-report on the CBCL, may be more pertinent for individuals with ASD and higher IQs. This corroborates past research on individuals with ASD (Hallett et al., 2013). The presentation of anxiety symptoms may indeed be different in individuals with lower IQs (especially when considering individuals with minimal language) and thus it may be difficult to assess via informant. For example, in individuals with lower IQs, anxiety may present as increased repetitive behaviors or aggressive behavior (Appleton, Roberts, & Simpson, 2019). We used one measure of anxiety specific to individuals with limited language, the ADAMS, but the number of participants in the high symptom trajectory group who completed this measure was too small for us to interpret trajectory differences.
Depressive Symptom trajectories
The current analyses revealed that over a third of individuals had a high depressive symptom trajectory, characterized by fluctuations peaking at a clinically significant level in early adulthood. It is important to note that in previous analyses of this verbally fluent subset of this sample, 14% received clinical diagnoses of major depressive disorder and that measures of depressive symptoms tended to “over-identify” clinical concerns associated with true co-occurrence (Gotham et al., 2015a). Parents report more concerns than diagnostic instruments are capturing (Gotham et al., 2015b), so these analyses could also be overestimating depressive symptoms. However, because this trajectory class was negatively associated with objective measures of adult outcomes (e.g., participation in work, independent living, and friendships) for more cognitively able individuals, elevated depressive symptoms are still of concern.
Although early childhood data did not account for much of the variation in this trajectory class probability, social affect as measured on the ADOS at age 9 years was a significant predictor of the high/fluctuating depressive symptom trajectory. Although this finding could reflect the conceptual similarities between autism symptoms and depressive symptoms as they are measured by the ASEBA, particularly social withdrawal (e.g., Biederman et al., 2011), the ADOS is clinician administered and measures qualities of interactions and not so much elements of social withdrawal. We also found that other measures of depression demonstrated similar patterns as the trajectory analyses. The trajectory classes were corroborated by parent reports of depressive symptoms across a variety of measures, including the ABC withdrawal across all time points, the BDI-II in adulthood, and for the less cognitively able subsample, the ADAMS. We also found similar differences between trajectory classes on the teacher-reported withdrawal scale on the ABC in late childhood and early adolescence. For the smaller subset of participants for which we were able to collect self-reports, trajectory class differences were not significant but were in the same direction.
The findings of depressive symptoms peaking in early adulthood and the association between trajectory class and adult outcomes warrant further examination. At least in the US, there are few supports available for individuals and families transitioning out of high school in early adulthood (Taylor & Seltzer, 2011). Adults with ASD are less likely to be working or attending higher education, to be living independently, and to have supportive friendships than typically developing adults or adults with other developmental disabilities (Orsmond, Shattuck, Cooper, Sterzing, & Anderson, 2013; Pickles et al., 2020; Wei, Wagner, Hudson, Yu, & Shattuck, 2015). Another consideration is that schooling provides individuals with predictable and stable opportunities for social interactions, and individuals with ASD may have difficulty establishing these connections without structure, contributing to heightened feelings of isolation and depressed mood. Our trajectories, particularly the increase of depressive symptoms from late adolescence into young adulthood, may be describing a potential period of vulnerability for adults, in which shifts in support and expectations could lead to heightened feelings of depressed mood or withdrawal. These trajectories also mirror what is found in typical development, with the exception that our high symptom trajectory group peaked in early adulthood and not late adolescence (e.g., Garber et al., 2002)
Commonalities among symptom trajectories
The presence of two or more co-occurring psychiatric conditions is commonly reported among individuals with ASD (e.g., Lecavalier et al., 2019). For example, children with anxiety and ASD may display more elevated depressive symptoms, such as withdrawal (Kerns et al., 2015), and higher levels of ADHD symptoms in children with ASD are related to increased rates of being diagnosed with an additional co-occurring condition, such as anxiety, mood disorder, and disruptive behavioral disorders (Mansour, Dovi, Lane, Loveland, & Pearson, 2017). In the current study, 29% of participants belonged to more than one high symptom trajectory class, but the amount of overlap was variable across conditions. There did not appear to be a distinct profile of multiple co-occurring symptoms.
The probability of being in the high depressive symptom trajectory class was positively associated with being in the high symptom ADHD and anxiety trajectory classes, indicating the possibility of some shared risk between having depressive symptoms and other co-occurring disorders. We also explored whether baseline levels of each symptom influenced the probabilities of being in other high symptom trajectory classes. We found the higher depressive symptom trajectory class to be positively associated with baseline levels of anxiety and attention problems, and the higher but decreasing ADHD trajectory class to be predicted by higher levels of withdrawn/depressed symptoms. The relation between depression and ADHD in ASD is not yet well understood, and future research should examine how these symptoms influence each other earlier in development, whether they share etiology, or perhaps whether together they represent psychopathology not well captured by the measures available.
Measurement considerations
The ASEBA trajectory classes were corroborated by other measures via parent report and teacher report, but not consistently by self-report. Specific to internalizing symptomatology, concerns have been raised about the validity of self-report by individuals with ASD, in that parent and clinician reports appear to be more often in agreement with each other than self-reports (e.g., Storch et al., 2012). In research on ASD, parents are frequent sources of information about their child’s behaviors and symptoms, but it is fair to question how accurately parents can report on their children’s internal states. Typically, although not as apparent using the BDI in these analyses, parents tend to endorse higher rates of symptoms than children (e.g., Lopata et al., 2010; Nicpon et al., 2010; White et al., 2012), but it is important to acknowledge that these reports can be distorted by parent’s own mental health concerns (Bitsika & Sharpley, 2016). Another measurement complication is the relevance of these measures to minimally verbal individuals. For example, parents may be less likely to endorse some items on the ASEBA that involve complaining if their son or daughter does not use words. Research has yet to establish best practices for how best to get information about these conditions from individuals themselves while also incorporating a diverse range of cognitive profiles.
Further compounding concerns about measurement validity, most existing measures of psychopathology—including the ASEBA—were developed, scaled, and normed for the general population. Studies have found inconsistent support for the factor structure of the syndrome scales in ASD samples across early and late childhood (e.g., Medieiros, Mazurek, & Kanne, 2017; Pandolfi et al., 2012); and some evidence suggests the specificity and sensitivity of syndrome scales are low in this population (Fok, & Bal, 2019; Hoffman et al., 2016). Nevertheless, the ASEBA is a widely used tool used in clinics for screening emotional and behavior problems and for possible autism (e.g., Havdahl et al., 2016; Mazefsky, Anderson, Connor, & Minshew, 2010).
Future studies, perhaps using larger existing datasets, should address these concerns about measurement invariance using statistical techniques designed to account for differences across reporters, measures, and time. Moderated nonlinear factor analyses offer one approach to account for differences on item functioning within and across populations, reporters, measures, and time (see Curran et al., 2014, 2020). These models could address empirical questions about how best to adjust available measurement tools to produce more robust representations of psychopathology constructs in ASD samples. However, there remains a great need of more valid and comprehensive assessments of psychopathology that better reflect the symptoms experienced of individuals with ASD across varying abilities.
Strengths and limitations
Trajectory classes are empirically derived constructs and thus may not be entirely reflective of the course of development for a co-occurring condition. Previous studies have reported concerns that the established ASEBA scales are complicated measures of psychopathology for studies of individuals with ASD, in that syndrome scales do not always directly match up with clinical diagnoses (e.g., Greenlee et al., 2016; Medeiros et al., 2017). Two scales from the ASEBA, Withdrawn/Depressed and Anxious/Depressed were used in the current study despite their conceptual overlap, yielding distinctive class memberships. One strength of the current study is that we were able to compare empirically derived ASEBA trajectory classes with other measures of symptoms and across multiple reporters. However, we did not account for the differences across raters and measures using more advanced methods, such as nonlinear factor analysis referenced above, to produce more precise estimates of psychopathology (e.g., Curran et al., 2014).
One particular limitation of measures that are normed for the general population is that they may not be as valid in other contexts or populations (see Meehl 1990). Particularly concerning are measures that assess subjective and internal symptoms in individuals who are minimally verbal or less cognitively able. For informant-reported symptoms, more visible behaviors and constructs, such as irritability as assessed by the ABC, may better capture variations in mood in minimally verbal individuals than existing measures of anxiety or depressive symptoms that reflect internal states (Fok & Bal, 2019).
Another limitation is that we do not address whether the observed stability or change in the levels of symptoms across time represents natural fluctuations in response to changes in environmental demands, the effects of services received or medications, or individual changes in coping skills. These questions are important developmental and treatment considerations.
The cohort of the current participants is small, and our sample of children diagnosed in the early 1990s is likely different than a similar sample of consecutively referred children at early ages diagnosed today due to changes in ASD awareness and treatment availability. This limits our ability to generalize these findings. However, one strength of the current study is that it consists of individuals who were referred for ASD in early childhood, rather than adolescents and adults who are recruited from clinics and are likely to be biased by current clinical concerns.
Conclusions
Variation in the trajectories of co-occurring psychopathology from late childhood into adulthood is informative to understanding the development of people with ASD. Early characteristics, particularly adaptive skills, predict trajectories of different co-occurring symptoms, and, for more cognitively able adults, predict fewer positive outcomes associated with these trajectories. We hope these patterns help contextualize changes in symptoms an individual or family may report. Developmental trajectories are a starting point in our search for mechanisms that explain changes occur across time and provide clues to how we can address them in clinical practice.
Supplementary Material
Acknowledgments.
We would like to extend our gratitude to the participants and families for the time they have given to this study, as well as all the research staff over the years. This study was funded by the National Institute of Child Health and Human Development R01 HD081199 (PI: CL), and National Institute of Mental Health R01MH081873 (PI: CL). CL acknowledges the receipt of royalties from the sale of the Autism Diagnostic Observation Schedule-2 (ADOS-2) and the Autism Diagnostic Interview-Revised (ADI-R). Royalties generated from this study were donated to a not-for-profit agency, Have Dreams. JM and RE have no potential conflicts to declare.
References
- Achenbach T, & Rescorla L (2001). Manual for the ASEBA school-age forms & profiles. Burlington: University of Vermont, Research Center for Children, Youth, & Families. [Google Scholar]
- Achenbach T, & Rescorla L (2003). Manual for the ASEBA adult forms & profiles. Burlington: University of Vermont, Research Center for Children, Youth, & Families. [Google Scholar]
- Alvares GA, Bebbington K, Cleary D, Evans K, Glasson EJ, Maybery MT, … Whitehouse AJ. (2020). The misnomer of ‘high functioning autism’: Intelligence is an imprecise predictor of functional abilities at diagnosis. Autism, 24, 221–232. [DOI] [PubMed] [Google Scholar]
- Aman MG, Singh NN, Stewart AW, & Field CJ (1985). The aberrant behavior checklist: a behavior rating scale for the assessment of treatment effects. American Journal of Mental Deficiency, 89, 485–491. [PubMed] [Google Scholar]
- American Psychiatric Association. (2013). Diagnostic and statistical manual of mental disorders (DSM-5*). American Psychiatric Pub. [Google Scholar]
- Anderson DK, Maye MP, & Lord C (2011). Changes in maladaptive behaviors from midchildhood to young adulthood in autism spectrum disorder. American Journal on Intellectual and Developmental Disabilities, 116, 381–397. [DOI] [PMC free article] [PubMed] [Google Scholar]
- Anderson KA, Shattuck PT, Cooper BP, Roux AM, & Wagner M (2014). Prevalence and correlates of postsecondary residential status among young adults with an autism spectrum disorder. Autism, 18, 562–570. [DOI] [PMC free article] [PubMed] [Google Scholar]
- Appleton EL, Roberts J, & Simpson K (2019). How is anxiety identified and diagnosed in individuals with autism spectrum disorder and intellectual disability? A scoping review. Journal of Mental Health Research in Intellectual Disabilities, 1–24. [Google Scholar]
- Baio J, Wiggins L, Christensen DL, Maenner MJ, Daniels J, Warren Z, … Dowling NF. (2018). Prevalence of autism spectrum disorder among children aged 8 years—autism and developmental disabilities monitoring network, 11 sites, United States, 2014 Morbidity and Mortality Weekly Report. Surveillance Summaries (Washington, D.C.: 2002), 67, 1–23. 10.15585/mmwr.ss6706a1 [DOI] [PMC free article] [PubMed] [Google Scholar]
- Bal VH, Kim SH, Cheong D, & Lord C (2015). Daily living skills in individuals with autism spectrum disorder from 2 to 21 years of age. Autism, 19, 774–784. [DOI] [PMC free article] [PubMed] [Google Scholar]
- Bal VH, Maye M, Salzman E, Huerta M, Pepa L, Risi S, & Lord C (2019). The adapted ADOS: A new module set for the assessment of minimally verbal adolescents and adults. Journal of Autism and Developmental Disorders, 1–11. [DOI] [PMC free article] [PubMed] [Google Scholar]
- Bauminger N, & Kasari C (2000). Loneliness and friendship in high-functioning children with autism. Child Development, 71, 447–456. [DOI] [PubMed] [Google Scholar]
- Beck AT, Steer RA, & Brown GK (1996). Manual for the Beck Depression Inventory-II. San Antonio, TX: Psychological Corporation. [Google Scholar]
- Biederman J, Petty CR, Clarke A, Lomedico A, & Faraone SV (2011). Predictors of persistent ADHD: an 11-year follow-up study. Journal of Psychiatric Research, 45, 150–155. [DOI] [PMC free article] [PubMed] [Google Scholar]
- Bitsika V, & Sharpley CF (2016). Mothers’ depressive state ‘distorts’ the ratings of depression they give for their sons with an autism spectrum disorder. International Journal of Disability, Development and Education, 63, 491–499. [Google Scholar]
- Chang YC, Quan J, & Wood JJ (2012). Effects of anxiety disorder severity on social functioning in children with autism spectrum disorders. Journal of Developmental and Physical Disabilities, 24, 235–245. [Google Scholar]
- Charman T, Jones CR, Pickles A, Simonoff E, Baird G, & Happé F (2011). Defining the cognitive phenotype of autism. Brain Research, 1380, 10–21. [DOI] [PubMed] [Google Scholar]
- Clark T, Feehan C, Tinline C, & Vostanis P (1999). Autistic symptoms in children with attention deficit-hyperactivity disorder. European Child & Adolescent Psychiatry, 8, 50–55. [DOI] [PubMed] [Google Scholar]
- Craske MG, & Stein MB (2016). Anxiety. Lancet, 388, 3048–3059. doi: 10.1016/S0140-6736(16)30381-6 [DOI] [PubMed] [Google Scholar]
- Croen LA, Zerbo O, Qian Y, Massolo ML, Rich S, Sidney S, & Kripke C (2015). The health status of adults on the autism spectrum. Autism, 19, 814–823. [DOI] [PubMed] [Google Scholar]
- Curran PJ, Georgeson AR, Bauer DJ, & Hussong AM (2020). Psychometric models for scoring multiple reporter assessments: Applications to integrative data analysis in prevention science and beyond. International Journal of Behavioral Development, 10.1177/0165025419896620 [DOI] [PMC free article] [PubMed] [Google Scholar]
- Curran PJ, Mcginley JS, Bauer DJ, Andrea M, Burns A, Chassin L, & Sher K (2014). A moderated nonlinear factor model for the development of commensurate measures in integrative data analysis. Multivariate Behavioral Research, 49, 214–231. [DOI] [PMC free article] [PubMed] [Google Scholar]
- De Bruin EI, Ferdinand RF, Meester S, De Nijs PFA, & Verheij F (2007). High rates of psychiatric co-morbidity in PDD-NOS. Journal of Autism and Developmental Disorders, 37, 877–886. 10.1007/s10803-006-0215-x [DOI] [PubMed] [Google Scholar]
- Döpfner M, Hautmann C, Górtz-Dorten A, Klasen F, Ravens-Sieberer U, & Study Group, B. E. L. L. A. (2015). Long-term course of ADHD symptoms from childhood to early adulthood in a community sample. European Child & Adolescent Psychiatry, 24, 665–673. [DOI] [PubMed] [Google Scholar]
- Elliott CD (2007). Differential Ability Scales (2nd ed.). San Antonio, TX: Harcourt Assessment. [Google Scholar]
- Esbensen AJ, Rojahn J, Aman MG, & Ruedrich S (2003). Reliability and validity of an assessment instrument for anxiety, depression, and mood among individuals with mental retardation. Journal of Autism and Developmental Disorders, 33, 617–629. [DOI] [PubMed] [Google Scholar]
- Fok M, & Bal VH (2019). Differences in profiles of emotional behavioral problems across instruments in verbal versus minimally verbal children with autism spectrum disorder. Autism Research, 12, 1367–1375. doi: 10.1002/aur.2126 [DOI] [PMC free article] [PubMed] [Google Scholar]
- Gadow KD, Devincent CJ, Pomeroy J, & Azizian A (2005). Comparison of DSM-IV symptoms in elementary school-age children with PDD versus clinic and community samples. Autism, 9, 392–415. 10.1177/1362361305056079 [DOI] [PubMed] [Google Scholar]
- Gadow KD, DeVincent CJ, & Pomeroy J (2006). ADHD symptom subtypes in children with pervasive developmental disorder. Journal of Autism and Developmental Disorders, 36, 271–283. [DOI] [PubMed] [Google Scholar]
- Gadow KD, Guttmann-Steinmetz S, Rieffe C, & DeVincent CJ (2012). Depression symptoms in boys with autism spectrum disorder and comparison samples. Journal of Autism and Developmental Disorders, 42, 1353–1363. [DOI] [PubMed] [Google Scholar]
- Garber J, Keiley MK, & Martin NC (2002). Developmental trajectories of adolescents’ depressive symptoms: predictors of change. Journal of Consulting and Clinical Psychology, 70, 79–95. [DOI] [PubMed] [Google Scholar]
- Goodman R, Ford T, Simmons H, Gatward R, & Meltzer H (2000). Using the Strengths and Difficulties Questionnaire (SDQ) to screen for child psychiatric disorders in a community sample. The British Journal of Psychiatry: The Journal of Mental Science, 177, 534–539. 10.1192/bjp.177.6.534 [DOI] [PubMed] [Google Scholar]
- Gordon-Lipkin E, Marvin AR, Law JK, & Lipkin PH (2018). Anxiety and mood disorder in children with autism spectrum disorder and ADHD. Pediatrics, 141, e20171377. [DOI] [PubMed] [Google Scholar]
- Gotham K, Brunwasser SM, & Lord C (2015a). Depressive and anxiety symptom trajectories from school age through young adulthood in samples with autism spectrum disorder and developmental delay. Journal of the American Academy of Child & Adolescent Psychiatry, 54, 369–376. [DOI] [PMC free article] [PubMed] [Google Scholar]
- Gotham K, Unruh K, & Lord C (2015b). Depression and its measurement in verbal adolescents and adults with autism spectrum disorder. Autism, 19, 491–504. [DOI] [PMC free article] [PubMed] [Google Scholar]
- Gray K, Keating C, Taffe J, Brereton A, Einfeld S, & Tonge B (2012). Trajectory of behavior and emotional problems in autism. American Journal on Intellectual and Developmental Disabilities, 117, 121–133. [DOI] [PubMed] [Google Scholar]
- Greenlee JL, Mosley AS, Shui AM, Veenstra-VanderWeele J, & Gotham KO (2016). Medical and behavioral correlates of depression history in children and adolescents with autism spectrum disorder. Pediatrics, 137, S105–S114. [DOI] [PMC free article] [PubMed] [Google Scholar]
- Hallett V, Lecavalier L, Sukhodolsky DG, Cipriano N, Aman MG, McCracken JT, … Sikich L. (2013). Exploring the manifestations of anxiety in children with autism spectrum disorders. Journal of Autism and Developmental Disorders, 43, 2341–2352. [DOI] [PMC free article] [PubMed] [Google Scholar]
- Havdahl KA, von Tetzchner S, Huerta M, Lord C, & Bishop SL (2016). Utility of the child behavior checklist as a screener for autism spectrum disorder. Autism Research, 9, 33–42. [DOI] [PMC free article] [PubMed] [Google Scholar]
- Hoffmann W, Weber L, König U, Becker K, & Kamp-Becker I (2016). The role of the CBCL in the assessment of autism spectrum disorders: An evaluation of symptom profiles and screening characteristics. Research in Autism Spectrum Disorders, 27, 44–53. [Google Scholar]
- Hollocks MJ, Lerh JW, Magiati I, Meiser-Stedman R, & Brugha TS (2019). Anxiety and depression in adults with autism spectrum disorder: a systematic review and meta analysis. Psychological Medicine, 49, 559–572. [DOI] [PubMed] [Google Scholar]
- Howlin P, Mawhood L, & Rutter M (2000). Autism and developmental receptive language disorder—A follow-up comparison in early adult life. II: Social, behavioural, and psychiatric outcomes. The Journal of Child Psychology and Psychiatry and Allied Disciplines, 41, 561–578. [DOI] [PubMed] [Google Scholar]
- Jones BL, & Nagin DS (2007). Advances in group-based trajectory modeling and an SAS procedure for estimating them. Sociological Methods & Research, 35, 542–571. [Google Scholar]
- Jones BL, & Nagin DS (2013). A note on a Stata plugin for estimating group-based trajectory models. Sociological Methods & Research, 42, 608–613. [Google Scholar]
- Jones BL, Nagin DS, & Roeder K (2001). A SAS procedure based on mixture models for estimating developmental trajectories. Sociological Methods & Research, 29, 374–393. [Google Scholar]
- Kaat AJ, Lecavalier L, & Aman MG (2014). Validity of the aberrant behavior checklist in children with autism spectrum disorder. Journal of Autism and Developmental Disorders, 44, 1103–1116. [DOI] [PubMed] [Google Scholar]
- Kerns CM, & Kendall PC (2012). The presentation and classification of anxiety in autism spectrum disorder. Clinical Psychology: Science and Practice, 19, 323–347. [Google Scholar]
- Kerns CM, Kendall PC, Zickgraf H, Franklin ME, Miller J, & Herrington J (2015). Not to be overshadowed or overlooked: Functional impairments associated with comorbid anxiety disorders in youth with ASD. Behavior Therapy, 46, 29–39. [DOI] [PubMed] [Google Scholar]
- Kerns CM, Winder-Patel B, Iosif AM, Nordahl CW, Heath B, Solomon M, & Amaral DG (2020). Clinically significant anxiety in children with autism spectrum disorder and varied intellectual functioning. Journal of Clinical Child & Adolescent Psychology, 1–16. DOI: 10.1080/15374416.2019.1703712 [DOI] [PMC free article] [PubMed] [Google Scholar]
- Kim JA, Szatmari P, Bryson SE, Streiner DL, & Wilson FJ (2000). The prevalence of anxiety and mood problems among children with autism and Asperger syndrome. Autism, 4, 117–132. [Google Scholar]
- Kraper CK, Kenworthy L, Popal H, Martin A, & Wallace GL (2017). The gap between adaptive behavior and intelligence in autism persists into young adulthood and is linked to psychiatric co-morbidities. Journal of Autism and Developmental Disorders, 47, 3007–3017. [DOI] [PubMed] [Google Scholar]
- Kreiser NL, & White SW (2015). ASD traits and co-occurring psychopathology: The moderating role of gender. Journal of Autism and Developmental Disorders, 45, 3932–3938. [DOI] [PubMed] [Google Scholar]
- Lai MC, Kassee C, Besney R, Bonato S, Hull L, Mandy W, … Ameis SH. (2019). Prevalence of co-occurring mental health diagnoses in the autism population: a systematic review and meta-analysis. The Lancet Psychiatry, 6, 819–829. [DOI] [PubMed] [Google Scholar]
- Lainhart JE (1999). Psychiatric problems in individuals with autism, their parents and siblings. International Review of Psychiatry, 11, 278–298. [Google Scholar]
- Lecavalier L, Gadow KD, Devincent CJ, Houts CR, & Edwards MC (2011). Validity of DSM-IV syndromes in preschoolers with autism spectrum disorders. Autism, 15, 527–543. [DOI] [PubMed] [Google Scholar]
- Lecavalier L, McCracken CE, Aman MG, McDougle CJ, McCracken JT, Tierney E, … Swiezy NB. (2019). An exploration of concomitant psychiatric disorders in children with autism spectrum disorder. Comprehensive Psychiatry, 88, 57–64. [DOI] [PMC free article] [PubMed] [Google Scholar]
- Leitner Y (2014). The co-occurrence of autism and attention deficit hyperactivity disorder in children-what do we know? Frontiers in Human Neuroscience, 8, 268. [DOI] [PMC free article] [PubMed] [Google Scholar]
- Levy SE, Giarelli E, Lee LC, Schieve LA, Kirby RS, Cunniff C, … Rice CE. (2010). Autism spectrum disorder and co-occurring developmental, psychiatric, and medical conditions among children in multiple populations of the United States. Journal of Developmental & Behavioral Pediatrics, 31, 267–275. [DOI] [PubMed] [Google Scholar]
- Leyfer OT, Folstein SE, Bacalman S, Davis NO, Dinh E, Morgan J, … Lainhart JE. (2006). Comorbid psychiatric disorders in children with autism: interview development and rates of disorders. Journal of Autism and Developmental Disorders, 36, 849–861. [DOI] [PubMed] [Google Scholar]
- Lopata C, Thomeer ML, Volker MA, Toomey JA, Nida RE, Lee GK, … Rodgers JD. (2010). RCT of a manualized social treatment for high-functioning autism spectrum disorders. Journal of Autism and Developmental Disorders, 40, 1297–1310. [DOI] [PubMed] [Google Scholar]
- Lord C, McCauley JB, Pepa LA, Huerta M, & Pickles A (2020). Work, living, and the pursuit of happiness: Vocational and psychosocial outcomes for young adults with autism. Autism, 10.1177/1362361320919246 [DOI] [PMC free article] [PubMed] [Google Scholar]
- Lord C, Risi S, DiLavore PS, Shulman C, Thurm A, & Pickles A (2006). Autism from 2 to 9 years of age. Archives of General Psychiatry, 63, 694–701. 10.1001/archpsyc.63.6.694 [DOI] [PubMed] [Google Scholar]
- Lord C, Rutter M, DiLavore P, Risi S, Gotham K, & Bishop S (2012). Autism diagnostic observation schedule-2nd edition (ADOS-2). Los Angeles, CA: Western Psychological Corporation. [Google Scholar]
- Lord C, Rutter M, & Le Couteur A (1994). Autism Diagnostic Interview-Revised: A revised version of a diagnostic interview for caregivers of individuals with possible pervasive developmental disorders. Journal of Autism and Developmental Disorders, 24, 659–685. 10.1007/BF02172145 [DOI] [PubMed] [Google Scholar]
- Magnuson KM, & Constantino JN (2011). Characterization of depression in children with autism spectrum disorders. Journal of Developmental and Behavioral Pediatrics: JDBP, 32, 332. [DOI] [PMC free article] [PubMed] [Google Scholar]
- Mansour R, Dovi AT, Lane DM, Loveland KA, & Pearson DA (2017). ADHD severity as it relates to comorbid psychiatric symptomatology in children with Autism Spectrum Disorders (ASD). Research in Developmental Disabilities, 60, 52–64. [DOI] [PMC free article] [PubMed] [Google Scholar]
- Matson JL, & Goldin RL (2013). Comorbidity and autism: Trends, topics and future directions. Research in Autism Spectrum Disorders, 7, 1228–1233. [Google Scholar]
- Matthews NL, Smith CJ, Pollard E, Ober-Reynolds S, Kirwan J, & Malligo A (2015). Adaptive functioning in autism spectrum disorder during the transition to adulthood. Journal of Autism and Developmental Disorders, 45, 2349–2360. [DOI] [PubMed] [Google Scholar]
- Mayes SD, Calhoun SL, Murray MJ, Ahuja M, & Smith LA (2011). Anxiety, depression, and irritability in children with autism relative to other neuropsychiatric disorders and typical development. Research in Autism Spectrum Disorders, 5, 474–485. [Google Scholar]
- Mazefsky CA, Anderson R, Conner CM, & Minshew N (2011). Child Behavior Checklist scores for school-aged children with autism: Preliminary evidence of patterns suggesting the need for referral. Journal of Psychopathology and Behavioral Assessment, 33, 31–37. [DOI] [PMC free article] [PubMed] [Google Scholar]
- Mazza MG, Rossetti A, Crespi G, & Clerici M (2019). Prevalence of co-occurring psychiatric disorders in adults and adolescents with intellectual disability: A systematic review and meta-analysis. Journal of Applied Research in Intellectual Disabilities. [DOI] [PubMed] [Google Scholar]
- McCauley JB, Pickles AP, Huerta MH, & Lord C (in press). Defining positive outcomes in more and less cognitively able autistic adults. Autism Research. [DOI] [PubMed] [Google Scholar]
- Medeiros K, Mazurek MO, & Kanne S (2017). Investigating the factor structure of the Child Behavior Checklist in a large sample of children with autism spectrum disorder. Research in Autism Spectrum Disorders, 40, 24–40. [Google Scholar]
- Meehl PE (1990). Why summaries of research on psychological theories are often uninterpretable. Psychological Reports, 66, 195–244. [Google Scholar]
- Mullen EM (1995). Mullen scales of early learning. San Antonio, TX: Pearson. [Google Scholar]
- Nagin DS (2005). Group-based modeling of development. Cambridge, MA: Harvard University Press. [Google Scholar]
- Nicpon MF, Doobay AF, & Assouline SG (2010). Parent, teacher, and self perceptions of psychosocial functioning in intellectually gifted children and adolescents with autism spectrum disorder. Journal of Autism and Developmental Disorders, 40, 1028–1038. [DOI] [PubMed] [Google Scholar]
- Ollendick TH, & White SW (2012). The presentation and classification of anxiety in autism spectrum disorder: Where to from here? Clinical Psychology: Science and Practice, 19, 352–355. 10.1111/cpsp.12009 [DOI] [Google Scholar]
- Orsmond GI, Shattuck PT, Cooper BP, Sterzing PR, & Anderson KA (2013). Social participation among young adults with an autism spectrum disorder. Journal of Autism and Developmental Disorders, 43, 2710–2719. [DOI] [PMC free article] [PubMed] [Google Scholar]
- Ozsivadjian A, Knott F, & Magiati I (2012). Parent and child perspectives on the nature of anxiety in children and young people with autism spectrum disorders: a focus group study. Autism, 16, 107–121. [DOI] [PubMed] [Google Scholar]
- Pandolfi V, Magyar CI, & Dill CA (2012). An initial psychometric evaluation of the CBCL 6–18 in a sample of youth with autism spectrum disorders. Research in Autism Spectrum Disorders, 6, 96–108. [DOI] [PMC free article] [PubMed] [Google Scholar]
- Pandolfi V, Magyar CI, & Norris M (2014). Validity study of the CBCL 6–18 for the assessment of emotional problems in youth with ASD. Journal of Mental Health Research in Intellectual Disabilities, 7, 306–322. [DOI] [PMC free article] [PubMed] [Google Scholar]
- Picci G, & Scherf KS (2015). A two-hit model of autism: Adolescence as the second hit. Clinical Psychological Science, 3, 349–371. [DOI] [PMC free article] [PubMed] [Google Scholar]
- Pickles A, McCauley JB, Pepa LA, Huerta M, & Lord C (2020). The adult outcome of children referred for autism: Typology and prediction from childhood. Journal of Child Psychology and Psychiatry, doi: 10.1111/jcpp.13180. [DOI] [PMC free article] [PubMed] [Google Scholar]
- Rapee RM, Schniering CA, & Hudson JL (2009). Anxiety disorders during childhood and adolescence: Origins and treatment. Annual Review of Clinical Psychology, 5, 311–341. 10.1146/annurev.clinpsy.032408.153628 [DOI] [PubMed] [Google Scholar]
- Renno P, & Wood JJ (2013). Discriminant and convergent validity of the anxiety construct in children with autism spectrum disorders. Journal of Autism and Developmental Disorders, 43, 2135–2146. [DOI] [PMC free article] [PubMed] [Google Scholar]
- Reynolds CR, Richmond BO, & Lowe PA (2003). The adult manifest anxiety scale adult version (AMAS-A). Los Angeles: Western Psychological Services. [Google Scholar]
- Rodriguez-Seijas C, Gadow KD, Rosen TE, Kim H, Lerner MD, & Eaton NR (2019). A transdiagnostic model of psychiatric symptom co-occurrence and autism spectrum disorder. Autism Research, 13, 579–590. [DOI] [PubMed] [Google Scholar]
- Rommelse NNJ, Franke B, Geurts HM, Hartman CA, & Buitelaar JK (2010). Shared heritability of attention-deficit/hyperactivity disorder and autism spectrum disorder. European Child and Adolescent Psychiatry, 19, 281–295. 10.1007/s00787-010-0092-x [DOI] [PMC free article] [PubMed] [Google Scholar]
- Rosen TE, Mazefsky CA, Vasa RA, & Lerner MD (2018). Co-occurring psychiatric conditions in autism spectrum disorder. International Review of Psychiatry, 30, 40–61. [DOI] [PubMed] [Google Scholar]
- Rotheram-Fuller E, Kasari C, Chamberlain B, & Locke J (2010). Social involvement of children with autism spectrum disorders in elementary school classrooms. Journal of Child Psychology and Psychiatry, and Allied Disciplines, 51, 1227–1234. 10.1111/j.1469-7610.2010.02289.x [DOI] [PMC free article] [PubMed] [Google Scholar]
- Roux A, Shattuck P, Rast J, & Anderson K (2017). National autism indicators report: Developmental disability services and outcomes in adulthood. Philadelphia, PA: AJ Drexel Autism Institute, Drexel University. [Google Scholar]
- Rutter M, LeCouteur A, Lord C, Macdonald H, Rios P, & Folstein S (1988). Diagnosis and subclassification of autism: Concepts and instrument development In Schopler E, & Mesibov G (Eds.) Diagnosis and subclassification of autism: Concepts and instrument development (pp. 239–259). New York: Plenum, 10.1007/978-1-4899-0792-9_16. [DOI] [Google Scholar]
- Salazar F, Baird G, Chandler S, Tseng E, O’sullivan T, Howlin P, … Simon off E (2015). Co-occurring psychiatric disorders in preschool and elementary school-aged children with autism spectrum disorder. Journal of Autism and Developmental Disorders, 45, 2283–2294. [DOI] [PubMed] [Google Scholar]
- Sikora DM, Vora P, Coury DL, & Rosenberg D (2012). Attention-deficit/hyperactivity disorder symptoms, adaptive functioning, and quality of life in children with autism spectrum disorder. Pediatrics, 130, S91–S97. [DOI] [PubMed] [Google Scholar]
- Simonoff E, Pickles A, Charman T, Chandler S, Loucas T, & Baird G (2008). Psychiatric disorders in children with autism spectrum disorders: prevalence, comorbidity, and associated factors in a population-derived sample. Journal of the American Academy of Child & Adolescent Psychiatry, 47, 921–929. [DOI] [PubMed] [Google Scholar]
- Smith LE, Maenner MJ, & Seltzer MM (2012). Developmental trajectories in adolescents and adults with autism: The case of daily living skills. Journal of the American Academy of Child & Adolescent Psychiatry, 51, 622–631. [DOI] [PMC free article] [PubMed] [Google Scholar]
- Sparrow SS, Cicchetti DV, & Balia DA (2005). Vineland adaptive behavior scales (2nd ed.). Circle Pines, MN: American Guidance Service Inc. [Google Scholar]
- Spencer TJ, Biederman J, & Mick E (2007). Attention-deficit / hyperactivity disorder: Diagnosis, lifespan, comorbidities, and neurobiology. Journal of Pediatric Psychology, 32, 631–642. [DOI] [PubMed] [Google Scholar]
- Steinberg L (2008). A social neuroscience perspective on adolescent risktaking. Developmental Review, 28, 78–106. doi: 10.1016/j.dr.2007.08.002 [DOI] [PMC free article] [PubMed] [Google Scholar]
- Stewart ME, Barnard L, Pearson J, Hasan R, & O’Brien G (2006). Presentation of depression in autism and Asperger syndrome: A review. Autism, 10, 103–116. [DOI] [PubMed] [Google Scholar]
- Storch EA, Wood JJ, Ehrenreich-May J, Jones AM, Park JM, Lewin AB, & Murphy TK (2012). Convergent and discriminant validity and reliability of the pediatric anxiety rating scale in youth with autism spectrum disorders. Journal of Autism and Developmental Disorders, 42, 2374–2382. [DOI] [PubMed] [Google Scholar]
- Strang JF, Kenworthy L, Daniolos P, Case L, Wills MC, Martin A, & Wallace GL (2012). Depression and anxiety symptoms in children and adolescents with autism spectrum disorders without intellectual disability. Research in Autism Spectrum Disorders, 6, 406–412. [DOI] [PMC free article] [PubMed] [Google Scholar]
- Stringer D, Kent R, Briskman J, Lukito S, Charman T, Baird G, … Simonoff E (2020). Trajectories of emotional and behavioral problems from childhood to early adult life. Autism, 24, 1011–1024. [DOI] [PMC free article] [PubMed] [Google Scholar]
- Taurines R, Schwenck C, Westerwald E, Sachse M, Siniatchkin M, & Freitag C (2012). ADHD and autism: Differential diagnosis or overlapping traits? A selective review. ADHD Attention Deficit and Hyperactivity Disorders, 4, 115–139. [DOI] [PubMed] [Google Scholar]
- Taylor JL, & Seltzer MM (2011). Employment and post-secondary educational activities for young adults with autism spectrum disorders during the transition to adulthood. Journal of Autism and Developmental Disorders, 41, 566–574. [DOI] [PMC free article] [PubMed] [Google Scholar]
- Thapar A, Collishaw S, Pine DS, & Thapar AK (2012). Depression in adolescence. Lancet, 379, 1056–1067. 10.1016/S0140-6736(11)60871-4 [DOI] [PMC free article] [PubMed] [Google Scholar]
- Vannucchi G, Masi G, Toni C, Dell’Osso L, Marazziti D, & Perugi G (2014). Clinical features, developmental course, and psychiatric comorbidity of adult autism spectrum disorders. CNS Spectrums, 19, 157–164. [DOI] [PubMed] [Google Scholar]
- Van Oort FVA, Greaves Lord K, Verhulst FC, Ormel J, & Huizink AC (2009). The developmental course of anxiety symptoms during adolescence: the TRAILS study. Journal of Child Psychology and Psychiatry, 50, 1209–1217. [DOI] [PubMed] [Google Scholar]
- van Steensel FJA, Bögels SM, & Perrin S (2011). Anxiety disorders in children and adolescents with autistic spectrum disorders: A meta-analysis. Clinical Child and Family Psychology Review, 14, 302–317. [DOI] [PMC free article] [PubMed] [Google Scholar]
- Wechsler D (1999). Manual for the Wechsler abbreviated scale of intelligence. San Antonio, TX: Psychological Corporation. [Google Scholar]
- Wei X, Wagner M, Hudson L, Yu JW, & Shattuck P (2015). Transition to adulthood: Employment, education, and disengagement in individuals with autism spectrum disorders. Emerging Adulthood, 3, 37–45. [Google Scholar]
- White SW, Lerner MD, McLeod BD, Wood JJ, Ginsburg GS, Kerns C, … Compton S (2015). Anxiety in youth with and without autism spectrum disorder: Examination of factorial equivalence. Behavior Therapy, 46, 40–53. [DOI] [PMC free article] [PubMed] [Google Scholar]
- White SW, Oswald D, Ollendick T, & Scahill L (2009). Anxiety in children and adolescents with autism spectrum disorders. Clinical Psychology Review, 29, 216–229. [DOI] [PMC free article] [PubMed] [Google Scholar]
- Wood JJ, & Gadow KD (2010). Exploring the nature and function of anxiety in youth with autism spectrum disorders. Clinical Psychology: Science and Practice, 17, 281–292. [Google Scholar]
- Woodman AC, Mailick MR, & Greenberg JS (2016). Trajectories of internalizing and externalizing symptoms among adults with autism spectrum disorders. Development and Psychopathology, 28, 565–581. [DOI] [PMC free article] [PubMed] [Google Scholar]
- Yerys BE, Bertollo JR, Pandey J, Guy L, & Schultz RT (2019). Attention-Deficit/Hyperactivity Disorder symptoms are associated with lower adaptive behavior skills in children with autism. Journal of the American Academy of Child & Adolescent Psychiatry, 58, 525–533. [DOI] [PubMed] [Google Scholar]
- Zablotsky B, Bramlett MD, & Blumberg SJ (2020). The co-occurrence of autism spectrum disorder in children with ADHD. Journal of Attention Disorders, 24, 94–103. [DOI] [PMC free article] [PubMed] [Google Scholar]
- Zwaigenbaum L, Bauman ML, Choueiri R, Kasari C, Carter A, Granpeesheh D, … Pierce K (2015). Early intervention for children with autism spectrum disorder under 3 years of age: recommendations for practice and research. Pediatrics, 136, S60–S81. [DOI] [PMC free article] [PubMed] [Google Scholar]
Associated Data
This section collects any data citations, data availability statements, or supplementary materials included in this article.