

Abstract
Background
Insulin resistance and metabolic dysfunction have been associated with asthma risk and asthma severity.
Objective
To examine the association between glycated hemoglobin A1c (HbA1c), asthma-related hospitalizations, and lung function measures among adults in the United Kingdom (U.K.).
Methods
Cross-sectional study of 47,606 adults aged 40 to 69 years old who participated in the UK Biobank and had asthma but no diagnosis of diabetes mellitus. HbA1c level was analyzed as a continuous measure and also categorized as normal (<42 mmol/mol) or as consistent with pre-diabetes/diabetes (≥ 42 mmol/mol). An asthma-related hospitalization was defined as ever having had a hospitalization with an International Classification of Diseases Clinical Modification (ICD) code of a main diagnosis compatible with asthma (ICD-9: 493.x or ICD-10: J45.x and J46.x). Logistic or linear regression was used for the multivariable analysis of asthma hospitalizations and lung function measures (FEV1, FVC, and FEV1/FVC). All models were adjusted for age, sex, ethnic background, body mass index, average annual household income, current smoking status, pack-years of smoking, fasting time, and C-reactive protein.
Results
Both HbA1c level (odds ratio [OR] = 1.03, 95% confidence interval [CI] = 1.01 to 1.04) and a HbA1c in the pre-diabetic or diabetic range (OR = 1.68, 95% CI = 1.18 to 2.41) were associated with ≥1 asthma hospitalization. Moreover, both HbA1c level and a HbA1c in the prediabetic/diabetic range were significantly and inversely associated with FEV1 and FVC.
Conclusions
HbA1c is linked to asthma-related hospitalizations and small decrements in FEV1 and FVC among British adults with asthma but no diagnosis of diabetes mellitus.
Keywords: Glycated hemoglobin A1c(HbA1c), asthma hospitalization, lung function, UK Biobank
INTRODUCTION
Asthma is a common non-communicable respiratory disease, currently affecting approximately 235 million people worldwide (1). In 2016, the prevalence of asthma in the United Kingdom (U.K.) was 9.6%, with asthma leading to nearly 93,000 hospitalizations (2). Hospitalizations for asthma, resulting from severe or poorly controlled disease, account for a substantial proportion of direct healthcare costs from asthma (3).
Insulin resistance and metabolic syndrome or its components (e.g., high waist circumference and hyperglycemia) have been associated with asthma in children (4) and adults (5). Moreover, metabolic dysfunction and glucose dysregulation have been associated with worse lung function in subjects with and without asthma (6–8). Glycated hemoglobin A1c (HbA1c) reflects glucose control over a 3-month period and is a reasonable indicator of high risk for pre-diabetes or future diabetes in adults (9).
Prediabetes or diabetes (defined by doctor-diagnosed diabetes or HbA1c levels) has been associated with asthma exacerbations in some previous studies (10–12). However, those studies were limited by lack of objective measures of glucose control, potential confounding by treatment, or non-generalizability to non-obese individuals (10–12).
We hypothesized that chronic hyperglycemia would lead to worse lung function and hospitalizations among adults with asthma. We examined this hypothesis by testing for association between HbA1c level and lung function measures and hospitalizations for asthma in a cohort of adults with self-reported doctor-diagnosed asthma living in the U.K. Because obesity or sex have been shown to modify the association between HbA1c and lung function or asthma exacerbations (13, 14), we tested for interactions between HbA1c and those variables.
METHODS
Study population
The UK Biobank (UKB) is a large prospective population-based study of adults aged 40 to 69 years in the U.K. (15). The UKB recruited about 500,000 participants who lived within 40 km of one of the 22 assessment centers in England, Scotland and Wales between 2006 and 2010 (16). Figure 1 shows the flow chart for selection of participants in this analysis. A total of 47,606 adults met the following criteria and were included in the current analysis: (1) self-reported doctor-diagnosed asthma, (2) no doctor-diagnosed chronic obstructive pulmonary disease (COPD), (3) no doctor-diagnosed diabetes mellitus, and (4) complete data on HbA1c and body mass index (BMI).
Figure 1. Flow chart of recruitment, inclusion and exclusion of study participants.
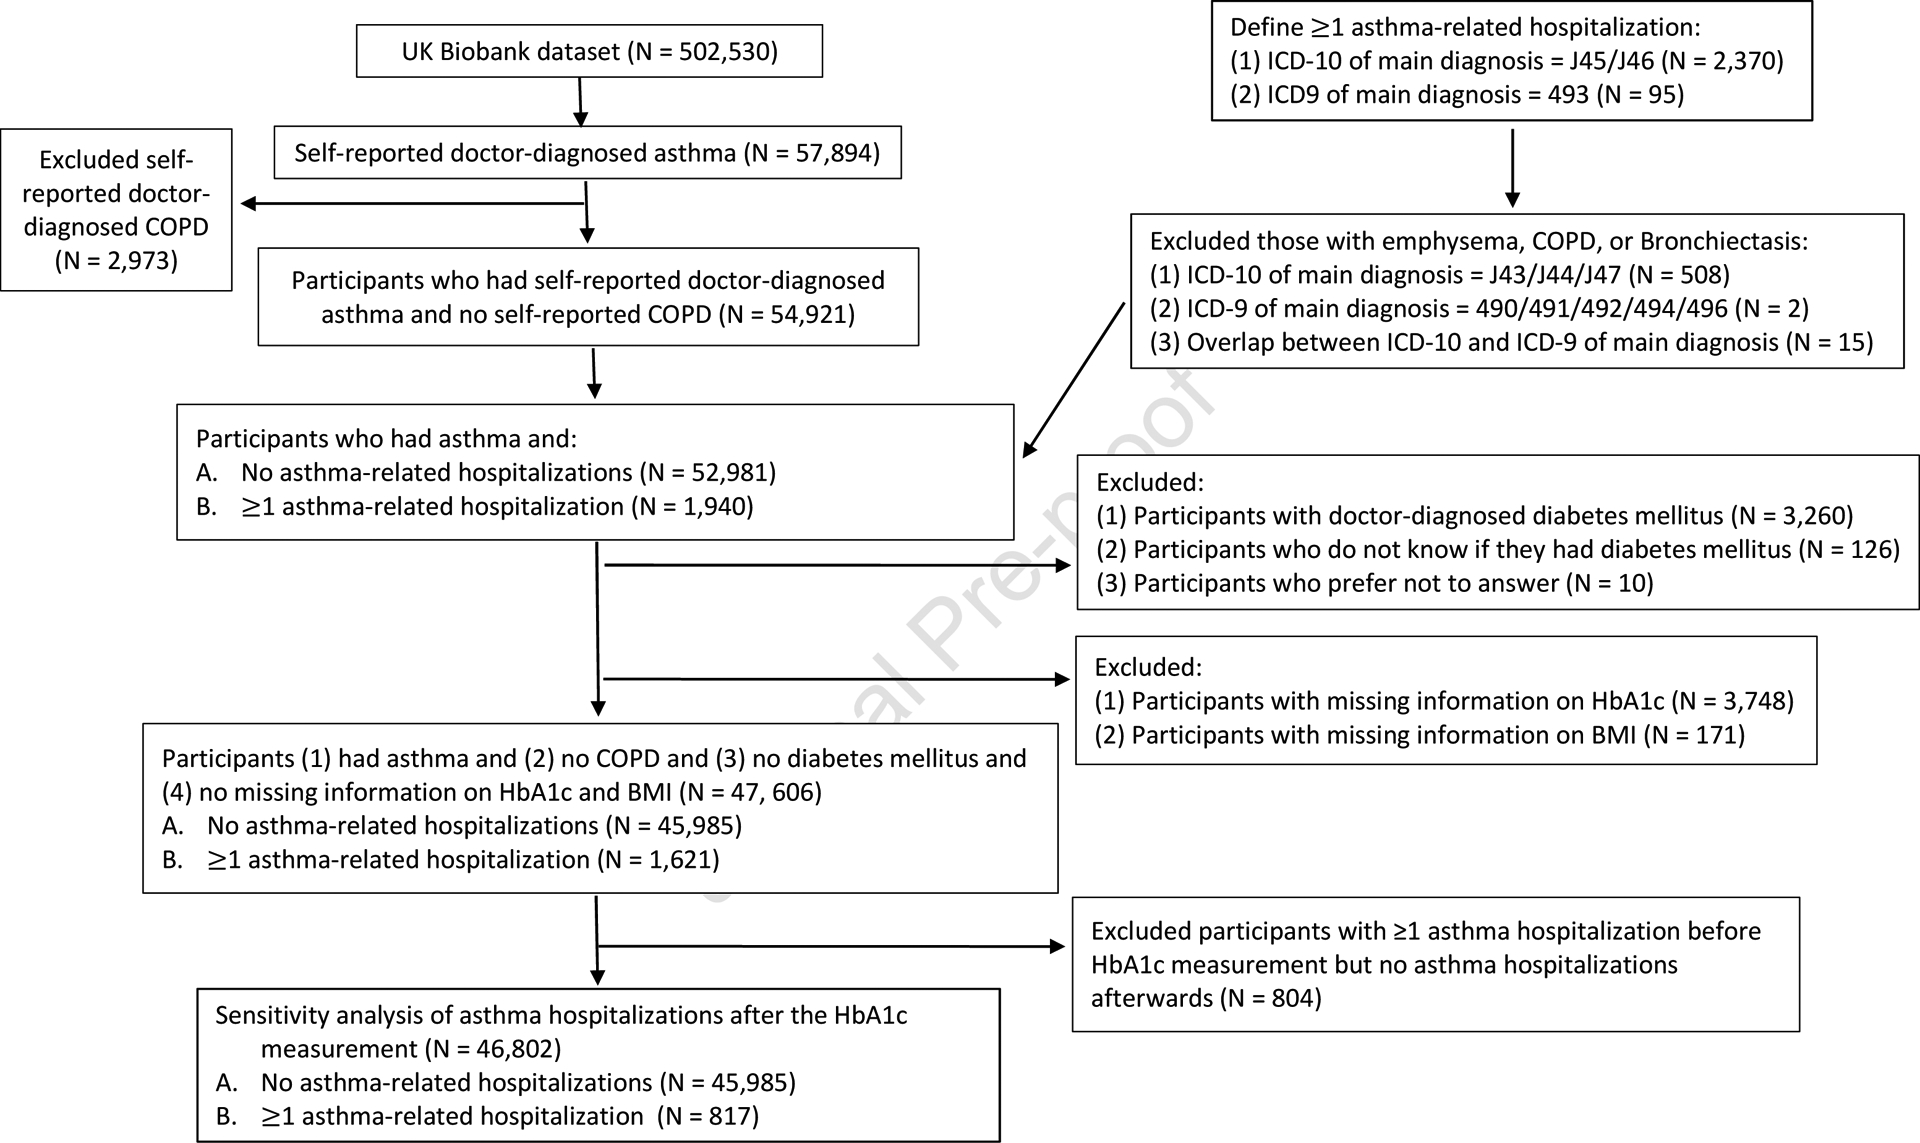
COPD = Chronic obstructive pulmonary disease, BMI = body mass index
The UKB was approved by the UK National Health Service (NHS) National Research Ethics Service (Ref 11/NW/0382). Informed consent was obtained from all participants. The current study was conducted using the UKB Resource under application number 43252. Details of the methods, protocols, and definitions used in the UKB can be found at https://www.ukbiobank.ac.uk/.
Study procedures
Blood samples were received by the UKB laboratory store following collection at the assessment centers. HbA1c levels were measured in these samples using HPLC (high-performance liquid chromatography) on a Bio-Rad VARIANT II Turbo hemoglobin testing system. Spirometry was performed using a Vitalograph Pneumotrac 6800 spirometer (Vitalograph Ltd., Buckingham, England), following European Respiratory Society (ERS)/American Thoracic Society (ATS) criteria for acceptability and reproducibility (17). Participants were excluded from spirometry testing if they were pregnant (in their first or third trimester) or being treated for tuberculosis, or if they had: a chest infection in the last month (i.e., influenza, bronchitis, severe cold, pneumonia), history of a detached retina, a heart attack, eye surgery, surgery in the chest or abdomen in the previous 3 months, or history of a collapsed lung. Only spirometry testing that met the ATS/ERS reproducibility guidelines was included in the analysis of lung function measures.
A hospitalization for asthma was defined as ever having had a hospitalization with an International Classification of Diseases Clinical Modification (ICD) code of main diagnosis compatible with asthma (ICD-9: 493.x or ICD-10: J45.x and J46.x), excluding hospitalizations with an ICD code for a main diagnosis consistent with COPD (ICD-9: J43, J44, J47 or ICD-10: 490, 491, 492, 494, 496). Data on asthma hospitalizations were available before (range=0 to 27 years, median=7 years) and after (range=0 to 13 years, median=5 years) the participant’s HbA1 measurement.
Statistical analysis
For data analysis, HbA1c level was considered as both a continuous variable and a categorical variable (defined as normal [<42 mmol/mol, corresponding to a HbA1c <6%)] vs. consistent with pre-diabetes/diabetes (≥ 42 mmol/mol, corresponding to a HbA1c ≥6%)), based on U.K. guidelines (18). For the analysis of asthma hospitalizations, cases were subjects with asthma and ≥1 asthma-related hospitalization (ever), and control subjects were those with asthma but no asthma-related hospitalizations (ever). For the analysis of lung function, Z-scores were first calculated for lung function measures based on recommendations from the Global Lung Function Initiative 2012 (19), and then derived as inverted Z-scores (20). We converted all inverted Z-scores to standard Z-scores through multiplying by −1.
Chi-square and t tests were used for bivariate analyses of binary and continuous variables, respectively. Logistic or linear regression was used for the multivariable analysis of asthma hospitalizations and lung function measures. The analysis of asthma hospitalizations was adjusted for age, sex, ethnicity (non-Caucasian [including black or black British, mixed ethnic background, Asian or Asian British, Chinese and other ethnic groups] or Caucasian [including white, British, Irish and any other white background]), BMI (normal weight vs. overweight vs. obese), total annual household income (less than £18,000, £18,000 to £100,000, or greater than £100,000), smoking status (never/former vs. current smoking), pack-years of smoking, fasting time, and C-reactive protein (CRP) level (a marker of systemic inflammation). Models for lung function measures (as Z-scores) were adjusted for BMI, total annual household income, smoking status, pack-years of smoking, fasting time, C-reactive protein (CRP) level, and asthma-related hospitalizations (as an indicator of asthma severity or control). Because obesity and/or sex may modify the effect of hyperglycemia on asthma (13), we tested for an interaction between HbA1c and weight status (as BMI or categories of weight status [normal weight, overweight, and obesity]) or sex on asthma hospitalizations and lung function measures in the multivariable models.
R program (Version 3.5.1) was used for all analyses.
RESULTS
Table 1 shows the main characteristics of the 47,606 participants, including 45,984 subjects who had asthma but were never hospitalized (control subjects) and 1,621 subjects who had asthma and ≥1 asthma-related hospitalization (cases). Compared with control subjects, cases were more likely to be female, non-Caucasian, obese, and pre-diabetic or diabetic. Cases were also more likely to have a total annual household income less than £18,000, a longer fasting time; and higher HbA1c, CRP, and BMI but lower FEV1 Z-score, FVC Z-score and FEV1/FVC Z-score than control subjects. There was no significant difference in smoking status or pack-years of smoking between cases and control subjects.
Table 1. Characteristics of study participants (N = 47,606).
| Characteristics | No asthma-related hospitalization (N = 45, 985 [96.6%]) | ≥1 asthma-related hospitalization (N = 1,621 [3.4%]) |
|---|---|---|
| Age, years | 55.4 ± 8.3 | 55.6 ± 8.5 |
| Male sex | 19,063 (41.7) | 522 (32.4)** |
| Ethnic background‡ | ||
| Non-Caucasian | 2,162 (4.7) | 116 (7.2)** |
| Caucasian | 43,667 (95.3) | 1,499 (92.8) |
| Body mass index (BMI), kg/m2 | 27.8 ± 5.1 | 28.9 ± 5.8** |
| Normal weight (BMI <25 kg/m2) | 14,411 (31.3) | 401 (24.7)** |
| Overweight (25 kg/m2<BMI <30 kg/m2) | 19,179 (41.7) | 662 (40.8) |
| Obese (BMI≥30 kg/m2) | 12,395 (27.0) | 558 (34.4) |
| Total annual household income, £ | ||
| Less than £18,000 | 8,641 (21.8) | 400 (29.3)** |
| £18,000 to £100,000 | 28,637 (72.2) | 929 (68.1) |
| Greater than £100,000 | 2,373 (6.0) | 35 (2.6) |
| Smoking status | ||
| Never/former smokers | 41,716 (91.1) | 1,447 (89.8) |
| Current smokers | 4,092 (8.9) | 164 (10.2) |
| Pack-years of smoking | 22.1 ± 18.2 | 21.7 ± 17.9 |
| Fasting time | 3.8 ± 2.5 | 3.9 ± 2.6* |
| < 4 hours | 25,528 (55.5) | 843 (52.0)** |
| ≥ 4 hours | 20,454 (44.5) | 778 (48.0) |
| Glycated hemoglobin A1C (HbA1c), mmol/mol | 35.3 ± 4.6 | 35.9 ± 4.5** |
| Normal HbA1c (<42 mmol/mol) | 43,786 (95.2) | 1,500 (92.5)** |
| Pre-diabetes/diabetes range (≥ 42 mmol/mol) | 2,199 (4.8) | 121 (7.5) |
| C-reactive protein (CRP), mg/L | 2.9 ± 4.7 | 3.7 ± 5.7** |
| FEV1 Z-score | −0.84 ± 1.17 | −1.26 ± 1.24** |
| FVC Z-score | −0.38 ± 1.07 | −0.65 ± 1.10** |
| FEV1/FVC Z-score | −0.86 ± 1.02 | −1.15 ± 1.15** |
Values are presented as number (%) or mean (mean±standard deviation). Values may vary due to missingness.
Non-Caucasian ethnic background includes black or black British, mixed ethnic background, Asian or Asian British, Chinese and other ethnic groups. Caucasian ethnic background includes White, British, Irish and any other white background.
P< 0.05
P< 0.01
Table 2 shows the results of the unadjusted and adjusted analyses of HbA1c or a HbA1c in the pre-diabetes/diabetes range and ≥1 asthma-related hospitalization. In the multivariable analysis, each mmol/mol increment in HbA1c was significantly associated with 3% increased odds of ≥1 asthma-related hospitalization (P <0.01). In this analysis, subjects with a HbA1 in the pre-diabetes or diabetes range had 1.68 times significantly higher odds of ≥1 asthma-related hospitalization than those with a normal HbA1c level (P <0.01). There was no significant interaction between HbA1c level or a HbA1c in the prediabetes/diabetes range and sex or weight status (as BMI or categories of weight status [normal weight, overweight, and obesity]) on asthma-related hospitalizations (P ≥0.25 in all instances).
Table 2.
Analysis of the relation between HbA1c or prediabetes/diabetes status and asthma-related hospitalizations among 47,606 participants in the UK Biobank
| Exposure | Unadjusted analysis | Adjusted analysis† |
|---|---|---|
| Odds ratio (95% confidence interval) | ||
| All participants (N = 47,606) | ||
| HbA1c (per each mmol/mol increment) | 1.02 (1.02, 1.03) ** | 1.03 (1.01, 1.04) ** |
| Normal HbA1c (<42 mmol/mol) (N = 45,286) | 1.0 | 1.0 |
| Pre-diabetes/diabetes range (≥ 42 mmol/mol) (N = 2,320) | 1.61 (1.33, 1.94) ** | 1.68 (1.18, 2.41) ** |
Models adjusting for age, sex, ethnicity, body mass index, total annual household income, smoking status, pack-years of smoking, fasting time, and C-reactive protein level.
P< 0.05
P< 0.01
To reduce potential misclassification of COPD as asthma, we conducted a sensitivity analysis restricted to 30,044 subjects who were never smokers or former smokers who smoked ≤10 pack-years, obtaining similar results for HbA1c level but weaker and less significant results for a HbA1c in the prediabetes/diabetes range (Table E1). In an effort to better assess temporal relationships, we conducted another sensitivity analysis after excluding 804 subjects who reported ≥1 asthma hospitalization before the HbA1c measurement but not afterwards. In this analysis, we obtained similar results for HbA1c level but slightly weaker and less significant results for a HbA1c in the prediabetes/diabetes range (Table 3).
Table 3.
Analysis of the relation between HbA1c or prediabetes/diabetes status and asthma-related hospitalizations among 46,802 participants who had at least one hospitalization after the HbA1c measurement
| Exposure | Unadjusted analysis | Adjusted analysis† |
|---|---|---|
| Odds ratio (95%confidence interval) | ||
| All participants (N = 46,802) | ||
| HbA1c (per each mmol/mol increment) | 1.03 (1.02, 1.04) ** | 1.03 (1.00, 1.05) * |
| Normal HbA1c (<42 mmol/mol) (N = 44,537) | 1.0 | 1.0 |
| Pre-diabetes/diabetes range (≥ 42 mmol/mol) (N = 2,265) | 1.75 (1.36, 2.26) ** | 1.58 (0.95, 2.64) |
Models adjusting for age, sex, ethnicity, body mass index, total annual household income, smoking status, pack-years of smoking, fasting time, and C-reactive protein level.
P< 0.05
P< 0.01
Table 4 shows the results of the multivariable analysis of HbA1c level or a HbA1c in the pre-diabetes/diabetes range and lung function measures (as Z-scores). In this analysis, HbA1c level was significantly and negatively associated with FEV1 and FVC, but not with FEV1/FVC. For example, each mmol/mol increment in HbA1c was significantly associated with a decrement of 0.015 in FEV1 Z-score. Similarly, a HbA1c in the pre-diabetes or diabetes range was significantly associated with decrements in FEV1 and FVC. There was no significant interaction between sex or weight status (as BMI or categories of weight status [normal weight, overweight, and obesity]) and HbA1c level or a HbA1c in the prediabetes/diabetes range on any lung function measure (P ≥ 0.10 in all instances). Moreover, a sensitivity analysis restricted to never smokers and former smokers with ≤10 pack-years of smoking yielded very similar results for HbA1c, which remained significantly and inversely associated with FEV1 and FVC, but not with FEV1/FVC. In this sub-group analysis, a HbA1c in the prediabetes or diabetes range remained significantly associated with lower FEV1 and FVC, though the magnitude of the effect estimates was attenuated (Table 5).
Table 4.
Analysis of the relation between HbA1c or prediabetes/diabetes status and lung function measures (as Z scores) among 47,606 participants in the UK Biobank†
| Exposure | FEV1 | FVC | FEV1/FVC | ||
|---|---|---|---|---|---|
| β coefficient (95% confidence interval) | |||||
| HbA1c (per each mmol/mol increment) | −0.015 (−0.021, −0.010) ** | −0.015 (−0.020, −0.010) ** | −0.003 (−0.008, 0.002) | ||
| Pre-diabetes/diabetes range (≥ 42 mmol/mol) (N = 2,320) | −0.210 (−0.328, −0.093) ** | −0.227 (−0.331, −0.124) ** | −0.044 (−0.143, 0.056) | ||
Models adjusting for body mass index, average total household income, smoking status, pack-years of smoking, fasting time, C-reactive protein (CRP) and having ever been hospitalized for asthma.
P< 0.05
P< 0.01
Table 5.
Analysis of the relation between HbA1c or prediabetes/diabetes status and lung function measures (as Z-scores) among 30,044 never smokers and former smokers who smoked ≤ 10 pack-years †
| Exposure | FEV1 | FVC | FEV1/FVC |
|---|---|---|---|
| β coefficient (95% confidence interval) | |||
| HbA1c (per each mmol/mol increment) (N = 30,044) | −0.013 (−0.017, −0.009) ** | −0.015 (−0.019, −0.012) ** | 0.001 (−0.003, 0.004) |
| Pre-diabetes/diabetes range (≥ 42 mmol/mol) (N = 1,281) | −0.102 (−0.202, −0.001) * | −0.156 (−0.246, −0.066) ** | 0.064 (−0.019, 0.148) |
Models adjusting for body mass index, smoking status, average total household income, fasting time, C-reactive protein (CRP) and having ever been hospitalized for asthma.
P< 0.05
P< 0.01
DISCUSSION
HbA1c, a surrogate marker of blood glucose levels over the previous 2 to 3 months, has been integrated into the standard diagnosis criteria for diabetes mellitus since 2009 (21). Among 47,606 British adults with asthma, we found that both the HbA1c level and pre-diabetes or diabetes (defined on the basis of an elevated HbA1 level) were significantly associated with asthma-related hospitalizations and decreased FEV1 and FVC.
Diabetes mellitus has been previously linked to asthma exacerbations among adults in the U.S. and the U.K. In a cross-sectional analysis of data from 709 participants in the U.S.-based Severe Asthma Research Program (SARP)-3 cohort, subjects with exacerbation-prone asthma were more likely to self-report a diagnosis of diabetes mellitus than those without exacerbation-prone asthma (P = 0.005). However, this finding was non-statistically significant after adjustment for covariates in a multivariable analysis (12). In contrast, a historical study of 130,547 patients (aged 12 to 80 years) in two databases from the U.K. showed that a diagnosis of diabetes type I or type II was significantly associated with 1.53 times increased odds of asthma-related hospitalizations within the next year, even after accounting for overweight or obesity, smoking status, and other potential confounders (10). Using HbA1c levels instead of a historical or self-reported diagnosis of diabetes, a claims-based study of 5,722 obese adults in the U.S. found that participants with a HbA1c level in the pre-diabetic (defined as 5.7% ≤HbA1c≤6.4%) or diabetic (defined as HbA1c≥6.5%) range had 1.27 times to 1.33 times significantly higher odds of severe asthma exacerbations (including hospitalizations, emergency department visits, and use of systemic corticosteroids for asthma) than those with a normal HbA1c (11). However, that study did not account for BMI and only partially adjusted for cigarette smoking. Moreover, one study of 297 adults (≥18 years old) with coexistent severe asthma and diabetes showed that the severity of asthma was negatively associated with diabetes control (OR = 1.55, CI = 1.32 – 2.21) (22).
Our study differs from previous reports with regard to study design (10–12, 22), adjustment for confounders including cigarette smoking and BMI, inclusion of participants with asthma who had normal weight or were overweight (11), use of a biomarker for the diagnosis of diabetes (HbA1c), availability of data on asthma hospitalizations up to 13 years after the HbA1c measurement, and exclusion of participants with doctor-diagnosed diabetes mellitus to minimize confounding of the analysis of HbA1c level by diabetes per se and/or increased access to healthcare (10, 12, 22). Moreover, we used a HbA1c level of 42 mmol/mol (corresponding to 6.0%) as the cutoff for the diagnosis of pre-diabetes/diabetes, which is lower than that used in the prior study of the obese adults in the U.S. (11).
Findings from previous studies suggest that there may be a bi-directional association between HbA1c and asthma hospitalizations (11, 32). Despite reduced statistical power, findings from a sensitivity analysis -including only 817 cases with ≥1 asthma hospitalization after their HbA1c level was checked- suggest that an elevated HbA1c may indeed lead to an increased risk of subsequent asthma exacerbations. HbA1c (a surrogate of chronic hyperglycemia) can indicate insulin resistance, which has been linked to reduced lung function. In vivo and in vitro experiments suggest that hyperinsulinemia can induce hypercontractility of tracheal smooth muscle by inducing airway smooth muscle proliferation and collagen release (23) and by modifying the expression of extracellular matrix protein (e.g., laminin (24)). Moreover, insulin resistance may induce systemic inflammation, leading to severe asthma exacerbations (25).
Diabetes and HbA1c level have been shown to be negatively associated with lung function measures in some studies with a smaller sample size (7, 8, 26, 27). In a multivariable analysis of 15,792 U.S. adults in the Atherosclerosis Risk in Communities (ARIC) Study, % predicted FEV1 and % predicted FVC were 3.6% and 2.4% significantly lower in adults with diabetes than those without diabetes, after adjusting for BMI, waist circumference, smoking and other covariates. In contrast to the ARIC study, a U.S. nationwide survey study demonstrated that there was a significant nonlinear inverse association between an elevated HbA1c percentage and FEV1, FVC and FEV1/FVC ratio, after adjusting for BMI and waist-to-hip ratio in 4,257 adults without a clinical diagnosis of diabetes (27). Neither of those two studies considered potential effects of respiratory comorbidities, such as asthma, on glucose metabolism. Furthermore, another study analyzing the data from 2,945 non-smoking African Americans revealed that both women (n = 357) and men (n = 124) with diabetes had lower FEV1 and FVC than those with normal glucose tolerance (1,445 women and 654 men), but there was no significant difference in FEV1 or FVC between women (n = 236) or men (n = 129) with impaired glucose tolerance and those with normal glucose tolerance (8). In a cross-sectional study of 3,161 Japanese adults, each 1% increment in HbA1c was significantly associated with decrements of 128 ml (95% CI = 94 to 163 ml) in FVC and 73 ml (95% CI = 44 ml to 101 ml) in FVC and FEV1, respectively, in 2,175 men. Although there was no significant association between HbA1c and lung function among 986 women, that could be due to smaller sample size, as no evidence of a significant interaction between sex and HbA1c was demonstrated (7). In contrast to the current analysis, the Japanese adults did not exclude diabetic participants, and thus confounding by diabetes is possible because they cannot determine the effect of HbA1c level on lung function among participants without a diagnosis of diabetes mellitus.
We found a significant but weak inverse association between HbA1c level or a HbA1c in the prediabetes/diabetes range and FEV1 and FVC, but such associations were weak. Although this suggests non-clinically significant effects of HbA1c on lung function in subjects with asthma but no diagnosis of diabetes mellitus, we cannot estimate the cumulative effects of a persistently elevated HbA1c on lung function in this cross-sectional analysis.
We recognize additional study limitations. First, we lack data on potential confounders or modifiers of the relation between HbA1c and asthma hospitalizations or lung function, such as medication use for asthma (32) and lipid dysregulation (33). Second, misclassification of COPD as asthma is possible in any study of asthma in adults. However, we obtained very similar results for HbA1c and asthma hospitalizations or lung function measures after excluding current and former smokers who smoked more than 10 pack-years from the analysis. In this sensitivity analysis, the strength of the observed association between a HbA1c level in the prediabetes/diabetes range and asthma hospitalizations or lung function measures was attenuated, which could be explained by smaller sample size and/or possibly reduced effects of prediabetes/diabetes in non-smokers. Third, our findings are not generalizable to adults without asthma and adults <40 years old, children and adolescents.
In summary, our results suggest that an elevated HbA1c level is linked to increased risk of asthma hospitalizations in British adults with asthma but no physician-diagnosed diabetes mellitus.
Supplementary Material
Highlights box:
What is already known about this topic?
Prediabetes and diabetes have been associated with asthma.
What does this article add to our knowledge?
This study shows that an elevated glycated hemoglobin A1c is associated with asthma-related hospitalizations and lower FEV1 and FVC among adults with asthma but no diagnosis of diabetes mellitus.
How does this study impact current management guidelines?
Asthmatic patients with an elevated glycated hemoglobin A1c, even if not diagnosed with diabetes, should be monitored closely because of a potential increased risk of asthma-related hospitalizations
Acknowledgments
G.Y., W.C. and J.C.C. participated in study design, data analysis, manuscript writing, and interpretation of the study results. Y-Y.H., Q.Y., F.R. and E.F. participated in data analysis. All authors reviewed and approved the final version of the submitted manuscript. J.C.C. is the guarantor of this work and takes responsibility for the integrity.
Funding
The contributions of Dr. Han and Dr. Celedón were supported by grants HL117191, HL119952, and MD011764 from the U.S. NIH. Dr. Rosser’s contribution was supported by grant KL2TR001856 from the NIH. Dr. Forno’s contribution was supported by grant HL125666 from the U.S. This study was conducted using the UK Biobank Resource under Application Number 43252.
Abbreviation list:
- UKB
UK Biobank
- COPD
chronic obstructive pulmonary disease
- BMI
body mass index
- HbA1c
glycated hemoglobin A1c
- CRP
C-reactive protein
- FEV1
forced expiratory volume in the first second
- FVC
forced vital capacity
Footnotes
Publisher's Disclaimer: This is a PDF file of an unedited manuscript that has been accepted for publication. As a service to our customers we are providing this early version of the manuscript. The manuscript will undergo copyediting, typesetting, and review of the resulting proof before it is published in its final form. Please note that during the production process errors may be discovered which could affect the content, and all legal disclaimers that apply to the journal pertain.
Conflicts of interest
Dr. Celedón has received research materials from Merck and GSK (inhaled steroids), and Pharmavite (vitamin D and placebo capsules), to provide medications free of cost to participants in NIH-funded studies, unrelated to the current work. The other authors report no conflicts of interest.
REFERENCES
- 1.World Health Organization. Asthma 2017. [updated 31 August 2017. Available from: https://www.who.int/news-room/fact-sheets/detail/asthma.
- 2.Mukherjee M, Stoddart A, Gupta RP, Nwaru BI, Farr A, Heaven M, et al. The epidemiology, healthcare and societal burden and costs of asthma in the UK and its member nations: analyses of standalone and linked national databases. BMC Medicine. 2016;14(1):113. [DOI] [PMC free article] [PubMed] [Google Scholar]
- 3.Bahadori K, Doyle-Waters MM, Marra C, Lynd L, Alasaly K, Swiston J, et al. Economic burden of asthma: a systematic review. BMC Pulm Med. 2009;9:24. [DOI] [PMC free article] [PubMed] [Google Scholar]
- 4.Cottrell L, Neal WA, Ice C, Perez MK, Piedimonte G. Metabolic abnormalities in children with asthma. Am J Respir Crit Care Med. 2011;183(4):441–8. [DOI] [PMC free article] [PubMed] [Google Scholar]
- 5.Brumpton BM, Camargo CA Jr., Romundstad PR, Langhammer A, Chen Y, Mai XM. Metabolic syndrome and incidence of asthma in adults: the HUNT study. Eur Respir J. 2013;42(6):1495–502. [DOI] [PubMed] [Google Scholar]
- 6.Forno E, Han YY, Muzumdar RH, Celedon JC. Insulin resistance, metabolic syndrome, and lung function in US adolescents with and without asthma. J Allergy Clin Immunol. 2015;136(2):304–11 e8. [DOI] [PMC free article] [PubMed] [Google Scholar]
- 7.Kabeya Y, Kato K, Tomita M, Katsuki T, Oikawa Y, Shimada A. Association of glycemic status with impaired lung function among recipients of a health screening program: a cross-sectional study in Japanese adults. J Epidemiol. 2014;24(5):410–6. [DOI] [PMC free article] [PubMed] [Google Scholar]
- 8.Hickson DA, Burchfiel CM, Liu J, Petrini MF, Harrison K, White WB, et al. Diabetes, impaired glucose tolerance, and metabolic biomarkers in individuals with normal glucose tolerance are inversely associated with lung function: the Jackson Heart Study. Lung. 2011;189(4):311–21. [DOI] [PMC free article] [PubMed] [Google Scholar]
- 9.American Diabetes Association. Diagnosis and classification of diabetes mellitus. Diabetes care. 2010;33 Suppl 1(Suppl 1):S62–S9. [DOI] [PMC free article] [PubMed] [Google Scholar]
- 10.Price D, Wilson AM, Chisholm A, Rigazio A, Burden A, Thomas M, et al. Predicting frequent asthma exacerbations using blood eosinophil count and other patient data routinely available in clinical practice. J Asthma Allergy. 2016;9:1–12. [DOI] [PMC free article] [PubMed] [Google Scholar]
- 11.Wu TD, Brigham EP, Keet CA, Brown TT, Hansel NN, McCormack MC. Association Between Prediabetes/Diabetes and Asthma Exacerbations in a Claims-Based Obese Asthma Cohort. J Allergy Clin Immunol Pract. 2019;7(6):1868–73.e5. [DOI] [PMC free article] [PubMed] [Google Scholar]
- 12.Denlinger LC, Phillips BR, Ramratnam S, Ross K, Bhakta NR, Cardet JC, et al. Inflammatory and Comorbid Features of Patients with Severe Asthma and Frequent Exacerbations. Am J Respir Crit Care Med. 2017;195(3):302–13. [DOI] [PMC free article] [PubMed] [Google Scholar]
- 13.Guo F, Garvey WT. Trends in Cardiovascular Health Metrics in Obese Adults: National Health and Nutrition Examination Survey (NHANES), 1988–2014. J Am Heart Assoc. 2016;5(7). [DOI] [PMC free article] [PubMed] [Google Scholar]
- 14.Anne E Dixon SMN. Obesity and asthma 2019. [updated Jan 02, 2019. Available from: https://www.uptodate.com/contents/obesity-and-asthma.
- 15.Sudlow C, Gallacher J, Allen N, Beral V, Burton P, Danesh J, et al. UK Biobank: An Open Access Resource for Identifying the Causes of a Wide Range of Complex Diseases of Middle and Old Age. PLOS Medicine. 2015;12(3):e1001779. [DOI] [PMC free article] [PubMed] [Google Scholar]
- 16.Fry A, Littlejohns TJ, Sudlow C, Doherty N, Adamska L, Sprosen T, et al. Comparison of Sociodemographic and Health-Related Characteristics of UK Biobank Participants With Those of the General Population. Am J Epidemiol. 2017;186(9):1026–34. [DOI] [PMC free article] [PubMed] [Google Scholar]
- 17.Miller MR, Hankinson J, Brusasco V, Burgos F, Casaburi R, Coates A, et al. Standardisation of spirometry. European Respiratory Journal. 2005;26(2):319–38. [DOI] [PubMed] [Google Scholar]
- 18.National Institute for Health and Care Excellence(NICE). Type 2 diabetes: prevention in people at high risk [updated September 2017. Available from: https://www.nice.org.uk/guidance/ph38. [Google Scholar]
- 19.Quanjer PH, Stanojevic S, Cole TJ, Baur X, Hall GL, Culver BH, et al. Multi-ethnic reference values for spirometry for the 3–95-yr age range: the global lung function 2012 equations. Eur Respir J. 2012;40(6):1324–43. [DOI] [PMC free article] [PubMed] [Google Scholar]
- 20.Gupta RP, Strachan DP. Ventilatory function as a predictor of mortality in lifelong non-smokers: evidence from large British cohort studies. BMJ open. 2017;7(7):e015381-e. [DOI] [PMC free article] [PubMed] [Google Scholar]
- 21.Karnchanasorn R, Huang J, Ou H-Y, Feng W, Chuang L-M, Chiu KC, et al. Comparison of the Current Diagnostic Criterion of HbA1c with Fasting and 2-Hour Plasma Glucose Concentration. Journal of diabetes research. 2016;2016:6195494-. [DOI] [PMC free article] [PubMed] [Google Scholar]
- 22.Rogala B, Bożek A, Gluck J. Is there a relationship between asthma and diabetes? J Asthma. 2019:1–7. [DOI] [PubMed] [Google Scholar]
- 23.Singh S, Bodas M, Bhatraju NK, Pattnaik B, Gheware A, Parameswaran PK, et al. Hyperinsulinemia adversely affects lung structure and function. American Journal of Physiology-Lung Cellular and Molecular Physiology. 2016;310(9):L837–L45. [DOI] [PMC free article] [PubMed] [Google Scholar]
- 24.Dekkers BG, Schaafsma D, Tran T, Zaagsma J, Meurs H. Insulin-induced laminin expression promotes a hypercontractile airway smooth muscle phenotype. Am J Respir Cell Mol Biol. 2009;41(4):494–504. [DOI] [PubMed] [Google Scholar]
- 25.Dennis RJ, Maldonado D, Rojas MX, Aschner P, Rondon M, Charry L, et al. Inadequate glucose control in type 2 diabetes is associated with impaired lung function and systemic inflammation: a cross-sectional study. BMC Pulm Med. 2010;10:38. [DOI] [PMC free article] [PubMed] [Google Scholar]
- 26.Yeh HC, Punjabi NM, Wang NY, Pankow JS, Duncan BB, Cox CE, et al. Cross-sectional and prospective study of lung function in adults with type 2 diabetes: the Atherosclerosis Risk in Communities (ARIC) study. Diabetes Care. 2008;31(4):741–6. [DOI] [PMC free article] [PubMed] [Google Scholar]
- 27.McKeever TM, Weston PJ, Hubbard R, Fogarty A. Lung function and glucose metabolism: an analysis of data from the Third National Health and Nutrition Examination Survey. Am J Epidemiol. 2005;161(6):546–56. [DOI] [PubMed] [Google Scholar]
- 28.Litonjua AA, Lazarus R, Sparrow D, Demolles D, Weiss ST. Lung function in type 2 diabetes: the Normative Aging Study. Respir Med. 2005;99(12):1583–90. [DOI] [PubMed] [Google Scholar]
- 29.Yeh F, Dixon AE, Marion S, Schaefer C, Zhang Y, Best LG, et al. Obesity in adults is associated with reduced lung function in metabolic syndrome and diabetes: the Strong Heart Study. Diabetes Care. 2011;34(10):2306–13. [DOI] [PMC free article] [PubMed] [Google Scholar]
- 30.Baba S, Takashima T, Hirota M, Kawashima M, Horikawa E. Relationship between pulmonary function and elevated glycated hemoglobin levels in health checkups: A cross-sectional observational study in Japanese participants. Journal of Epidemiology. 2017;27(11):511–5. [DOI] [PMC free article] [PubMed] [Google Scholar]
- 31.Oh IH, Park JH, Lee CH, Park J-S. The Association of Normal Range Glycated Hemoglobin with Restrictive Lung Pattern in the General Population. PLOS ONE. 2015;10(2):e0117725. [DOI] [PMC free article] [PubMed] [Google Scholar]
- 32.Suissa S, Kezouh A, Ernst P. Inhaled corticosteroids and the risks of diabetes onset and progression. Am J Med. 2010;123(11):1001–6. [DOI] [PubMed] [Google Scholar]
- 33.Fenger RV, Gonzalez-Quintela A, Linneberg A, Husemoen LL, Thuesen BH, Aadahl M, et al. The relationship of serum triglycerides, serum HDL, and obesity to the risk of wheezing in 85,555 adults. Respir Med. 2013;107(6):816–24. [DOI] [PubMed] [Google Scholar]
Associated Data
This section collects any data citations, data availability statements, or supplementary materials included in this article.