Abstract
Tides are a major component of the interaction between the marine and terrestrial environments, and thus play an important part in shaping the environmental context for the evolution of shallow marine and coastal organisms. Here, we use a dedicated tidal model and palaeogeographic reconstructions from the Late Silurian to early Late Devonian (420 Ma, 400 Ma and 380 Ma, Ma = millions of years ago) to explore the potential significance of tides for the evolution of osteichthyans (bony fish) and tetrapods (land vertebrates). The earliest members of the osteichthyan crown-group date to the Late Silurian, approximately 425 Ma, while the earliest evidence for tetrapods is provided by trackways from the Middle Devonian, dated to approximately 393 Ma, and the oldest tetrapod body fossils are Late Devonian, approximately 373 Ma. Large tidal ranges could have fostered both the evolution of air-breathing organs in osteichthyans to facilitate breathing in oxygen-depleted tidal pools, and the development of weight-bearing tetrapod limbs to aid navigation within the intertidal zones. We find that tidal ranges over 4 m were present around areas of evolutionary significance for the origin of osteichthyans and the fish-tetrapod transition, highlighting the possible importance of tidal dynamics as a driver for these evolutionary processes.
Keywords: Silurian–Devonian tides, osteichthyan, fish-tetrapod transition, intertidal zone
1. Introduction
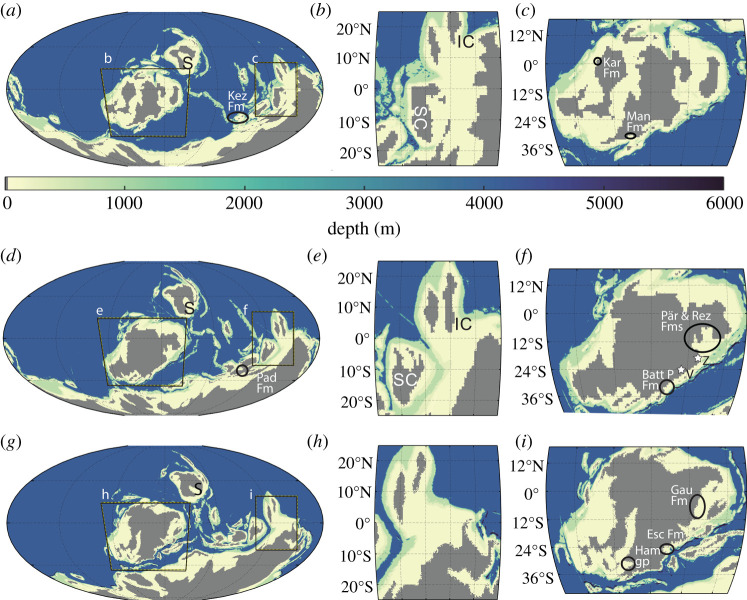
Only once in Earth's history did vertebrates make the transition from an aquatic to terrestrial environment; trackway evidence indicates this occurred approximately 393 Ma, although the earliest definite tetrapod body fossils are approximately 20 Ma younger (Ma) [1,2]. By contrast, there have been multiple adaptive radiations of vertebrates from land back to the ocean, e.g. separate groups of semi-aquatic mammals becoming the earliest cetaceans and sirenians at around 50 Ma [3,4]. The origin of tetrapods was itself part of the rapid early diversification of bony fishes (Osteichthyes); shortly after their origin, the Osteichthyes split into ray-finned fishes (Actinopterygii, the predominant fish group today) and lobe-finned fishes (Sarcopterygii), the latter giving rise to tetrapods [5]. The earliest known crown-group osteichthyans come from the Late Silurian (425 Ma) of South China, suggesting that the whole process took little more than 30 Myr. Most of the terrestrial adaptations, including the modification of the pectoral and pelvic fins into weight-bearing limbs [5], were acquired during the origin of tetrapods. However, one key component, the lungs, is older and can be traced back to the origin of the Osteichthyes, where they evidently evolved for use as supplementary respiratory organs in an aquatic environment before being co-opted to support terrestrial life [6]. The crown-group Osteichthyes most probably originated in South China, as the earliest known members are found there, and the Late Silurian to Early Devonian (starting 425 Ma) faunas of the region contain a diversity of osteichthyans that cannot be matched elsewhere [7]. The origin of tetrapods is more difficult to pinpoint, but the two earliest known trackway localities [1,8] are situated in present day (PD) Europe, which at the time was part of the ancient supercontinent Laurussia; the earliest body fossils are also Laurussian [2] (figure 1). Although the drivers behind the evolution of osteichthyans and tetrapods are as yet poorly understood and many hypotheses have been suggested to be behind these evolutionary events [2,5,9–11], it is known that the palaeoenvironment was rapidly transforming due to the emergence of macroscopic plant communities on land and a period of overall marine regression occurring from the Late Silurian to Middle Devonian [12,13].
Figure 1.
The model bathymetry for 420 Ma (a), 400 Ma (d) and 380 Ma (g), with depth saturating at 6000 m (Abyssal ocean is at 4200 m, with trenches at 6000 m). The bathymetry data are computed from the tectonic reconstructions in [26]. The major continents are as follows: Laurussia is highlighted as panels (c), (f) and (i), Gondwana is the major continent in the south of panels, and Siberia is located NE of Laurussia denoted as S in panels (a), (d) and (g). The South China region is highlighted in panels (b), (e) and (h), with South China denoted as SC and Indochina as IC. The tidal proxies have been indicated in each time slices; Kez Fm, Keziertage Formation; Kar Fm, Karheen Formation; Man Fm, Manlius Formation; Pad Fm, Padeha Formation; Batt P Fm, Battery Point Formation; Pär and Rez Fms, Pärnu and Rēzekne Formations; Gau Fm, Gauja Formation; Ham gp, Hamilton Group and Esc Fm, Escuminac Formation. The stars in (f) indicate the locations of the two earliest fossil tetrapod trackways. Zachelmie is denoted by Z and Valentia Island as V (see §1 for details). (Online version in colour.)
Here, we explore the hypothesis that tides were an important environmental adaptive pressure. The influence of tides on the fish-tetrapod transition has been the subject of several studies by palaeontologists and developmental biologists [14–18], with Balbus [19] producing the most comprehensive intertidal hypothesis. The hypothesis, an elaboration on Romer's classical ‘drying pools’ hypothesis [20], is that as the tide retreated, fishes became stranded in shallow water tidal-pool environments, where they would be subjected to raised temperatures and hypoxic conditions. If there was a large spring–neap variation in tides, which today occurs on a 14-day cycle, individuals trapped in upper-shore pools during spring tides could be stranded for several days or considerably longer, depending on the beat frequency of the solar and lunar tides. This would select for efficient air-breathing organs, as well as for appendages adapted for land navigation, so that the fish could make their way to more frequently replenished pools closer to the sea. Experimental rearing of Polypterus (a basal member of actinopterygians, the sister group to sarcopterygians) in terrestrial conditions results in single-generation morphological adaptation to terrestrial locomotion by means of developmental plasticity [18], suggesting that environmental factors are powerful drivers of such evolutionary changes. While the expanse of estuaries and deltas is largely controlled by long-term sea-level fluctuations, a large tidal range would also help to maintain such regions, which provide an ideal transitory environment for the terrestrialization of tetrapods. Many of the earliest tetrapods, as well as the transitional ‘elpistostegalians’ Panderichthys and Elpistostege (though not Tiktaalik), are found in sediments identified as deltaic or estuarine [2,21–23], and isotopic evidence supports a lifestyle adapted to a wide range of salinities [24]. Furthermore, a recent study on ancestral vertebrate habitats has suggested that many early vertebrate clades originated in shallow intertidal–subtidal environments [25].
Here, we investigate whether there is a detailed hydrodynamic basis for inferring that large tides did indeed exist during the Late Silurian to the early Late Devonian in locations where evidence for early osteichthyans and early tetrapods have been found. We have used recent global palaeogeographic reconstructions [26] for the Late Silurian (420 Ma), early Middle Devonian (400 Ma) and early Late Devonian (380 Ma) in an established state-of-the-art numerical tidal model [27–29]. We evaluate the two dominant components of the contemporaneous tide: the principal lunar constituent (M2) and the principal solar constituent (S2) to allow us to compute spring–neap range variability. Neap tides occur when M2 and S2 are out of phase, and spring tides when they are in phase, so the spring–neap range difference is equal to the range of S2. We also discuss the simulated tidal ranges for both tidal constituents. We focus on two geographical areas in the reconstructions: the South China region for the 420 Ma time slice, and Laurussia for the 400 Ma time slice (see figure 1 for details), because of their respective associations with the earliest osteichthyans and the earliest trace fossil evidence of tetrapods in the form of trackways [1,7,8]. The 380 Ma time slice is included to encompass the period in which body fossils of elpistostegalians occur, during the late Givetian to mid-Frasnian. Like the earliest tetrapod trackways, two of the three main elpistostegalid genera (Panderichthys and Elpistostege) occur along the Southern coastline of Laurussia [30,31]. Note that the South China region for our study includes Indochina, as there is evidence that the South China and Indochina blocks were linked due to the presence of similar fauna in the fossil record [32] (figure 1b,e). To test the robustness of our simulation outputs, we have identified three tidal proxies for each time slice which we will use for comparison [22,33,34–49]. Details of the proxies are discussed in more detail in the Material and methods section and comparisons discussed in §3 (figure 1 and table 1).
Table 1.
Information on tidal proxy deposits used to compare with tidal simulation outputs.
| geological stage | deposit name | present day location | palaeo-location | palaeoenvironment description | tidal regime |
|---|---|---|---|---|---|
| Pridoli (423–419 Ma) | Keziertage Formation | Xianjiang, China | Tarim block, Gondwana | Tidal flats | meso to macro |
| Pridoli–Lockhovian (∼419 Ma) | Karheen Formation | Alaska, USA | West Laurussia | Tidal flats | meso to macro |
| Early Lockhovian (419–415 Ma) | Manlius Formation | New York, USA | South Laurussia | Lagoon | micro |
| Late Emsian (400–393 Ma) | Battery Point Formation | Quebec, Canada | South Laurussia | Tidally influenced delta | micro to meso |
| Emsian–Eifelian (∼393 Ma) | Padeha Formation | Iran (Central) | Central Iran block, Gondwana | Tidal flats | meso to macro |
| Emsian–Eifelian (∼395–390 Ma) | Pärnu and Rēzekne Formations | Estonia, Lithuania and Latvia | South-East Laurussia | Tidally dominated delta/estuarine | meso to macro |
| Late Givetian (385–383 Ma) | Gauja Formation | Estonia, Lithuania, Latvia and Russia | South-East Laurussia | Tidally influenced delta | micro to meso |
| Givetian (388–383 Ma) | Hamilton Group | New York, Pennsylvania, Maryland, Ohio, W.Virginia, USA | South-West Laurussia | Epeiric sea with extensive coral reefs | micro |
| Middle Frasnian (∼378 Ma) | Escuminac Formation | Quebec, Canada | South Laurussia | Wave-dominated estuary | micro |
2. Materials and methods
(a). Tidal modelling
The tides for the periods of interest were simulated using the Oregon State University Tidal Inversion Software (OTIS), which has been used extensively to simulate deep-time, PD and future tides [27–29,50,51]. OTIS provides a numerical solution to the linearized shallow water equations, with the nonlinear advection and horizontal diffusion excluded without a loss in accuracy [27]:
| 2.1 |
and
| 2.2 |
Here, f is the Coriolis parameter, U = uH is the depth-integrated volume transport where u is the horizontal velocity vector and H is the water depth, η represents the surface elevation from rest, ηSAL is the self-attraction and loading elevation, ηEQ is the elevation of the equilibrium tide and F the tidal dissipative term. This is split into two parts describing to bed friction and tidal conversion, respectively, i.e. F = FB + FW. Bed friction is parameterized through the standard quadratic law: FB = Cdu|u|, where Cd = 0.009 is a drag coefficient. The second term, Fw, represents the energy loss due to tidal conversion, and can be written Fw = CU. The conversion coefficient, C, was computed from [52]
| 2.3 |
Here, γ (=50) represents a scaling factor accounting for unresolved topographic roughness, NH is the buoyancy frequency at the seabed, represents the vertical average of the buoyancy frequency and ω is the frequency of the tidal constituent under evaluation. The buoyancy frequency was based on a statistical fit of that observed at PD, i.e. where N0 = 0.00524 s−1 and L = 1300 m have been determined from statistical fits to the PD ocean stratification [52]— see below for a discussion about the sensitivity to stratification.
(b). Simulations and bathymetric data
Close to 100 simulations have been generated using five different reconstructions of the bathymetry for PD, and for the 420 Ma, 400 Ma and 380 Ma time slices. To replicate the relevant tidal forcing for the past time slices, the equilibrium tidal elevation and frequency of the tidal constituents were altered. These constituents allow the calculation for the tidal range and spring–neap range. For the Late Silurian (420 Ma), the M2 period used was 10.91 h and the S2 period was 10.5 h. For the early Middle Devonian (400 Ma), slightly longer periods of 10.98 h for M2 and 10.7 h for S2 were used, whereas the early Late Devonian (380 Ma) had an M2 period of 11.05 h and an S2 period of 11.0 h. These numbers are based on small changes to a contemporaneous lunar semi-major axis of 365 000 km, and are consistent with studies on Silurian–Devonian corals and brachiopods growth increments [19,53,54] (simulations run with PD values for these parameters show qualitatively similar overall results). Because the orbital periods are directly related to lunar distance, we increased the corresponding lunar force by 15%, but did not allow for this to vary between the time slices.
The bathymetric dataset for the PD simulations were a conglomerate of version 14 of the Smith and Sandwell topographic database [55], along with updated bathymetries for regions north of 79°N from IBCAO [56] and south of 79°S from Padman et al. [57]. The combined dataset was averaged to 1/4° in both latitude and longitude, to match that of the palaeobathymetry data. Simulations with this bathymetry are referred to as ‘PD control’.
There are several reconstructions of the palaeogeography available for the time periods in question [58–60]. We have used the latest products from Deeptime Maps [26], representing 420 Ma for the Late Silurian (Pridoli–Lochkovian), 400 Ma for the late Early Devonian (Emsian) and 380 Ma for the early Late Devonian (Middle Frasnian) [61]. There is a difficulty to directly turn the maps into numerical model grids due to a lack of bathymetry depth information for the deep time slices, beyond what is included in the published reconstructions. We have quantified the oceanic bathymetry using step-changes in depths of 150 m, 300 m, 800 m for the continental shelf, and a 4200 m deep abyssal plain. We refer to this simulation as ‘control’ in the following. The assumption for this choice of depths is that the period of study is at a similar point in the super-continent cycle as PD, so the age of the oceanic plates would be comparable between the Devonian and PD [58,62]. This means that the mean depths of the abyssal plain and continental shelfs should be similar for both; this underpins our control bathymetry set (see figure 1 for the 420 Ma and 400 Ma control bathymetries). The bathymetry outlines (e.g. what are shelf seas, continental slope) is determined by the palaeogeographic reconstructions. Because of the poorly constrained depths in the past reconstructions, we did a suite of sensitivity simulations where the depths were modified to check the robustness of our results. These are referred to as ‘shallow’ and ‘deep’ and have the depths shallower than 800 m from the mid-bathymetries halved or doubled, respectively. We also did a set of simulations were water shallower than 150 m in the mid-bathymetries were set to land (testing sensitivity to coastline locations), another two sets of simulations where water shallower than 800 m in the mid-bathymetries were set to wither 800 m or 150 m, respectively. We refer to these three sets as ‘no shelf’, ‘deep shelf’ and ‘shallow shelf’.
Stratification is also poorly constrained because there are as yet no ocean model simulations of the period published (although some are in progress). It has been shown that the tides are relatively insensitive to the buoyancy frequency, within an order of magnitude or so from PD values [27,51]. Consequently, we used the standard globally averaged buoyancy profile used before [52] in our simulations as well, and then did a series of sensitivity tests to explore robustness. In the sensitivity simulations, which were done for all six bathymetries (shallow, mid and deep, and no shelf, shallow shelf and deep shelf) for all three time slices, with the buoyancy frequency halved or doubled (implemented by setting γ = 25 or γ = 100 in equation (2.3)). As ongoing ocean model experiments are able to produce progressively more reliable estimates of Devonian stratification, we will revisit the details of our computations. For now, the sensitivity simulations show a degree of robustness that warrants the support of our emphasis on the role of tides in the evolution of osteichthyans and early tetrapods. In the following, we focus the discussion on the mid-bathymetry simulations with γ = 50 and introduce the shallow and deep simulations in the discussions. The shelf simulations, and the stratification sensitivity simulations are mainly used for statistics of the robustness of the tidal dynamics.
(c). Validation and present day sensitivity simulations
We also introduced degraded PD bathymetries based on the method for the Devonian simulations. In these, the same depth ranges were used as in the Devonian bathymetries, i.e. any water shallower then 150 m was set to 150 m, anything in the range 150–300 m or 300–800 m was set to 300 m and 800 m, respectively, and anything deeper than 800 m was set to 4200 m (our abyssal depth). We refer to this as PD mid, and again computed deep and shallow bathymetries as above.
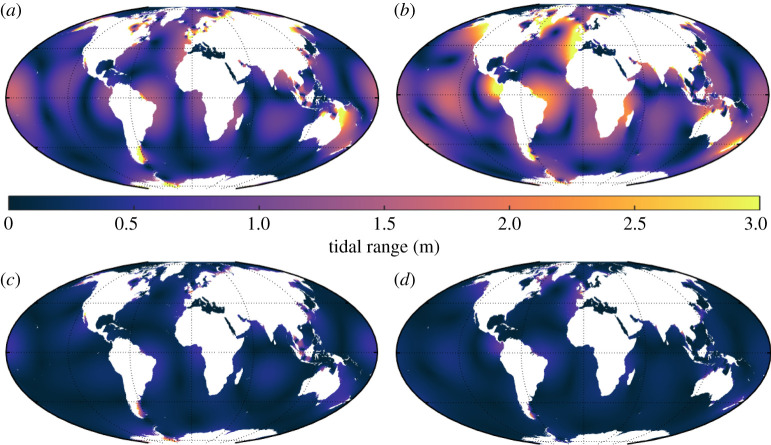
The model output consists of the amplitudes and phases of the surface elevations and velocities for each simulated tidal constituent. Both the PD control simulation and degraded PD simulation, shown in figure 2, were then compared to the TPXO9 satellite altimetry constrained product [63] (available from https://www.tpxo.net/global), giving a globally averaged root-mean-square (RMS) error of 12 cm and 20 cm, respectively, for the M2 amplitudes. The results suggested that we should expect an over-estimate in tidal ranges located in shelf seas for our palaeotidal simulations. In the following, we discuss a classification of tidal ranges, and say that micro-tidal refers to a range of 0–2 m, a meso-tidal range is 2–4 m, a macro-tidal range sits between 4–8 m and a mega-tidal range is larger than 8 m.
Figure 2.
(a,b) show the modelled M2 tidal ranges (in metres) for the PD control (a) and PD reconstructed simulations (b). The RMS error values between the modelled and the TPXO M2 amplitudes are approximately 12 cm for PD and approximately 20 cm for PD reconstructed. (c,d) as in (a) and (b) but for the S2 constituent. (Online version in colour.)
(d). Tidal proxies
The extraction of palaeotidal data from the geological record can be difficult and uncertain, but there are tidal deposits described in the literature for the periods of study. Here, we have identified three deposits per time slice that can be used to test the robustness of our simulations. We have used the tidal depositional systems and relative tidal ranges classification from Longhitano et al. [64] to quantify tidal regimes represented in the tidal deposits. Details of the tidal proxies are summarized below and also in table 1, and the palaeo-locations of the proxies can be seen in figure 1.
For the 420 Ma time slice, two of the tidal proxies are situated in Laurussia and one near Gondwana (figure 1 and table 1). The Keziertage Formation is part of the Tarim Basin, which belongs to the Late Pridoli (420 Ma) as determined by zircon dating, and represents a tidal flat environment, likely representing a meso–macro (i.e. larger than 2 m) tidal regime [39,48]. The Manlius Formation is a lagoonal deposit from the Silurian–Devonian boundary at around 419 Ma, currently situated in New York, USA, and represents a micro-tidal regime [35,38]. The Karheen Formation dates to the Early Lochkovian (around 419–415 Ma), is located in present day Prince of Wales Island, Alaska, and is an intertidal flat deposition likely representing a meso–macro-tidal regime [33,42].
For the 400 Ma time slice, two of the proxies are again from Laurussia and one from Gondwana (figure 1 and table 1). The Battery Point Formation of Eastern Canada, dating to the Late Emsian (approx. 400–393 Ma), is a deposit made of sedimentary structures representing a meso-tidal environment [37,44]. The Padeha Formation, dating to the Emsian–Eifelian boundary (approx. 393 Ma), belongs to the Central block of Iran and is a tidal flat deposit, likely showing a meso–macro-tidal regime [47,49]. The Rēzekne and Pärnu Formations, dating to the Late Emsian to Early Eifelian (approx. 395–390 Ma), belong to the Baltic Basin (BB), a vast delta which measured about 250 × 500 km [40,43]. These formations indicate that the delta was tidally dominated at this stage, suggesting a meso–macro-tidal regime [45,46].
For the 380 Ma time slice, all three proxies are located in Laurussia (see figure 1 and table 1). The Gauja Formation is also part of the succession of deposits from the Baltic Delta, dating to the Late Givetian (approx. 385–383 Ma) [40]. It indicates that the Baltic Delta has gone from being tidally dominated, as shown in the earlier Rēzekne and Pärnu Formations, to being tidally influenced, and hence experiencing a shift to a micro–meso-tidal regime (0–4 m) [43,45]. The Appalachian Foreland basin, now in the Eastern USA, was a large epeiric sea, and is well-known for containing vast coral reef systems and several shale deposits in the Hamilton Group from the Givetian (388–383 Ma), indicative of a micro-tidal regime [34,41]. Lastly, the Escuminac Formation from Eastern Canada, is well-known as the location for the elpistostegalian Elpistostege watsoni and tetrapodomorph fish Eusthenopteron foordi. The deposit dates to the Middle Frasnian (approx. 378 Ma) and represents a wave-dominated estuary associated with a micro-tidal regime [22,36].
The positioning of the proxy locations on the relevant palaeogeographic reconstructions were done using the PD locations of each proxy in conjunction with palaeogeographic reconstructions which had PD country outlines superimposed, which were provided from Deeptime Maps [26]. Precise placement of the tidal proxy locations on the palaeogeographic reconstructions was unattainable due to the coarse resolution of the reconstructions, and so the location markers are approximate. In the future, we plan to have higher-resolution simulations concentrated in these regions with higher-resolution and smaller-scale palaeogeographic reconstructions.
3. Results
(a). 420 Ma
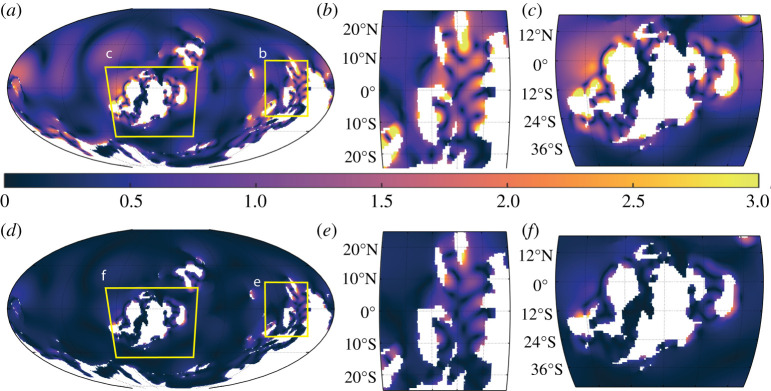
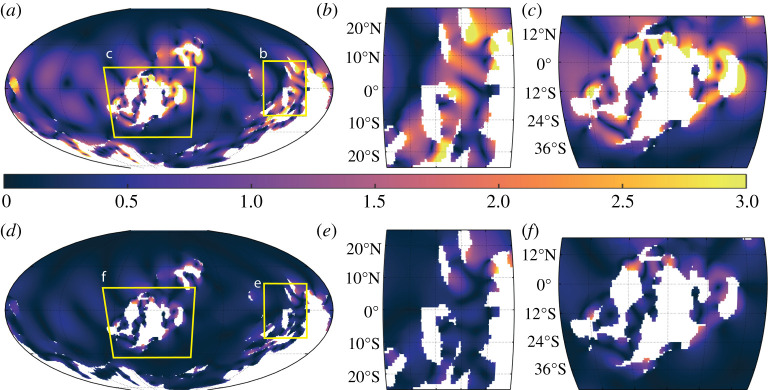
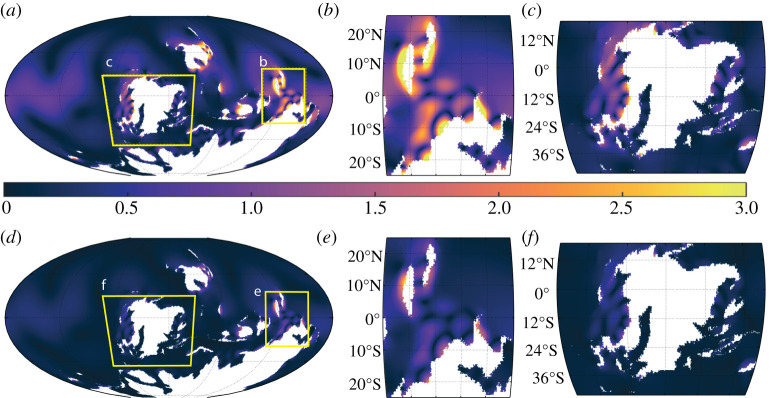
In the 420 Ma control simulation, the M2 tidal response shows several localized macro-tidal areas near West and East Laurussia, and around East Siberia (figure 3a and table 2). Several distinct macro-tidal areas are also found around East Gondwana, with the majority occurring in our region of interest (figure 3b). The maximum M2 range for the South China region is mega-tidal and is located around the Indochina block (table 2 and figure 3b). The M2 tide is generally weak away from coastlines and in the strait between the middle and west islands of Laurussia, although we find the maximum global M2 range at West Laurussia (13 m, figure 3c and table 2). Meso-tidal spring–neap ranges are seen in multiple areas throughout Laurussia and Gondwana, occurring in areas where M2 macro-tidal ranges are found (figure 3d–f). As seen in figure 3f, Laurussia is home to several meso-tidal areas, reaching almost macro-tidal ranges along West Laurussia (table 2). The South China region has three distinct meso-tidal spring–neap range areas, with a maximum of over 3 m reached around Indochina (figure 3e and table 2). The meso-tidal ranges, or larger, in both M2 and S2 tides around the South China region show a large tidal variability occurring in the region and at the time of the origin and diversification of osteichthyans.
Figure 3.
The 420 Ma simulation with tidal range (colour, range in metres) for M2 (a–c) and S2 (d–f). Enlarged areas of evolutionary interest are shown in (b) and (e) for the South China region and (c) and (f) for Laurussia. Note that the S2 range is equal to the spring–neap range difference, so panels (d–f) show the spring–neap range difference as well. (Online version in colour.)
Table 2.
Tidal range statistics from the three time slices. ‘avg.’ and ‘max’ refers to average and maximum range for each constituent within each region, respectively. The South China and Laurussia areas refer to the boxes in panels b/e and c/f in figure 2. For the global mid simulations, the standard deviation of all sensitivity simulations is given alongside the average.
| time period | bathymetry | region | avg. M2 (m) | max M2 (m) | avg. S2 (m) | max S2 (m) |
|---|---|---|---|---|---|---|
| 420 Ma | mid | Global | 0.5 ± 0.2 | 11.9 | 0.2 ± 0.1 | 3.6 |
| S.China | 0.9 | 6.2 | 0.4 | 3.4 | ||
| Laurussia | 0.7 | 10.5 | 0.3 | 3.2 | ||
| shallow | Global | 0.4 | 6.7 | 0.2 | 2.9 | |
| S.China | 0.6 | 5.3 | 0.3 | 2.4 | ||
| Laurussia | 0.6 | 6.0 | 0.2 | 2.2 | ||
| deep | Global | 0.5 | 9.1 | 0.2 | 3.1 | |
| S.China | 1.0 | 6.9 | 0.3 | 3.0 | ||
| Laurussia | 0.8 | 8.6 | 0.3 | 2.5 | ||
| 400 Ma | mid | Global | 0.4 ± 0.2 | 11.6 | 0.1 ± 0.1 | 3.3 |
| S.China | 0.6 | 7.2 | 0.3 | 2.0 | ||
| Laurussia | 0.4 | 5.9 | 0.1 | 2.2 | ||
| shallow | Global | 0.3 | 6.7 | 0.1 | 2.6 | |
| S.China | 0.5 | 3.8 | 0.2 | 2.3 | ||
| Laurussia | 0.3 | 6.6 | 0.1 | 2.0 | ||
| deep | Global | 0.4 | 9.9 | 0.2 | 3.5 | |
| S.China | 1.0 | 9.4 | 0.4 | 3.3 | ||
| Laurussia | 0.6 | 6.8 | 0.2 | 1.6 | ||
| 380 Ma | mid | Global | 0.3 ± 0.2 | 10.0 | 0.1 ± 0.1 | 3.5 |
| S.China | 0.9 | 8.7 | 0.3 | 3.1 | ||
| Laurussia | 0.3 | 5.9 | 0.1 | 2.1 | ||
| shallow | Global | 0.4 | 6.2 | 0.2 | 2.2 | |
| S.China | 0.8 | 4.1 | 0.3 | 1.5 | ||
| Laurussia | 0.3 | 3.0 | 0.1 | 1.1 | ||
| deep | Global | 0.6 | 10.6 | 0.2 | 3.9 | |
| S.China | 1.4 | 7.2 | 0.5 | 2.8 | ||
| Laurussia | 0.6 | 10.5 | 0.2 | 3.8 |
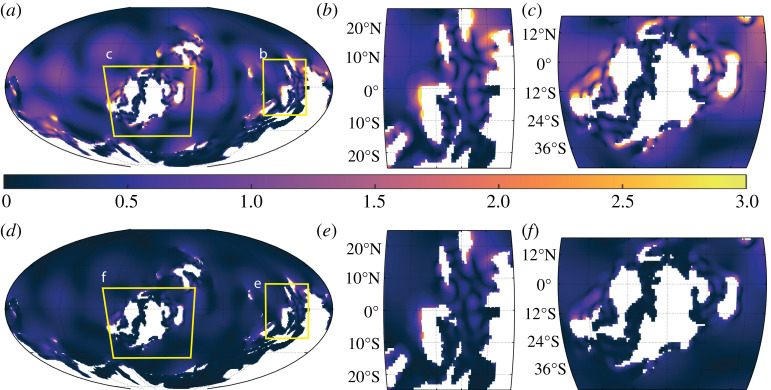
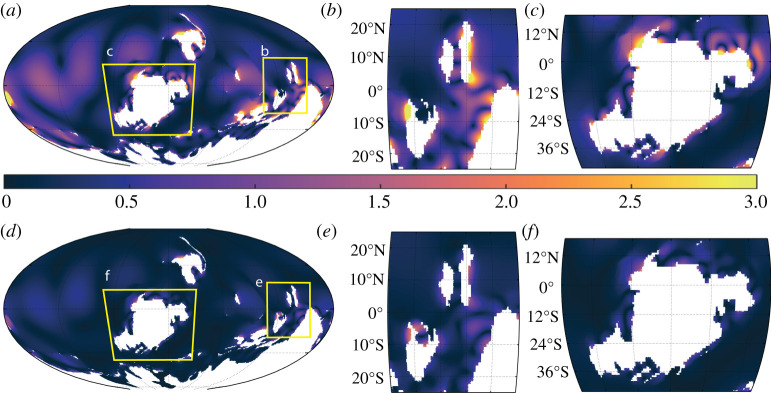
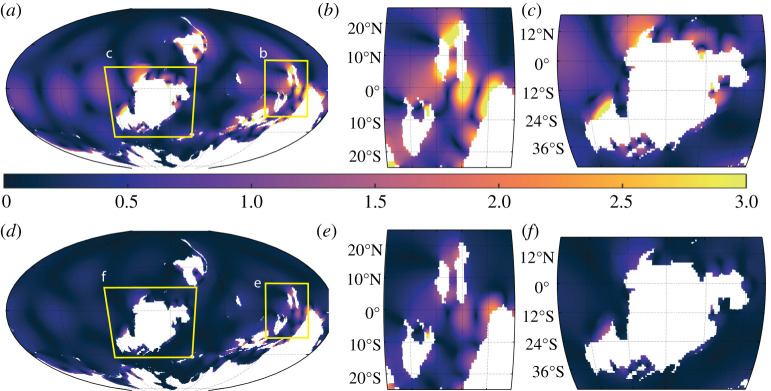
The depth sensitivity simulations show a similar picture in terms of the spatial patterns, but there are expected variations in range. For the 420 Ma shallow bathymetry simulation, the M2 tide is much less energetic compared to the control, particularly around East Gondwana (cf. Figure 3a and c, and figure 4c). There are again meso-tidal spring–neap ranges found in the M2 macro-tidal areas, having the same global average and a reduced maximum range compared with the control (table 2 and figure 4d). By contrast, the deep bathymetry simulation is much more tidally energetic (i.e. experiences larger tidal ranges) for M2, with more and larger macro-tidal areas seen around the coastlines of all three continents (figure 5). This trend is also observed for the spring–neap range (figure 5d–f).
Figure 4.
As in figure 3 but for the shallow bathymetry. (Online version in colour.)
Figure 5.
As in figure 3 but using the deep bathymetry. (Online version in colour.)
The globally averaged M2 ranges for the control and shallow bathymetries are similar (0.4 m and 0.5 m, respectively), whereas the deep bathymetry comes in at 0.7 m (table 2). The maximum M2 range found in the 420 Ma simulations vary from 7.9 to 13 m, and it is evident that the deep bathymetry creates a general amplification of the M2 and S2 tide (table 2 and figure 5). However, despite this global amplification, the maximum values for both the M2 and spring–neap ranges are lower than the control simulation (table 2).
(b). 400 Ma
For the 400 Ma control simulation, there are several M2 macro-tidal areas located along North Laurussia and Siberia and around East Gondwana (figure 6a–c). There is one distinct macro-tidal region around South China, with several more localized upper meso-tidal ranges around Indochina, with the region being less energetic compared with the 420 Ma control simulation (figures 3b, 6b and table 2). Around Laurussia, there are several macro-tidal areas across the north, with a weaker M2 tide in the south (figure 6c). This simulation shows a weakened M2 tide along the south and west coast of Laurussia between 420 and 400 Ma (figure 6 and table 2). The spring–neap range at 400 Ma shows a similar distribution as in the 420 Ma control simulation, located in M2 macro-tidal areas (compare figure 6d for 400 Ma with figure 3d for 420 Ma). The South China region (figure 6e) again experiences a smaller spring–neap range compared to that in the 420 Ma control simulation; it also has a smaller average and maximum range (cf. figures 3e and 6e, and table 2). As in South China, the spring–neap range is smaller around much of Laurussia compared to in the 420 Ma control simulation (cf. Figure 6e and figure 3e).
Figure 6.
As in figure 3 but for the 400 Ma simulation. (Online version in colour.)
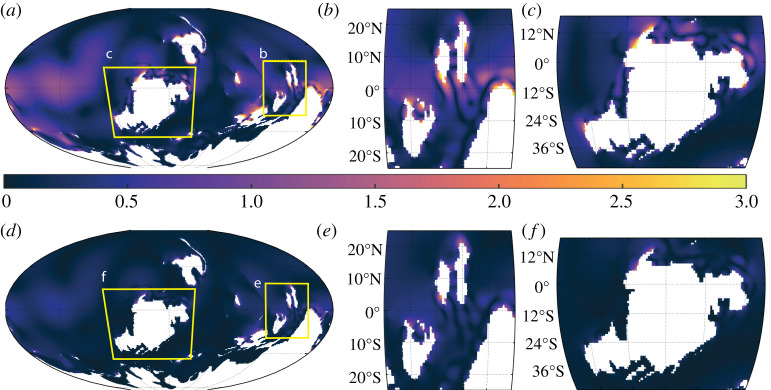
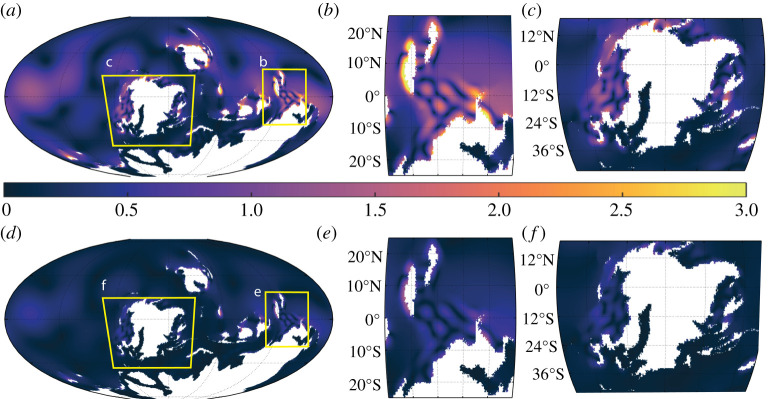
The 400 Ma shallow bathymetry simulation is much less energetic, for both the M2 and S2 tide, than the control and deep bathymetry simulations of the same time slice (figure 7 for the shallow 400 Ma simulation results and figure 8 for the deep simulation). There are fewer M2 macro-tidal areas and they are more localized, with the global average M2 range being some 75% of that found in the control and deep bathymetry simulations (table 2). A similar trend occurs for the spring–neap range (figures 6–8, table 2). The Deep 400 Ma bathymetry simulation is similar to that of the control bathymetry for both M2 and S2. For Laurussia, the M2 tide appears to be less energetic around the north coast and more energetic towards the west and south coast, with a macro-tidal range occurring at the BB (see figure 1 for location and figures 6c and 8c for the tidal ranges). The South China region is more tidally energetic in the deep bathymetry simulation, with the global maximum M2 range occurring here (figure 8b and table 2). Globally, the spring–neap range is largest in the deep bathymetry simulation, with the maximum found in East Gondwana (table 2).
Figure 7.
As in figure 6 but using the shallow bathymetry. (Online version in colour.)
Figure 8.
As in figure 6 but for the deep bathymetry. (Online version in colour.)
(c). 380 Ma
The simulation for 380 Ma shows a slightly reduced global tidal range for both M2 and S2 (figure 9 and table 2) compared with simulations from the other two time slices, whereas the tides in South China and Laurussia are on par with those in the 400 Ma simulation of the same region. There are, however, a few local hotspots in the 380 Ma simulations, where the islands in the north-west (part of the domain in figure 9b) experience M2 macro-tidal ranges over 8 m. Around Laurussia, the tides are still macro-tidal, albeit weaker than in the earlier time slices.
Figure 9.
As in figure 3 but for the 380 Ma simulation. (Online version in colour.)
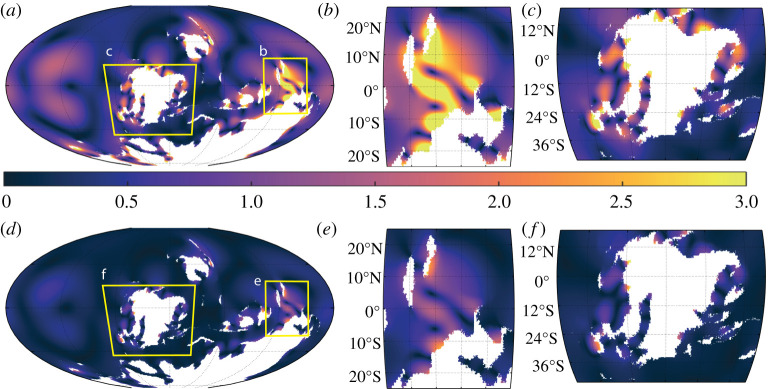
The 380 Ma shallow simulation has a similar global tidal range output as the control simulation, though produces lower maximum ranges for both M2 and S2, with a similar trend observed in the regions of interest (figure 10 and table 2). The deep simulation (figure 11 and table 2) is more energetic than both the control and shallow bathymetry simulations, producing tidal ranges comparable with the deep bathymetry simulations from the previous two time slices.
Figure 10.
As in figure 9 but using the shallow bathymetry. (Online version in colour.)
Figure 11.
As in figure 9 but using the deep bathymetry. (Online version in colour.)
(d). Proxy comparisons
The 420 Ma control simulation fits best with the tidal proxy ranges for the time, with macro-tidal ranges occurring in the Karheen Formation region, micro-tidal ranges at the Manlius Formation region and macro-tidal ranges at the Keziertage Formation region (see figures 1 and 3, table 1). In the shallow bathymetry simulation, tidal ranges for both the Karheen and Keziertage Formation locations are smaller than the proxy ranges and for the deep bathymetry simulation, the Keziertage Formation region has smaller ranges than the proxy (see figures 1, 4 and 5, table 1). For the 400 Ma simulations, the control matches reasonably well with all three proxies: it shows a meso-tidal regime at the Battery Point Formation locality and a meso-tidal regime in the region of the Padeha Formation (figures 1 and 6, table 1). However, the control simulation does not agree with the tidal proxy of the Rēzekne and Pärnu Formations. The proxy represents a meso–macro-tidal regime, with the simulation showing micro-tidal conditions. The shallow bathymetry simulation produces tidal ranges smaller than all three proxy tidal regimes and the although the deep bathymetry fits well with both the Pärnu and Rēzekne and the Padeha Formation proxies, it does not fit with the Battery Point Formation proxy, with the simulation underestimating the tidal regime at that location (figures 1, 7 and 8, table 1). In the 380 Ma time slice, the control simulation fits well with all three proxies, with micro-tidal regimes for the Escuminac Formation and Hamilton Group regions and a micro–meso-tidal regime occurring in the BB area, where the Gauja Formation is located (figures 1 and 9, table 1). The shallow bathymetry simulation is less tidally energetic than the control simulation, and also fits well with the three proxies, though has a slightly smaller tidal range output in the BB region (figures 1 and 10, table 1). The deep bathymetry produced tidal regimes much greater than the tidal proxies, particularly in the region of the Escuminac Formation (figures 1 and 11, table 1).
4. Discussion and conclusion
The earlier time slices for our period of study (420–400 Ma) and PD are believed to be at roughly similar central points in their respective super-continental cycles [58,62], whereas the 380 Ma slice is closer to the formation of a supercontinent (Pangea in this case) than we currently are [62]. This central position in the cycle is associated with multiple ocean basins, and thus an increased chance of ocean resonances in one or multiple basins which would lead to the tides becoming more energetic [65]. At present we are experiencing a tidal maximum due to the near resonance of the North Atlantic [66], whereas the period of study occurs after a tidal maximum, shown in other simulations to have occurred at around 440 Ma ([24,56], and D. Hadley-Pryce, personal communication). This is important as tides can be sensitive to small-scale changes in bathymetry when the ocean is near resonance [27], but as this is not the case for our period of study, our results are not prone to this sensitivity [29]. The similar positioning within a super-continent cycle of our period of study with PD would also suggest that the contemporaneous oceanic crust would have been of similar age to the PD crust; consequently, we based the control bathymetry on PD bathymetry values. The sensitivity simulations show that the results are generally robust when the depths are changed.
The control simulation produces the best fit for the three tidal proxies for 420 Ma, and although only the deep bathymetry simulation produced a meso-tidal regime matching the BB tidal proxy for 400 Ma, it is not a representative bathymetry for this time slice. This is due to the early Middle Devonian being in a period of lowered sea-level caused by marine regression occurring from the Late Silurian [13]. We therefore argue that the control simulation is still a valid baseline for the 400 Ma time slice. Higher-resolution simulations are required to resolve the tides of the BB for the control bathymetry, as it is common for the local full tidal range not to be captured in global tidal simulations, like the Bay of Fundy of the PD, which is dominated by a small-scale resonance [67]. For the 380 Ma time slice, the control simulation also fits well with the three tidal proxies for that period, as does the shallow bathymetry simulation.
For the 420 Ma time slice, the South China region is consistently associated with multiple M2 macro-tidal areas across the sensitivity simulations. Furthermore, multiple spring–neap meso-tidal areas also persist, implying a large tidal variability during the time of the origin of osteichthyans [7]. It should also be noted that a macro-tidal regime also occurs along the coastline of Indochina in conjunction with South China. Combined with evidence of shared fauna between the two blocks, this warrants further palaeontological exploration of PD countries belonging to the Indochina block: Vietnam, Laos, Cambodia and Thailand. The Van Canh and Dong Tho sandstone Formations, which represent the Silurian–Devonian of Eastern Indochina, show indications of extensive tidal zones and are associated with early dipnomorph fish (members of the lungfish lineage, the extant sister group to tetrapods) [32,68].
In the 400 Ma time slice, the tidal regimes vary throughout the simulations in areas where the earliest tetrapod trackways are located in Southern Laurussia (see figures 6–8 for the following discussion), and these results are supported by the later 380 Ma simulation in figure 9—see also table 2. The Zachelmie trackway locality lies on the western margin of the entrance to the BB (marked in figure 1); in the control simulation, the BB is located in a micro-tidal area but changes to a macro-tidal area in the Deep bathymetry simulation. The BB was a shallow epicontinental sea which existed from the Silurian into the Early Carboniferous [45]. Tidal regimes within ancient epicontinental seas have been greatly debated, with arguments for the weakening of the propagating tide due to shallow depths and the vast expansion of the seaways, leading to micro-tidal conditions [69]. Offsetting this, other studies have found evidence for tide-domination in both extant and extinct epicontinental seas [70]. Numerical models of ancient seaways have produced varied results; the Late Devonian Catskill seaway of Southern Laurussia is expected to have experienced meso-tidal ranges, whereas largely micro-tidal conditions are expected in the Late Carboniferous seaway of NW Europe and the Early Jurassic Laurasian Seaway [71–73]. Tidalites from the Pärnu and Rēzekne Formations suggest a meso-macro-tidal regime, which will be investigated further in future studies using higher-resolution simulations for the BB [46].
Our principal conclusion is that simulations representing ocean tides for the time periods of the evolution of osteichthyans and the emergence of tetrapods are broadly consistent with the hypothesis that tides were an important environmental and evolutionary driver for these events. Of particular significance is the fact that those areas with some of the largest tidal ranges and tidal variability in the palaeotidal simulations coincide with fossil proxy sites, i.e. South China from 420 Ma. From the fossil record, it is apparent that tidal environments are closely associated with the fossils of elpistostegalians and stem-tetrapods. This stimulates the need for high-resolution tidal simulations to access tidal regimes in these regions in more detail, e.g. the BB and Escuminac Formation sites. Extended tidal simulation studies using a variety of palaeogeographic reconstructions at more finely sliced time intervals, as well as at higher spatial resolution around areas of palaeontological interest, will more fully elucidate whether differing tidal regimes are correlated with the origin and diversification of other early vertebrate clades [25]. More generally, establishing the role of palaeotides in influencing major evolutionary events is a field holding great promise, a novel blend of fluid dynamics and palaeobiology that is still very much in its infancy.
Supplementary Material
Acknowledgements
Simulations were done using Supercomputing Wales, and technical support from Ade Fewings is gratefully acknowledged. We thank Joao Duarte and Kara Matthews for their constructive feedback and to members of the Devonian tides team for many helpful discussions.
Data accessibility
The tidal simulation outputs are available from the corresponding author (H.M.B.).
Competing interests
We declare we have no competing interests.
Funding
H.M.B. and P.E.A. were supported by a Wallenberg Scholarship from the Knut and Alice Wallenberg Foundation, awarded to P.E.A. J.A.M.G. received support from the Natural Environmental Research Council (NERC) through grant no. NE/I030224/1. S.A.B. recognizes funding from the Hintze Family Charitable Foundation.
References
- 1.Niedwiedzki G, Szrek P, Narkiewicz K, Narkiewicz M, Ahlberg PE. 2010. Tetrapod trackways from the early Middle Devonian period of Poland. Nature 463, 43–48. ( 10.1038/nature08623) [DOI] [PubMed] [Google Scholar]
- 2.Ahlberg PE. 2018. Follow the footprints and mind the gaps: a new look at the origin of tetrapods. Earth Environ. Sci. Trans. R. Soc. Edinburgh 109, 115–137. ( 10.1017/S1755691018000695) [DOI] [Google Scholar]
- 3.Gingerich PD. 2003. Land-to-sea transition in early whales: evolution of Eocene Archaeoceti (Cetacea) in relation to skeletal proportions and locomotion of living semiaquatic mammals. Paleobiology 29, 429–454. () [DOI] [Google Scholar]
- 4.Savage RJG, Domning DP, Thewissen JGM. 1994. Fossil sirenia of the west Atlantic and Caribbean region. V. The most primitive known sirenian, Prorastomus sirenoides Owen, 1855. J. Vertebr. Paleontol. 14, 427–449. ( 10.1080/02724634.1994.10011569) [DOI] [Google Scholar]
- 5.Clack JA. 2012. Gaining ground: the origin and evolution of tetrapods, 2nd edn Bloomington, IN: Indiana University Press. [Google Scholar]
- 6.Perry SF, Wilson RJ., Straus C, Harris MB, Remmers JE. 2001. Which came first, the lung or the breath? Comp. Biochem. Physiol. A Mol. Integr. Physiol. 129, 37–47. ( 10.1016/S1095-6433(01)00304-X) [DOI] [PubMed] [Google Scholar]
- 7.Choo B, Zhu M, Zhao W, Jia L, Zhu Y. 2015. The largest Silurian vertebrate and its palaeoecological implications. Sci. Rep. 4, 5242 ( 10.1038/srep05242) [DOI] [PMC free article] [PubMed] [Google Scholar]
- 8.Stössel I, Williams EA, Higgs KT. 2016. Ichnology and depositional environment of the Middle Devonian Valentia Island tetrapod trackways, south-west Ireland. Palaeogeogr. Palaeoclimatol. Palaeoecol. 462, 16–40. ( 10.1016/J.PALAEO.2016.08.033) [DOI] [Google Scholar]
- 9.Retallack GJ. 2011. Woodland hypothesis for Devonian tetrapod evolution. J. Geol. 119, 235–258. ( 10.1086/659144) [DOI] [Google Scholar]
- 10.Farmer C. 1997. Did lungs and the intracardiac shunt evolve to oxygenate the heart in vertebrates? Paleobiology 23, 358–372. ( 10.1017/S0094837300019734) [DOI] [Google Scholar]
- 11.Colbert EH. 1955. Evolution of the vertebrates. A history of the backboned animals through time. New York, NY: John Wiley & Sons.
- 12.Edwards D. 1990. Constraints on Siluran and Early Devonian phytogeographic analysis based on megafossils. Geol. Soc. Lond. Mem. 12, 233–242. ( 10.1144/GSL.MEM.1990.012.01.22) [DOI] [Google Scholar]
- 13.Haq BU, Schutter SR. 2008. A chronology of Paleozoic sea-level changes. Science 322, 64–68. ( 10.1126/science.1161648) [DOI] [PubMed] [Google Scholar]
- 14.Schultze HP. 1997. Umweltbedingungen beim Übergang von Fisch zu Tetrapode [Paleoenvironment at the transition from fish to tetrapod]. Sitzungsberichte der Gesellschaft Naturforschender Freunde zu Berlin 36, 59–77. [Google Scholar]
- 15.Gordon MS. 1998. African amphibious fishes and the invasion of the land by the tetrapods. S. Afr. J. Zool. 33, 115–118. ( 10.1080/02541858.1998.11448460) [DOI] [Google Scholar]
- 16.You X, et al. 2014. Mudskipper genomes provide insights into the terrestrial adaptation of amphibious fishes. Nat. Commun. 5, 5594 ( 10.1038/ncomms6594) [DOI] [PMC free article] [PubMed] [Google Scholar]
- 17.George D, Blieck A. 2011. Rise of the earliest tetrapods: an Early Devonian origin from marine environment. PLoS ONE 6, e22136 ( 10.1371/journal.pone.0022136) [DOI] [PMC free article] [PubMed] [Google Scholar]
- 18.Standen EM, Du TY, Larsson HCE. 2014. Developmental plasticity and the origin of tetrapods. Nature 513, 54–58. ( 10.1038/nature13708) [DOI] [PubMed] [Google Scholar]
- 19.Balbus SA. 2014. Dynamical, biological, and anthropic consequences of equal lunar and solar angular radii. Proc. R. Soc. A 470, 20140263 ( 10.1098/rspa.2014.0263) [DOI] [Google Scholar]
- 20.Romer AS. 1933. Man and the vertebrates. Chicago, IL: University of Chicago Press. [Google Scholar]
- 21.Luksevics E, Zupins I. 2004. Sedimentology, fauna, and taphonomy of the Pavâri site, Late Devonian of Latvia. Acta Univ. Latv. 679, 99–119. [Google Scholar]
- 22.Cloutier R, Proust JN, Tessier B. 2011. The Miguasha Fossil-Fish-Lagerstätte: a consequence of the Devonian land-sea interactions. Palaeobiodiversity Palaeoenvironments 91, 293–323. ( 10.1007/s12549-011-0058-0) [DOI] [Google Scholar]
- 23.Daeschler EB, Shubin NH, Jenkins FA. 2006. A Devonian tetrapod-like fish and the evolution of the tetrapod body plan. Nature 440, 757–763. ( 10.1038/nature04639) [DOI] [PubMed] [Google Scholar]
- 24.Goedert J, et al. 2018. Euryhaline ecology of early tetrapods revealed by stable isotopes. Nature 558, 68–72. ( 10.1038/s41586-018-0159-2) [DOI] [PubMed] [Google Scholar]
- 25.Sallan L, Friedman M, Sansom RS, Bird CM, Sansom IJ. 2018. The nearshore cradle of early vertebrate diversification. Science 362, 460–464. ( 10.1126/science.aar3689) [DOI] [PubMed] [Google Scholar]
- 26.Blakey R. 2014. Global Paleogeography and Tectonics in Deep Time – Deep Time MapsTM.
- 27.Egbert GD, Bills BG, Ray RD. 2004. Numerical modeling of the global semidiurnal tide in the present day and in the last glacial maximum. J. Geophys. Res. 109, C03003, 10.1029/2003JC001973. [DOI] [Google Scholar]
- 28.Green JAM, Huber M. 2013. Tidal dissipation in the early Eocene and implications for ocean mixing. Geophys. Res. Lett. 40, 2707–2713. ( 10.1002/grl.50510) [DOI] [Google Scholar]
- 29.Green JAM, Huber M, Waltham D, Buzan J, Wells M. 2017. Explicitly modelled deep-time tidal dissipation and its implication for Lunar history. Earth Planet. Sci. Lett. 461, 46–53. ( 10.1016/J.EPSL.2016.12.038) [DOI] [Google Scholar]
- 30.Ahlberg P, Lukševičs E, Mark-Kurik E. 2000. A near-tetrapod from the Baltic Middle Devonian. Palaeontology 43, 533–548. ( 10.1111/j.0031-0239.2000.00138.x) [DOI] [Google Scholar]
- 31.Cloutier R, Clement AM, Lee MSY, Noël R, Béchard I, Roy V, Long JA. 2020. Elpistostege and the origin of the vertebrate hand. Nature 579, 549–554. ( 10.1038/s41586-020-2100-8) [DOI] [PubMed] [Google Scholar]
- 32.Thanh T-D, Janvier P, Phuong TH. 1996. Fish suggests continental connections between the Indochina and South China blocks in Middle Devonian time. Geology 24, 571 () [DOI] [Google Scholar]
- 33.Abushik AF, Blodgett RB, Baranoc VV. 2016. The first early Lochkovian ostracods in redbeds of the Karheen formation of Prince of Wales Island (Southeast Alaska). New Mex. Museum Nat. Hist. Sci. Bull. 74, 1–4. [Google Scholar]
- 34.Brett CE, Bartholomew AJ, Baird GC. 2007. Biofacies recurrence in the Middle Devonian of New York State: an example with implications for evolutionary paleoecology. Palaios 22, 306–324. ( 10.2110/palo.2005.p05-027r) [DOI] [Google Scholar]
- 35.Browne KM, Demicco RV. 1988. Thrombolites of the lower Devonian Manlius Formation of central New York. Carbonates Evaporites 2, 149–155. ( 10.1007/BF03174314) [DOI] [Google Scholar]
- 36.Cloutier R, Loboziak S, Candilier AM, Blieck A. 1996. Biostratigraphy of the upper Devonian escuminac formation, eastern Quebec, Canada: a comparative study based on miospores and fishes. Rev. Palaeobot. Palynol. 93, 191–215. ( 10.1016/0034-6667(95)00126-3) [DOI] [Google Scholar]
- 37.Griffing DH, Bridge JS, Hotton CL. 2000. Coastal-fluvial palaeoenvironments and plant palaeoecology of the lower Devonian (Emsian), Gaspé Bay, Québec, Canada. Geol. Soc. Spec. Publ. 180, 61–84. ( 10.1144/GSL.SP.2000.180.01.05) [DOI] [Google Scholar]
- 38.Laporte LF. 1967. Carbonate deposition near mean sea-level and resultant facies mosaic: Manlius Formation (Lower Devonian) of New York State. Am. Assoc. Pet. Geol. Bull. 51, 73–101. ( 10.1306/5d25b793-16c1-11d7-8645000102c1865d) [DOI] [Google Scholar]
- 39.Liu J, Lin C, Li S, Cai Z, Xia S, Fu C, Liu Y. 2012. Detrital zircon U-Pb geochronology and its provenance implications on Silurian Tarim Basin. J. Earth Sci. 23, 455–475. ( 10.1007/s12583-012-0268-z) [DOI] [Google Scholar]
- 40.Lukševičs E, Stinkulis Ģ, Mūrnieks A, Popovs K. 2012. Geological evolution of the Baltic Artesian Basin. In Highlights of groundwater research in the Baltic Artesian Basin (eds A Delina, A Kalvans, T Saks, U Bethers, V Vircavs), pp. 7–52. Riga, Latvia: University of Latvia. [Google Scholar]
- 41.Oliver WA. 1951. Middle Devonian coral beds of central New York. Am. J. Sci. 249, 705–728. ( 10.2475/ajs.249.10.705) [DOI] [Google Scholar]
- 42.Ovenshine AT. 1975. Tidal origin of parts of the Karheen formation (Lower Devonian), Southeastern Alaska. In Tidal deposits, pp. 127–133. Berlin, Germany: Springer. [Google Scholar]
- 43.Pontén A, Plink-Björklund P. 2007. Depositional environments in an extensive tide-influenced delta plain, Middle Devonian Gauja Formation, Devonian Baltic Basin. Sedimentology 54, 969–1006. ( 10.1111/j.1365-3091.2007.00869.x) [DOI] [Google Scholar]
- 44.Rust BR, Lawrence DA, Zaitlin BA. 1989. The sedimentology and tectonic significance of Devonian and Carboniferous terrestrial successions in Gaspé, Quebec Atl. Geol. 25, 1–13. [Google Scholar]
- 45.Tanavsuu-Milkeviciene K, Plink-Bjorklund P. 2009. Recognizing tide-dominated versus tide-influenced deltas: middle Devonian Strata of the Baltic Basin. J. Sediment. Res. 79, 887–905. ( 10.2110/jsr.2009.096) [DOI] [Google Scholar]
- 46.Tovmasjana K.2013. Depositional environment of the tidally-dominated transgressive succession: Rēzekne and Pärnu regional stages, Baltic Devonian Basin. PhD thesis, University of Latvia, Latvia.
- 47.Wendt J, Kaufmann B, Belka Z, Farsan N, Karimi Bavandpur A. 2004. Devonian/Lower Carboniferous stratigraphy, facies patterns and palaeogeography of Iran Part II. Northern and central Iran 1). Acta Geol. Pol. 55, 31–97. [Google Scholar]
- 48.Zaixing J, Yue W, Chuigao W. 2009. Hemipelagic deposition of the Silurian Kepingtage formation in Tarim basin and its sedimentologic significance. J. Earth Sci. 20, 921–931. ( 10.1007/s12583-009-0079-z) [DOI] [Google Scholar]
- 49.Zand-Moghadam H, Moussavi-Harami R, Mahboubi A. 2014. Sequence stratigraphy of the Early-Middle Devonian succession (Padeha Formation) in Tabas Block, East-Central Iran: implication for mixed tidal flat deposits. Palaeoworld 23, 31–49. ( 10.1016/j.palwor.2013.06.002) [DOI] [Google Scholar]
- 50.Green JAM. 2010. Ocean tides and resonance. Ocean Dyn. 60, 1243–1253. ( 10.1007/s10236-010-0331-1) [DOI] [Google Scholar]
- 51.Wilmes S-B, Green JAM. 2014. The evolution of tides and tidal dissipation over the past 21 000 years. J. Geophys. Res. Ocean. 119, 4083–4100. ( 10.1002/2013JC009605) [DOI] [Google Scholar]
- 52.Zaron ED, Egbert GD. 2006. Estimating open-ocean barotropic tidal dissipation: The Hawaiian Ridge. J. Phys. Oceanogr. 36, 1019–1035. ( 10.1175/JPO2878.1) [DOI] [Google Scholar]
- 53.Bills B, Ray R. 1999. Lunar orbital evolution a synthesis of recent results. Geophys. Res. Lett. 26, 3045–3048. ( 10.1029/1999gl008348) [DOI] [Google Scholar]
- 54.Mazzullo SJ. 1971. Length of the year during the Silurian and Devonian periods: new values. GSA Bull. 82, 1085–1086. ( 10.1130/0016-7606(1971)82[1085:lotydt]2.0.co;2) [DOI] [Google Scholar]
- 55.Smith WHF, Sandwell DT. 1997. Global seafloor topography from satellite altimetry and ship depth sounding. Science 277, 1956–1962. ( 10.1126/science.277.5334.1956) [DOI] [Google Scholar]
- 56.Jakobsson M, Macnab R, Mayer L, Anderson R, Edwards M, Hatzky J, Schenke HW, Johnson P. 2008. An improved bathymetric portrayal of the Arctic Ocean: implications for ocean modeling and geological, geophysical and oceanographic analyses. Geophys. Res. Lett. 35, 1–5. ( 10.1029/2008GL033520) [DOI] [Google Scholar]
- 57.Padman L, Fricker HA, Coleman R, Howard S, Erofeeva L. 2002. A new tide model for the Antarctic ice shelves and seas. Ann. Glaciol. 34, 247–254. ( 10.3189/172756402781817752) [DOI] [Google Scholar]
- 58.Matthews KJ, Maloney KT, Zahirovic S, Williams SE, Seton M, Müller RD. 2016. Global plate boundary evolution and kinematics since the late Paleozoic. Glob. Planet. Change 146, 226–250. ( 10.1016/J.GLOPLACHA.2016.10.002) [DOI] [Google Scholar]
- 59.Scotese CR. 2009. Late Proterozoic plate tectonics and palaeogeography: a tale of two supercontinents, Rodinia and Pannotia. Geol. Soc. Lond. Spec. Publ. 326, 67–83. ( 10.1144/SP326.4) [DOI] [Google Scholar]
- 60.Domeier M, Torsvik TH. 2014. Plate tectonics in the late Paleozoic. Geosci. Front. 5, 303–350. ( 10.1016/j.gsf.2014.01.002) [DOI] [Google Scholar]
- 61.Walker J, Geissman J, Bowring S, Babcock L. 2012. GSA geologic time scale v. 4.0. Boulder, CO: Geological Society of America. [Google Scholar]
- 62.Davies HS, Green JAM, Duarte JC. 2018. Back to the future: testing different scenarios for the next supercontinent gathering. Glob. Planet. Change 169, 133–144. ( 10.1016/J.GLOPLACHA.2018.07.015) [DOI] [Google Scholar]
- 63.Egbert GD, Erofeeva SY. 2002. Efficient inverse modeling of barotropic ocean tides. J. Atmos. Ocean. Technol. 19, 183–204. () [DOI] [Google Scholar]
- 64.Longhitano SG, Mellere D, Steel RJ, Ainsworth RB. 2012. Tidal depositional systems in the rock record: a review and new insights. Sediment. Geol. 279, 2–22. ( 10.1016/j.sedgeo.2012.03.024) [DOI] [Google Scholar]
- 65.Green JAM, Molloy JL, Davies HS, Duarte JC. 2018. Is there a tectonically driven supertidal cycle? Geophys. Res. Lett. 45, 3568–3576. ( 10.1002/2017GL076695) [DOI] [Google Scholar]
- 66.Platzman GW. 1975. Normal modes of the Atlantic and Indian Oceans. J. Phys. Oceanogr. 5, 201–221. () [DOI] [Google Scholar]
- 67.Garrett C. 1972. Tidal resonance in the Bay of Fundy and Gulf of Maine. Nature 238, 441–443. ( 10.1038/238441a0) [DOI] [Google Scholar]
- 68.Thanh TD, Phu'o'ng TH, Janvier P, Hùng NH, Cúc NTT, Du'o'ng NT. 2013. Silurian and Devonian in Vietnam—Stratigraphy and facies. J. Geodyn. 69, 165–185. ( 10.1016/J.JOG.2011.10.001) [DOI] [Google Scholar]
- 69.Irwin ML. 1965. General theory of epeiric clear water sedimentation. Am. Assoc. Pet. Geol. Bull. 49, 445–459. ( 10.1306/A6633632-16C0-11D7-8645000102C1865D) [DOI] [Google Scholar]
- 70.Klein GD, Ryer TA. 1978. Tidal circulation patterns in Precambrian, Paleozoic, and Cretaceous epeiric and mioclinal shelf seas. Geol. Soc. Am. Bull. 89, 1050 () [DOI] [Google Scholar]
- 71.Slingerland R. 1986. Numerical computation of co-oscillating palaeotides in the Catskill epeiric Sea of eastern North America. Sedimentology 33, 487–497. ( 10.1111/j.1365-3091.1986.tb00756.x) [DOI] [Google Scholar]
- 72.Mitchell AJ, Allison PA, Gorman GJ, Piggott MD, Pain CC. 2011. Tidal circulation in an ancient epicontinental sea: the Early Jurassic Laurasian Seaway. Geology 39, 207–210. ( 10.1130/G31496.1) [DOI] [Google Scholar]
- 73.Weills MR, Allison P. A, Piggott MD, Pain CC, Hampson GJ, De Oliveira CRE. 2005. Large sea, small tides: the Late Carboniferous seaway of NW Europe. J. Geol. Soc. London. 162, 417–420. ( 10.1144/0016-764904-128) [DOI] [Google Scholar]
Associated Data
This section collects any data citations, data availability statements, or supplementary materials included in this article.
Supplementary Materials
Data Availability Statement
The tidal simulation outputs are available from the corresponding author (H.M.B.).


