Abstract
CCD-based fluorescence tomography is widely used for small animal whole-body imaging. In this report, systematic signal-to-noise ratio (SNR) analyses of a fluorescence tomography imaging (FTI) system were performed, resulting in an easy-to-follow strategy to optimize hardware configurations and operational conditions for acquiring high-quality imaging data and for improving the overall system performance. Phantom experiments were conducted to demonstrate the performance improvement by these optimizations. The improved performance was further verified by imaging a tumor-bearing mouse in vivo. This report provides general and practical guidelines for setting up a high-performance electron multiplying charge coupled device based FTI system to achieve an optimized SNR, which can be useful for future FTI technology development.
I. INTRODUCTION
Fluorescence tomography imaging (FTI) technology, as one of the most promising molecular imaging methods in recent years, can quantitatively assess the 3-dimensional distribution of fluorescent molecular agents in biological tissues in vivo with a large field of view.1–7 By using fluorescent agents with excitation and emission wavelengths in the near-infrared (NIR) optical window (650-900 nm) of biological tissues, FTI can achieve an imaging depth up to several centimeters due to the reduced optical attenuation and is capable of whole-body imaging of small animals8,9 (such as mice), thus becoming a valuable tool for studying disease progression, therapeutic effects, and drug screening. With the development of various fluorescent agents and targeting molecules, FTI has demonstrated significant potential for cardiovascular research, brain function imaging, drug delivery, and imaging-guided surgery.10–13 Photon diffusion has been widely adopted as a reasonable and convenient forward model for approximately describing the propagation of excitation and emission light in highly scattering biological tissues.14 The distribution of the fluorophores can be reconstructed from the fluorescence signals measured from animal body surface by inverse problem solvers.15
Detection of a weak fluorescence signal from deep tissue at the tissue boundary and fluorescence image reconstruction by solving the inverse problem are two key issues for the FTI technology. Recent years have witnessed many advances on data processing and image reconstruction algorithms made by a number of groups for improving the detection sensitivity and imaging resolution.16–20 In addition to reconstruction algorithms, it is also recognized that the signal-to-noise ratio (SNR) of the data acquisition system and thus the raw data quality are also critical parameters in the FTI technology, and the quality of reconstructed images is highly dependent on the raw data quality; however, these areas have not been adequately addressed in the literature. In this report, we systematically analyze the noise sources in a typical electron multiplying charge coupled device (EMCCD) based FTI system and then present several system configurations for optimizing the performance of the FTI system. The new configurations were adopted for data acquisition, producing raw data with a much improved SNR. Phantom experiments were carried out to verify the performance improvement by using the optimized system configuration and data acquisition protocol. The performance of an improved FTI system was also demonstrated by in vivo imaging of a tumor-bearing mouse model after systemic administration of antibody-conjugated, indocyanine green (ICG)-loaded polymeric micelles.21,22
II. MATERIALS AND METHODS
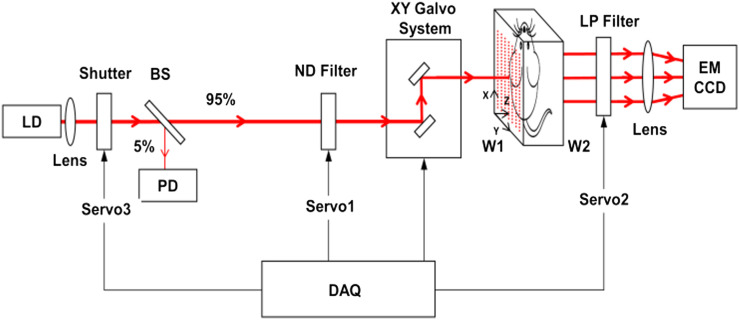
Figure 1 shows the schematic of a home-made FTI system. The light source is a laser diode (L785P090, Thorlabs, Inc.) operating at 785 nm [suitable for indocyanine green (ICG) excitation] with a maximum output power of ∼100 mW (but normally only 60 mW is used for our fluorescence imaging studies). The collimated laser beam goes through a beam splitter (BS) with 5% directed to a photodiode (PD) for monitoring the intensity fluctuation and the rest 95% sent to the target (surface W1 in Fig. 1) through two-dimensional XY galvanometer scanning mirrors (model 6210, Cambridge Technology, Inc.), which are controlled by two analog output channels of a multi-function data acquisition (DAQ) card (PCI-6520, National Instrument, Inc.). The target (a phantom or mouse) is located between the two surfaces (W1 and W2) of a custom chamber which mimics a slab geometry with adjustable separation and is filled with matching fluid. The matching fluid is made of 1.2% intralipid and 0.02% India ink solution and has an absorption coefficient of ∼0.3 cm−1 and a reduced scattering coefficient of ∼10 cm−1. The emission light passing through surface W2 is collected by an EMCCD camera (512 × 512 pixels, iXon DV887, Andor, Inc.) through a Nikon lens (60 mm focal length and f/2.8 aperture). A long-pass optical filter (LP02-785LP, Semrock, Inc.) is employed in front of the lens to reject the excitation light. A servo-controlled shutter is utilized to block the excitation beam when collecting the background (or dark) signal. A variable neutral density (ND) filter is adopted to properly attenuate the excitation light when collecting the excitation signal to avoid saturation.
FIG. 1.
Schematic of an FTI system. LD: laser diode; PD: photodiode; BS: beam splitter (95/5); ND filter: neutral density filter; DAQ: data acquisition; W1: glass wall on the source side; W2: glass wall on the detector side; LP filter: long-pass filter.
Both the laser diode and the EMCCD are turned on at least 30 min before data collection in order to reach a steady state. The EMCCD is cooled down to −70 °C to suppress dark noise. The user normally takes a photograph of the imaging object and then chooses a region of interest (ROI) before filling the matching fluid into the chamber. The system then starts to collect the excitation and emission signals automatically. The background signal is measured by closing the laser diode shutter. For excitation signal collection, the ND filter is inserted in the light path to avoid saturation, while the shutter is open and the long-pass filter is removed. The excitation beam is directed by the XY galvanometer mirrors onto surface W1 in a grid pattern (i.e., source positions) with a beam spot size of about 0.1 mm. The distance between two adjacent source points in the horizontal or vertical direction on surface W1 is 1 mm (which can be customized). For each source position, the light transmitted through surface W2, termed as the excitation signal, is captured by using the EMCCD camera. For emission signal collection, the long-pass filter is placed in the light path with the shutter open and the ND filter removed. Similar to the excitation signal collection, the emission signal is collected for each source position.
The EMCCD we used has 512 × 512 pixels, thus composing a 512 × 512 detector array. To avoid unnecessary memory consumption and accelerate computation speed, the detectors are generally binned up by hardware or software. In our case, we chose the detector separation to be 1 mm (which was the same as the source separation). In addition, we chose the effective detector area to be 1 mm × 1 mm to ensure a sufficient detected photon fluence, which corresponded to 10 × 10 pixels on the CCD chip through the imaging lens between the detector plane W2 and the CCD. Therefore the binning number 10 × 10 was chosen, and consequently the FTI system had maximum 51 × 51 detectors.
For fluorescence image reconstruction, the NIRFAST software package was used as the forward problem solver, which took into account the imaging target geometry (i.e., the slab geometry in our case) and the optical properties of the matching fluid. The randomized algebraic reconstruction technique (R-ART) with a relaxation parameter of 0.1 and 100 iterations was used as the inverse problem solver.23–25 The raw data were scaled by the first Born normalization algorithm before being supplied to the inverse problem solver. The source and detector pairs (SDPs) were chosen by a certain data quality rule, which will be detailed in Secs. III B and IV A.
III. SYSTEM SNR ANALYSIS AND METHODS FOR IMPROVEMENT
The performance of an FTI system is highly dependent on the SNR of the measured excitation Uex(rs, rd) and emission signal Ufl(rs, rd). The SNR of the raw data is mainly determined by the stability of the excitation light source, the background noise caused by ambient light, and the performance of the EMCCD. To minimize the fluctuation of laser intensity and the EMCCD dark counts, data acquisition will not start until the system is warmed up for at least 30 min. The laser intensity is further monitored in real time with a photodiode and any fluctuation will be removed by normalizing the EMCCD measurements with the corresponding photodiode readout. The background (noise) caused by ambient light is minimized by keeping the entire imaging system in a dark box. The noises associated with the EMCCD, however, require more attention. In the following, we will go through the detailed analyses of the EMCCD noises and methods to improve the EMCCD performance for FTI applications.
The SNR per pixel, defined as the ratio of the signal’s mean value and its standard deviation, can be described by the following equation:
| (1) |
Here Ii is the light intensity at any given pixel of the EMCCD for the ith measurement under the same experimental conditions, n is the number of repeated measurements, and std is the standard deviation of Ii. Usually, the light intensity is given by the quantity of PQt, where P is the mean incident photon flux [photons/(pixel/s)], Q is the EMCCD quantum efficiency (photo-electron/photon), and t is the exposure time (s).
Generally speaking, an EMCCD has three main noise sources: shot noise (Np), dark noise (Nd), and read noise (Nr). Shot noise Np, caused by the inherent statistical variation in the arrival rate of photons incident on the EMCCD, is a fundamental property of the quantum nature of light. According to the Poisson statistics,26 Np is equal to the square-root of the average signal level and is denoted as . Dark noise Nd, which is highly dependent on the CCD chip temperature, also follows a Poisson relationship to the dark current Id [photo-electron/(pixel/s)] and is denoted as . Readout noise Nr can be considered as the standard deviation of a random offset that results from the on-chip preamplifier and is added to each pixel. Such random offset also has a non-zero expectation, denoted as D, which basically composes a uniform background. As the most important characteristic of an EMCCD, the multiplication register is located behind the serial register and before the readout node; thus Np and Nd are both amplified along with the signal in the multiplication register before they are read out from the EMCCD. Considering these three noise sources are independent, the total noise from EMCCD can thus be described as
| (2) |
where G is the EMCCD gain.
The SNR of the raw data in an EMCCD-based FTI system can then be described as
| (3) |
where is the average of raw data, is the average of background which is measured with the shutter closed, i.e., under dark illumination, and (with D representing the average read noise). The numerator contains two parts: the excitation or emission signal GPQt and the background expectation . Regarding the noises, the emission photon fluence Ufl or excitation photon fluence Uex can be obtained by subtracting the background from respective raw data, i.e., . Considering that the total variance is the sum of the variance of the raw data () and the variance of the background data (), the SNR of Uex or Ufl is then given by
| (4) |
As previously described, the signal variance G2PQt is obtained when collecting the signal under brighter illumination, while the background variance is obtained under darkness illumination (i.e., with the shutter closed). Therefore, both the bright and dark illuminations should be considered when configuring the EMCCD settings (i.e., gain, exposure time, and binning) in order to achieve a high SNRU.
According to the specifications of the EMCCD Ixon DV887, the quantum efficiency Q is 70% at 800 nm, Id is 0.012 e−/(pix/s) at −70 °C, read noise Nr is from 1 to 62 e−, and the gain can be set from 0 to 255, corresponding to an actual EM gain G of 1–1000. Then the dark noise Nd is about 0.012 e−/pix at 1-s exposure time. It is noted that Nd is negligible compared with Nr when the EMCCD is kept at −70 °C. When the EMCCD works under bright illumination (i.e., with a large PQt), Nr can also be neglected, which means the total noise is dominated by the shot noise Np. When the EMCCD works under complete darkness, the read noise Nr would dominate and thus cannot be neglected. As shown in (4), the signal SNRU depends on multiple CCD setting and operation parameters (such as the gain G, exposure time t, photon flux P, dark current Id, and read noise Nr). In the following, we will discuss the influence of some settings and operation parameters on the signal SNRU, from which an operational optimization guideline will be developed.
A. EMCCD gain value
A higher gain increases the sensitivity of an EMCCD, but it increases noise as well. As seen in (4), the SNRU of the signal is influenced by the EMCCD gain G, and this influence becomes more obvious in the following equation which comes directly from (4) but with a slight form change:
| (5) |
It is evident that will increase and then reach a plateau as the gain G increases. For bright illumination with a strong signal PQt, the signal (PQt) is normally much bigger than the read noise . The total noise is thus dominated by the shot noise. Therefore when the signal is large enough to overcome the read noise , there is no need to use a higher gain. For dark illumination, where the EMCCD noise is dominated by the read noise , (5) tells that the will benefit from a higher gain, which can bring the effective read noise (/G) down to sub-electron (rms).
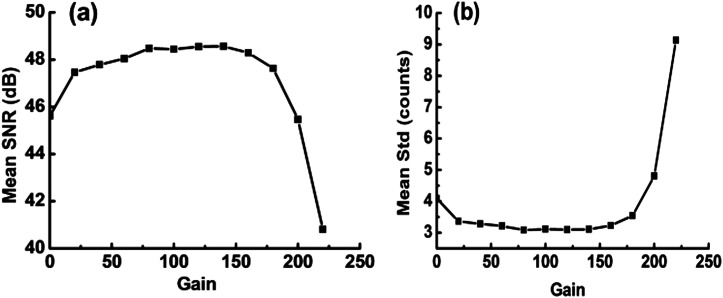
To experimentally determine the relationship between SNRU and gain value at dark illumination, 10 frames were obtained from the EMCCD with various gain setting values (from 0 to 240, set by software). The signal at each gain was represented by the average of the 10 frames, and the noise was given by the standard deviation of the 10 frames. Without loss of generality, we chose the averaged SNR over all pixels to simplify the discussion. The averaged SNR versus gain is shown in Fig. 2(a). We find that the SNR increases quickly when the gain changes from 0 to 20. The SNR reaches a plateau in the gain range of 20–180. Finally, when the gain exceeds 180, the SNR starts decreasing sharply. The drop might be due to the decrease in charge transfer efficiency, which is an additional limiting factor in an EMCCD.27–30 This additional noise, called charge transfer noise, is produced during each transfer of electrons from element to element along the multiplication register of the EMCCD. The charge transfer noise would be amplified in the multiplication register. When the gain is higher than 180, the charge transfer noise becomes obvious and would drag the SNR down. The standard deviation (i.e., noise) of the signal versus gain is shown in Fig. 2(b), which roughly follows a trend opposite to Fig. 2(a).
FIG. 2.
The SNR and standard deviation of an EMCCD under dark illumination: (a) SNR versus gain and (b) standard deviation versus gain. For a gain between 20 and 180, the SNR and standard deviation reach a plateau.
These results suggest that there is an optimal range for the gain in order to achieve an optimal SNR, and the optimal gain range can be experimentally identified using the above method. For the EMCCD we use, the optimal gain range is between 20 and 180 under dark illumination. For bright illumination, we set the gain to 20 to allow for a larger signal dynamic range.
B. Exposure time
Exposure time t is another important operational parameter which controls the sensor counts for a given illumination intensity. According to (5), increasing exposure time t would lead to a better SNR. Theoretically, the exposure time should be adjusted to make the signal count on the sensor close to the sensor saturation value; thus a nearly full dynamic range of the sensor and a maximum SNR can be achieved. However, increasing exposure time will compromise the overall imaging speed, which is not desirable for many studies, particularly for in vivo and dynamic imaging studies.
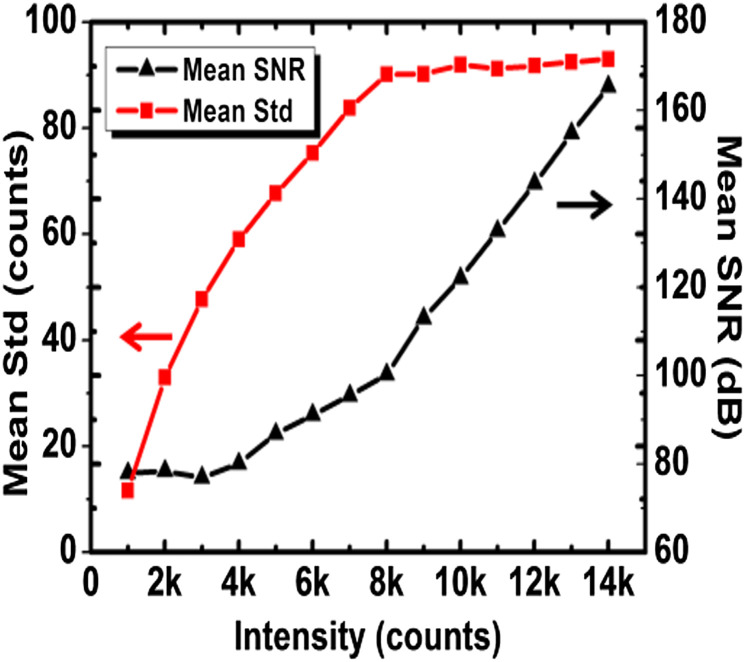
In order to find an optimal exposure time (which is translated to the sensor count), we experimentally investigated the relationship between the SNR and the signal intensity (count) on the EMCCD. We illuminated the camera with a constant light source and took frames with different exposure times sequentially. We randomly collected a small uniform region from the images for calculating the average SNR [by (1)] and standard deviation. The averaged count of this region increases as the exposure time increases. The exposure times were adjusted from a shorter value to a longer one to make the intensity (counts) of this region cover the entire EMCCD dynamic range. Figure 3 shows that the SNR and the standard deviation both increase when the EMCCD count (i.e., signal intensity) increases. When the count reaches about 8000, the standard deviation reaches a plateau and the SNR begins to increase more rapidly. Therefore for achieving better EMCCD performance, the collected signal intensity should reach at least 8000 counts, which sets the lower boundary for the exposure time for a given illumination photon flux.
FIG. 3.
SNR and standard deviation (std) with EMCCD intensity. The standard deviation reaches a plateau and SNR begins to increase sharply when intensity is larger than 8000 counts.
According to (4), measurements under both bright and dark illumination are required to compute the signal SNRU. When the system is under bright illumination (where the noise is dominated by shot noise), the SNR will increase as the exposure time (or collected signal count) increases. When the system is under dark illumination or close to dark illumination (where the noise is dominated by read noise), there is nearly no background photon flux, and thus increasing exposure time would not be effective for improving SNR. Under this situation, binning will become more effective, which will be explained in Sec. III C.
C. Binning
Binning can be operated both in spatial domain (SD) and time domain (TD). SD binning is an on-chip function of an EMCCD, which allows several pixels to be combined together to form one large pixel, and thus improves readout speed and SNR. For example, a “large pixel” from 2 × 2 binning will result in a signal count 4 times as large as an unbinned pixel. In addition, only one readout is required for the binned pixel and the equivalent read noise will then decrease by a factor of 4. However, the EMCCD only has limited options for the on-chip binning function, such as 2 × 2, 4 × 4, and 16 × 16; so another option is to use software binning. For example, if the 5 × 5 unbinned pixels are combined together after being read out from EMCCD, the signal count is 25 times larger and the total read noise is times larger than every single pixel before. The equivalent read noise will then decrease by a factor of 5. Hence software pixel binning can effectively increase SNR by 5 times.31 The reduced readout noise and increased equivalent pixel size permit the measurement of the weaker signal or the use of a shorter exposure time. It is obvious that SD binning will result in a decrease in spatial resolution. In practice, a balance between SNR improvement and spatial resolution decrease should be considered depending upon particular applications.
A time domain (TD) binning is another way to increase the SNR, lower the threshold for weak signal detection, or permit the use of a shorter exposure time. TD binning combines several frames together to form one frame. The trade-off is the sacrifice of the system speed. In TD binning, a preselected number of frames (e.g., M frames) are taken sequentially by the EMCCD and then all the frames are summed up to form one frame by the user. Both the total signal and the variance of the sum frame will increase by M times. Given an exposure time of t for each individual frame, the SNR of the sum frame after TD binning can be described as
| (6) |
It would be interesting to compare the SNR of a TD binned frame with a single frame of a long (i.e., Mt s) exposure time. Following (3), the SNR for a single frame of a long exposure frame (Mt) is given by
| (7) |
The SNR ratio of a TD binned frame to a long exposure frame is then
| (8) |
When the incident photon flux is strong, the signal part (GPQt) is far larger than the background, i.e., GPQt ≫ GIdt + D. So is almost the same as , which means under bright illumination, time binning and the use of a long exposure time are essentially equivalent for improving the CCD system SNR. When the signal photon flux is low (e.g., under weak or even dark illumination), the signal part GPQt is far smaller than the background Ebg. Under this condition and considering that the read noise background is dominant (compared to the dark noise background) when the EMCCD is cooled, (8) can then approximate to , suggesting that the SNR from M frames TD-binning with each frame of a short exposure time t is higher than that of only one frame of an equivalent long exposure time Mt.
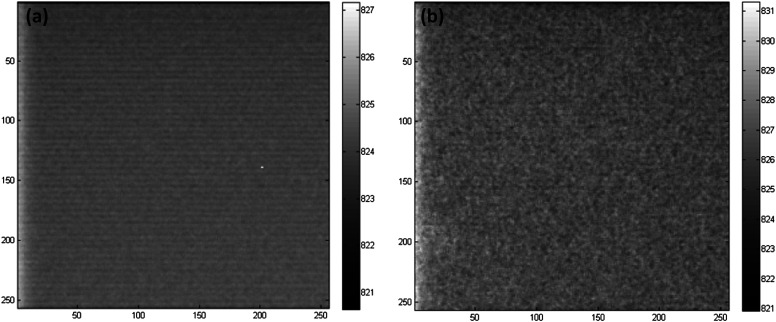
To demonstrate and verify the above analyses, experiments were conducted with the EMCCD under dark illumination (e.g., with the shutter closed). For the time binning experiment, the time exposure for each frame was set to t = 0.1 s and M = 15 frames were taken sequentially. These frames were added up to form one output frame. For comparison, a single frame of a long exposure time (Mt = 1.5 s) was also collected with the rest of the CCD setting remaining the same as in the TD-binning measurement. The two frames are shown in Fig. 4. It is evident that the image obtained with TD binning [Fig. 4(a)] is much smoother than the one using a long exposure time [Fig. 4(b)]. The measurements were repeated 10 times. The average value of these 10 measurements over all pixels was considered as the signal, and the corresponding standard deviation of the 10 measurements (again over all the pixels) was considered as the total noise. The mean SNR in Fig. 4(a) is about 59.8 dB, while the mean SNR in Fig. 4(b) is only about 53.2 dB. The difference in SNR matches well with the theoretical prediction as .
FIG. 4.
The comparison of image quality with and without TD binning: (a) A TD binning image where 15 frames with a 0.1 s exposure time each frame were added up. (b) A single long exposure (1.5 s) image. TD binning improves SNR. The mean SNR over all pixels in (a) is about 59.8 dB, while the mean SNR in (b) is about 53.2 dB.
The above results demonstrated that TD binning for background signal measurement will result in a higher SNR, and according to (4), this will ultimately lead to a higher SNRU for the signal.
D. Acquisition procedure
Based on the above analyses, an operational procedure can be developed for a given EMCCD-based FTI system in order to increase the intensity as well as the data SNR. First, the gain of the EMCCD should be set to the lower value of the plateau region shown in Fig. 2 (i.e., about 20 in our case) in order to maximize the dynamic range of the EMCCD. A short exposure time should then be selected for collecting the signal in order to avoid potential damage to the EMCCD by strong light. If the maximum intensity does not reach the lower threshold under the system’s initial configuration, the exposure time can then be increased step by step until the maximum intensity is close to saturation (or the exposure time exceeds the higher limit which is set with the system imaging speed taken into account).
In our FTI system, the initial gain was set as 20. A 2 × 2 SD binning was used. 10 times TD binning was employed only for collecting the background (i.e., dark illumination). The exposure time was adjusted between 0.1 s and 2 s until the highest pixel value (count) approaches the saturation value of the EMCCD (i.e., 16 384 counts). The lower threshold of pixel intensity (count) was set as 8000 (see discussions in Sec. III B and Fig. 3), which serves as the criterion for selecting valid source-detector pairs used in image reconstruction.
IV. EXPERIMENTAL METHOD AND RESULT
A. Comparison of reconstructed image quality under different EMCCD settings
Phantom experiments were performed to compare the performance of the FTI system with and without acquisition parameter optimization, and Table I lists the key parameters. The experimental group refers to parameters under the optimized setting, while the control group refers to parameters under the default setting.
TABLE I.
Parameters for comparison experiments.
| Parameters | Experimental group | Control group |
|---|---|---|
| Gain | 20 | 20 |
| SD binning | 2 × 2 | 2 × 2 |
| TD binning | Used for collecting background | Not used |
| Exposure time | Self-adjusting | Fixed at 0.1 s |
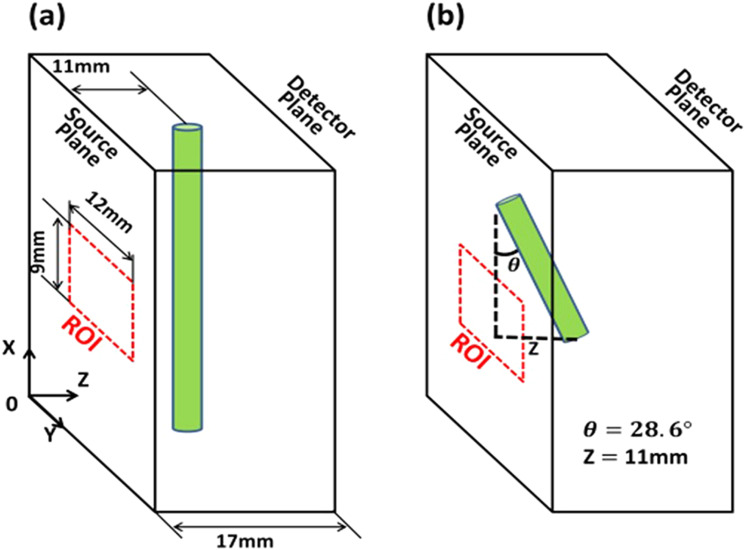
Figure 5 shows the schematic of the experimental geometry, where a cylinder-shaped object (target) was embedded in a slab (17 mm thick) chamber that was filled with a matching fluid (1.2% intralipid plus 0.02% India ink). The imaging target was a straight plastic tube of a 3.3-mm outer diameter and 2.8-mm inner diameter, filled with 2 μM ICG solution and placed in parallel to the X-axis with a distance of 11 mm from the center of the tube to the source plane [see Fig. 5(a)]. The region of interest (ROI) window of 9 × 12 mm2 size on the source plane was selected by the user according to the photograph taken before the chamber was filled with the matching liquid. Given a 1-mm source interval along both X (vertical) and Y (horizontal) directions, there were 9 × 12 = 108 source positions within the ROI window. The ROI size was kept the same for the following phantom experiments.
FIG. 5.
Schematics of phantom experiment geometry. (a) A plastic tube with ICG solution was placed parallel to the X axis. The tube was fixed at 11 mm from the source plane (z = 11 mm) for the study performed in Sec. IV A. The tube was moved along the Z axis for the system linearity evaluation study described in Sec. IV B. (b) The tube was tilted 28.6° with respect to the X-axis in the X-Z plane for further evaluating the system performance in Sec. IV B.
For our imaging optics, after 2 × 2 on-chip SD binning and additional binning by software, one CCD image frame is equivalent to 51 × 51 (i.e., 2601) detectors with a detector interval on the detection plane (see Fig. 5) of 1 mm (i.e., the same as the source interval). To minimize the demand for computation resources and improve the image reconstruction quality, only the detectors with high intensity and high SNR were selected. If the count of a detector was lower than a certain level (i.e., 8000 counts in our case) for all source positions, this detector would be discarded and the data collected by this detector will not be used for image reconstruction. For the above phantom experiment, we ended up with 205 valid detector positions. In conjunction with the 108 source positions, we had totally 205 × 108 = 22 140 source-detector pairs (SDPs) for image reconstruction.
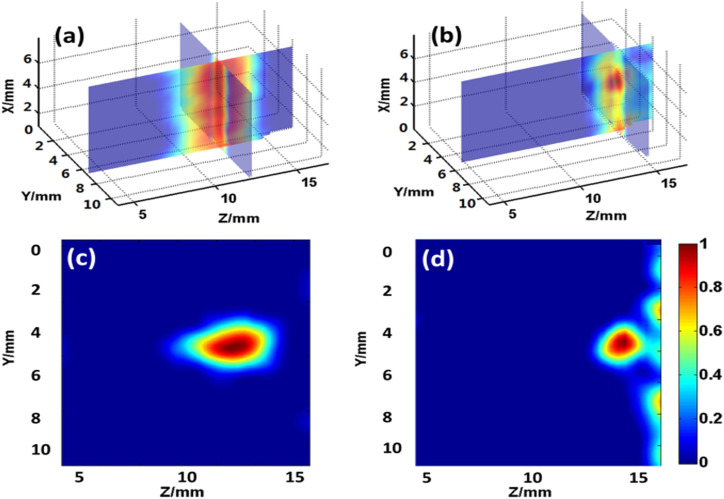
Figures 6(a) and 6(c) show the 3-dimensional images and a representative cross-sectional (2D) image (at x = 0 position) of the target tube reconstructed from the measurements with optimized EMCCD settings. In comparison, the images reconstructed from the measurements with default EMCCD settings are shown in Figs. 6(b) and 6(d). From Figs. 6(c) and 6(d), we found that the reconstructed Z-positions of the tube under optimized and default settings are 12 mm and 14 mm, respectively, and the corresponding errors are 1 mm and 3 mm from the true Z-position of the tube. It is also obvious from Figs. 6(a) and 6(b) that the reconstructed fluorophore distribution along the X direction is much more uniform than that with the default settings.
FIG. 6.
Comparison of reconstructed images of a tubular fluorescent object from data acquired under different EMCCD settings. (a) and (c) are, respectively, the 3D image and a representative 2D cross-sectional image (along a horizontal plane at x = 0 mm) of the target tube reconstructed from data acquired with optimized EMCCD parameter settings. (b) and (d) are, respectively, the 3D and 2D images reconstructed from the measurements with the default EMCCD settings.
B. Evaluation of reconstructed target position and fluorophore concentration linearity
To determine the linearity of the reconstructed target location versus true location, two sets of experiments were conducted. The phantom setup was essentially the same as the one described in Sec. IV A except that the position (or the orientation) of the tube was varied.
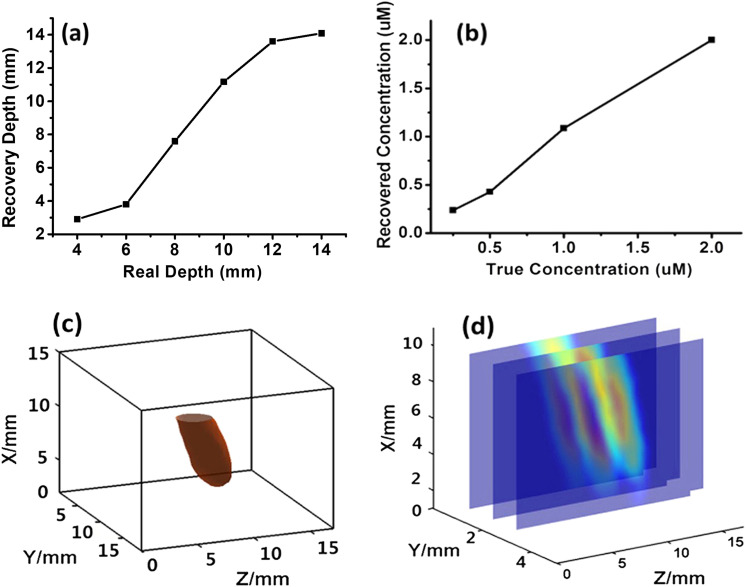
In the first experiment, the tube was moved along the Z direction [see Fig. 5(a)] from 4 mm to 14 mm with a 2-mm step. For the same ROI window of 9 × 12 mm2, the number of source positions remained the same (i.e., 108). The number of valid detector positions varied from 120 to 206 by using the selection criterion described in Sec. IV A. The reconstructed central location of the tube versus true location was plotted in Fig. 7(a). The target position along the Z-direction (depth) came with a large position error (i.e., ∼1.5 mm), particularly when the target was close to the source or detector plane, caused by the boundary conditions. In the middle of the slab, the recovered Z-position was approximately linear with respect to the true Z-position. In addition to the Z-position dependent experiment, we also investigated the position sensitivity of the reconstructed object versus its true position when the object was moved along the X-direction and Y-direction (i.e., parallel to the source/detector planes). We found that the X (or Y) position could be accurately recovered with a position error less than 0.5 mm (data not shown).
FIG. 7.
Phantom tomography results: (a) Localization linearity in the Z direction. (b) The linearity of the recovered fluorophore concentration versus true concentration. (c) 3D reconstructed image of a tilted tube by isosurface plot. (d) Cross sections of the reconstructed tilted tube in the planes parallel to the X-Z plane.
In the second experiment, the tube was tilted in the X-Z plane with respect to the X-axis and the geometry is shown in Fig. 5(b). One end of the 23-mm long tube was glued on the source plane, and the other end was placed 11 mm away from the source plane, resulting in a θ = 28.6° tilt angle between the tube and the source plane. The bottom part of the tube was within the ROI window. The number of valid detector positions for this measurement was 185. Figures 7(c) and 7(d) show the reconstructed 3D image of the tilted tube and some 2D cross sections parallel to the X-Z plane, respectively. The reconstructed tilt angle of the tube is 28.9°, which is very close to the true tilt angle of 28.6°. These results demonstrate that the FTI system can recover the target position with a very good accuracy over a wide position range (except the regions close to the source or detector plane). More interestingly, the orientation of a tiled target can also be recovered with an excellent accuracy.
To determine the linearity of the recovered fluorophore concentration versus true concentration, one set of experiments were conducted. The phantom setup was essentially the same as the one described in Sec. IV A except that the concentration of ICG solution in the tube was varied from 0.25 μM to 0.5 μM, 1 μM, and 2 μM. All measurements were conducted under the same conditions, and the same calibration coefficient was used to the convert the recovered fluorophore intensity value to real concentration. Figure 7(b) shows the recovered fluorophore concentrations through tomography versus the true concentration. Demonstrating the fluorophore concentration can be accurately recovered with an error less than 0.1 μM.
C. In vivo fluorescence tomography imaging of mouse tumor models
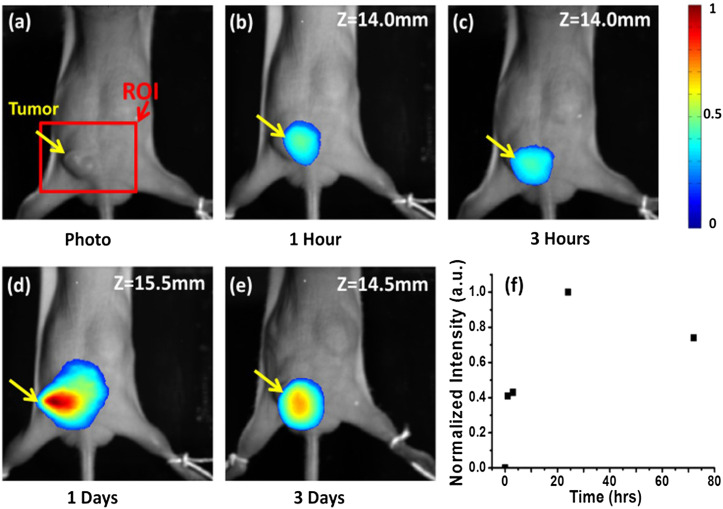
In vivo mouse tumor model imaging was also conducted to demonstrate the performance of the optimized FTI system. For in vivo imaging, 200-μl solution of antibody-conjugated, ICG-loaded polymeric micelles32 (with an ICG dose of 12 μg) was given to an A431 tumor-bearing mouse through tail vein injection, and fluorescence tomography imaging was performed at multiple time points (i.e., 1 h, 3 h, 1 day, and 3 days) after injection. All experimental procedures were approved by the Institutional Animal Care Committee at Johns Hopkins. The mouse was placed in the chamber with the ventral side in direct contact with the source plane (i.e., facing the source) and the dorsal side in contact with the detector plane (i.e., facing the EMCCD). For the reconstruction, there were 216 user-selected source positions within a 12 mm × 18 mm ROI and 280 valid detector positions, which were selected by the criterion described previously. Figure 8(a) shows a photograph of the ventral side of the mouse with a tumor of a size of 6 mm × 4 mm × 4 mm on the flank. A representative fluorescence tomography slice (cross section) at each time point is shown in Figs. 8(b)–8(e), respectively. These image slices are in the coronal plane (i.e., a plane parallel to the source or detector plane) at the depth of the tumor center [e.g., z = 14.0 mm from the source plane in Fig. 8(b)].
FIG. 8.
(a) Photo of the mouse showing where the tumor was. The mouse was placed within the chamber before it was filled with the matching liquid. [(b)-(e)] Reconstructed 2D fluorescence image of the tumor at time points of 0, 1, 3, 24, and 72 h, respectively, after tail vein injection of antibody-conjugated polymeric ICG micelles. The image plane was along the coronal plane going through the center of the tumor, and the fluorescence image was superposed on the photograph shown in (a). The color scale bar represents normalized fluorophore concentration with 1 as the maximum concentration. (f) Normalized maximum intensity obtained from fluorescence tomography in the tumor area versus the time post ICG-micelle injection, revealing that the maximum fluorescence imaging contrast of antibody-conjugated ICG-micelles was around 1 day after tail vein injection and remained strong even over a period of 3 days.
These results reveal that the tumor could be clearly visualized by fluorescence tomography 1 h post injection. The results also show that more antibody-conjugated ICG micelles accumulated around the tumor one day after the tail vein injection. Figure 8(f) is the plot of the normalized maximum intensity within the reconstructed image slices shown in Figs. 8(b)–8(e) versus time post ICG-micelle injection. We found that even 3 days post injection the fluorescence signal from the tumor remained visible with only about 22% reduction compared to the signal at day 1.
V. DISCUSSIONS AND CONCLUSION
EMCCD is the core component in a typical FTI system, and its performance can be influenced by several key parameters including the gain, exposure time, spatial- and time-domain binning, etc. Careful analyses of the dependence of the system performance on these key parameters are needed in order to achieve an optimal signal-to-noise ratio. Many studies have analyzed the SNR of an EMCCD system and provided some general suggestions on the CCD configurations. However, the signals (excitation and emission) in an FTI system have some special characteristics. First, the signal level spans over a large dynamic range. The excitation signal is at least three orders of magnitude stronger than the emission signal, while the background signal (measured under dark or no illumination) is very low and close to the minimum system noise level. Since the input data to the inverse problem solver for fluorescence image reconstruction are the difference between the bright signal and the background, both bright and dark signals affect the overall SNR of the input data and ultimately the reconstructed image quality. This paper offers systematic analyses of the SNR in a typical EMCCD-based FTI system. We found that the CCD gain should be set just above a threshold value at which the system SNR reaches a plateau while the system noise remains low. In the meanwhile, a sufficient detection dynamic range is reserved. The exposure time is a second key parameter that affects the system SNR. Generally speaking, a longer exposure time provides a higher SNR under bright illumination as long as the CCD is not saturated. For dark illumination, binning is another effective method for increasing the CCD SNR. But it will sacrifice the spatial revolution (for spatial-domain binning) or system imaging speed (for time-domain binning). For our application, on-chip SD binning (2 × 2 pixels) was used to enhance the SNR under low illumination and a short exposure time, while TD binning was only used for background collection, and it provided a higher SNR compared to a single measurement with a long equivalent exposure time. The last parameter is about the pixel count. We noticed that the system noise reaches a plateau once the pixel count is about 8000 or higher. For quality image reconstruction, only data of 8000 counts or higher were chosen to ensure that the input data to the inverse problem solver have a good SNR.
Both phantom and in vivo animal model experiments were conducted to evaluate the performance of the EMCCD based FTI system. The position linearity experiments demonstrated that the reconstructed position in the X-Y plane is in excellent linear relation with the true position, and in the Z-direction (depth), the linear relation is very good from 4 mm to 12 mm; however, when the fluorescent target is close to the source or detector plane (i.e., within an ∼4 mm distance), the position error increases which is mainly caused by the boundary conditions and associated artifacts in the forward photon flux calculation and in the R-ART method for reconstruction. The in vivo mouse tumor model experiment demonstrates that the FTI system with optimized operational parameters is capable of performing quantitative molecular imaging and potentially pharmacokinetic studies.
In summary, the performance of an EMCCD-based FTI imaging system can be improved significantly by optimizing the operation parameters. This manuscript offers quantitative SNR analyses for a typical EMCCD-based FTI system and systematic methods for optimizing the system SNR. A similar procedure can be potentially applied to optimizing a CMOS based FTI system. The FTI system presented in the article is simple and can easily be set up or modified according to specific needs, and the imaging experiments demonstrate that such a simple system under optimized operation parameters can be a valuable tool for quantitative whole-body small animal molecular imaging.
ACKNOWLEDGMENTS
The authors would like to acknowledge useful discussions with Dr. Jiefeng Xi in the Department of Biomedical Engineering Johns Hopkins University. This work was supported in part by funding from the National Institutes of Health under Grant No. R01CA120480 and the China Postdoctoral Science Foundation of the Sixty-first Batch of Funds.
Contributor Information
Huiquan Wang, Email: .
Xingde Li, Email: .
REFERENCES
- 1.Ale A., Ermolayev V., Herzog E., Cohrs C., de Angelis M. H., and Ntziachristos V., Nat. Methods 9, 615 (2012). 10.1038/nmeth.2014 [DOI] [PubMed] [Google Scholar]
- 2.Liu M., Guo H., Liu H., Zhang Z., Chi C., Hui H., Dong D., Hu Z., and Tian J., Biomed. Opt. Express 8, 1356 (2017). 10.1364/boe.8.001356 [DOI] [PMC free article] [PubMed] [Google Scholar]
- 3.Zhang Y., Zhang B., Liu F., Luo J., and Bai J., Int. J. Nanomed. 9, 33 (2014). 10.2147/ijn.s52492 [DOI] [PMC free article] [PubMed] [Google Scholar]
- 4.Hielscher A. H., Chandhanayingyong C., Lee Y. I., Kim H. K., and Lee J. H., Biomed. Opt. Express 5, 2301 (2014). 10.1364/boe.5.002301 [DOI] [PMC free article] [PubMed] [Google Scholar]
- 5.Favicchio R., Psycharakis S., Schönig K., Bartsch D., Mamalaki C., Papamatheakis J., Ripoll J., and Zacharakis G., J. Biomed. Opt. 21, 026009 (2016). 10.1117/1.jbo.21.2.026009 [DOI] [PubMed] [Google Scholar]
- 6.Erickson S. J., Martinez S. L., Decerce J., Romero A., Caldera L., and Godavarty A., Phys. Med. Biol. 58, 1563 (2013). 10.1088/0031-9155/58/5/1563 [DOI] [PMC free article] [PubMed] [Google Scholar]
- 7.Vonwil D., Christensen J., Fischer S., Ronneberger O., and Shastri V. P., Mol. Imaging Biol. 16, 350 (2014). 10.1007/s11307-013-0698-8 [DOI] [PubMed] [Google Scholar]
- 8.Ntziachristos V., Ripoll J., Wang L. V., and Weissleder R., Nat. Biotechnol. 23, 313 (2005). 10.1038/nbt1074 [DOI] [PubMed] [Google Scholar]
- 9.Leblond F., Davis S. C., and Valdes P. A., J. Photochem. Photobiol., B 98, 77 (2010). 10.1016/j.jphotobiol.2009.11.007 [DOI] [PMC free article] [PubMed] [Google Scholar]
- 10.Davis S. C., Samkoe K. S., Tichauer K. M., Sexton K. J., Gunn J. R., Deharvengt S. J., Hasan T., and Pogue B. W., Proc. Natl. Acad. Sci. U. S. A. 110, 9025 (2013). 10.1073/pnas.1213490110 [DOI] [PMC free article] [PubMed] [Google Scholar]
- 11.Marcu L., Ann. Biomed. Eng. 40, 304 (2012). 10.1007/s10439-011-0495-y [DOI] [PMC free article] [PubMed] [Google Scholar]
- 12.Shi J., Udayakumar T. S., Wang Z., Dogan N., Pollack A., and Yang Y., Med. Phys. 44, 4786 (2017). 10.1002/mp.12415 [DOI] [PubMed] [Google Scholar]
- 13.Pogue B. W., Holt R. W., and Davis S., Opt. Lett. 38, 2407 (2013). 10.1364/ol.38.002407 [DOI] [PubMed] [Google Scholar]
- 14.Yessayan D., Zacharakis G., Ripoll J., and Ntziachristos V., J. Opt. Soc. Am. A 22, 546 (2005). 10.1364/josaa.22.000546 [DOI] [PubMed] [Google Scholar]
- 15.Zhu D. and Li C., J. Biomed. Opt. 21(1), 16004 (2016). 10.1117/1.JBO.21.1.016004 [DOI] [PubMed] [Google Scholar]
- 16.Zhao L., Cong W., Wang G., and Intes X., Proc. SPIE, BIOS 139–144 (2014). [Google Scholar]
- 17.Wei Z. and Pan X., Biomed. Eng. Online 13, 119 (2014). 10.1186/1475-925x-13-119 [DOI] [PMC free article] [PubMed] [Google Scholar]
- 18.Zhang H., Geng G., Wang X., Qu X., Hou Y., and He X., BioMed Res. Int. 2016, 1. 10.1155/2016/5065217 [DOI] [PMC free article] [PubMed] [Google Scholar]
- 19.Guo H., Yu J., He X., Hou Y., Dong F., and Zhang S., Biomed. Opt. Express 6, 1648 (2015). 10.1364/boe.6.001648 [DOI] [PMC free article] [PubMed] [Google Scholar]
- 20.Jiang S., Liu J., An Y., Zhang G., Ye J., Mao Y., He K., Chi C., and Tian J., Biomed. Opt. Express 7, 2342 (2016). 10.1364/boe.7.002342 [DOI] [PMC free article] [PubMed] [Google Scholar]
- 21.Schaafsma B. E., Mieog J. S., Hutteman M., van der Vorst J. R., Kuppen P. J., Löwik C. W., Frangioni J. V., van de Velde C. J. H., and Vahrmeijer A. L., J. Surg. Oncol. 104, 323 (2011). 10.1002/jso.21943 [DOI] [PMC free article] [PubMed] [Google Scholar]
- 22.Chen J., Liu C., Zeng G., You Y., Wang H., Gong X., Zheng R., Kim J., Kim C., and Liang S., Nanoscale Res. Lett. 11, 85 (2016). 10.1186/s11671-016-1288-x [DOI] [PMC free article] [PubMed] [Google Scholar]
- 23.Lei Y. and Zhou D. X., SIAM J. Imaging Sci. 11, 547 (2018). 10.1137/17m1136225 [DOI] [PMC free article] [PubMed] [Google Scholar]
- 24.Bai Z. Z. and Wu W. T., SIAM J. Sci. Comput. 40, A592 (2018). 10.1137/17m1137747 [DOI] [Google Scholar]
- 25.Shin Y. and Xiu D., SIAM J. Sci. Comput. 39, A983 (2017). 10.1137/16m1075193 [DOI] [Google Scholar]
- 26.Tutt J. H., Holland A. D., Murray N. J., Hall D. J., Harriss R. D., Clarke A., and Evagora A. M., IEEE Trans. Electron Devices 59, 2192 (2012). 10.1109/ted.2012.2200488 [DOI] [Google Scholar]
- 27.Rasnik I., French T., Jacobson K., and Berland K., Methods Cell Biol. 114, 19 (2013). [DOI] [PubMed] [Google Scholar]
- 28.Hall D. J., Soman M., Tutt J., Murray N., Holland A., Schmitt T., Raabe J., Strocov V. N., and Schmitt B., J. Instrum. 7, C01063 (2012). 10.1088/1748-0221/7/01/c01063 [DOI] [Google Scholar]
- 29.Popowicz A., Kurek A. R., Blachowicz T., Orlov V., and Smolka B., Mon. Not. R. Astron. Soc. 463, 2172 (2016). 10.1093/mnras/stw1983 [DOI] [Google Scholar]
- 30.Bush N., Stefanov K., Hall D., Jordan D., and Holland A., J. Instrum. 9, C12042 (2014). 10.1088/1748-0221/9/12/c12042 [DOI] [Google Scholar]
- 31.Westra A. H., Heemskerk J. W. T., Korevaar M. A. N., Theuwissen A. J. P., Kreuger R., Ligtvoet K. M., and Beekman F. J., IEEE Trans. Nucl. Sci. 56, 2559 (2009). 10.1109/tns.2009.2012931 [DOI] [Google Scholar]
- 32.Yan L. and Qiu L., Nanomedicine 10, 361 (2015). 10.2217/nnm.14.118 [DOI] [PubMed] [Google Scholar]


