Abstract
Epithelial–mesenchymal transition (EMT) is a crucial event in wound healing, tissue repair, and cancer progression in adult tissues. Transforming growth factor (TGF)‐β induces EMT in mouse epithelial cells. During prolonged treatment, TGF‐β successively induces myofibroblastic differentiation with increased expression of myofibroblast marker proteins, including smooth muscle α actin and calponin. We recently showed that fibroblast growth factor‐2 prevented myofibroblastic differentiation induced by TGF‐β, and transdifferentiated the cells to those with much more aggressive characteristics (enhanced EMT). To identify the molecular markers specifically expressed in cells undergoing enhanced EMT induced by the combination of TGF‐β and fibroblast growth factor‐2, we carried out a microarray‐based analysis and found that integrin α3 (ITGA3) and Ret were upregulated. Intriguingly, ITGA3 was also overexpressed in breast cancer cells with aggressive phenotypes and its expression was correlated with that of δEF‐1, a key regulator of EMT. Moreover, the expression of both genes was downregulated by U0126, a MEK 1/2 inhibitor. Therefore, ITGA3 is a potential marker protein for cells undergoing enhanced EMT and for cancer cells with aggressive phenotypes, which is positively regulated by δEF‐1 and the MEK–ERK pathway.
Epithelial–mesenchymal transition (EMT) serves as a switch directing polarized epithelial cells to transdifferentiate into mesenchymal cells. During the processes of embryonic development, wound healing, and reorganization of adult tissues, epithelial cells have been shown to lose their epithelial polarity and acquire mesenchymal phenotypes.1 Furthermore, EMT is involved in the process of tumor‐cell invasion, which also includes the loss of cell–cell interaction. Thus far, in most cases, EMT appears to be regulated by ECM components and soluble growth factors or cytokines. Of these, transforming growth factor‐β (TGF‐β) is considered to be the key inducer of EMT during physiological processes.2 TGF‐β is frequently and abundantly expressed in various tumors, and also induces EMT in cancer cells during cancer progression. Several extracellular signaling molecules, including Wnt, epidermal growth factor, fibroblast growth factor (FGF)‐2, and tumor necrosis factor‐α, cooperate with TGF‐β to promote tumor invasion and metastasis as well as EMT. In addition, constitutively active Ras dramatically enhances TGF‐β‐induced expression of Snail, a key mediator of EMT, whereas representative target genes of TGF‐β are either unaffected or slightly inhibited by Ras signaling, leading to selective synergism between TGF‐β and Ras as well as soluble factors in cancer progression.3
TGF‐β has been found to induce EMT in normal mouse mammary epithelial NMuMG cells, and we recently showed that prolonged treatment of NMuMG cells with TGF‐β induces the epithelial‐myofibroblastic transition (EMyoT) with the expression of myofibroblast markers, smooth muscle α actin (α‐SMA), and calponin.4 During TGF‐β‐mediated EMT, TGF‐β induces isoform switching of FGF receptors and sensitizes cells to FGF‐2. Stimulation of FGF‐2 was shown to prevent TGF‐β‐mediated EMyoT through reactivation of the ERK pathways, and cells treated with both FGF‐2 and TGF‐β showed enhanced EMT with more aggressive characteristics that resembled those of activated fibroblasts (Fig. 1a). Moreover, the cells undergoing this enhanced EMT facilitated cancer cell invasion when they were mixed with cancer cells.4 However, specific protein markers of the enhanced EMT induced by TGF‐β plus FGF‐2 have not yet been identified.
Figure 1.
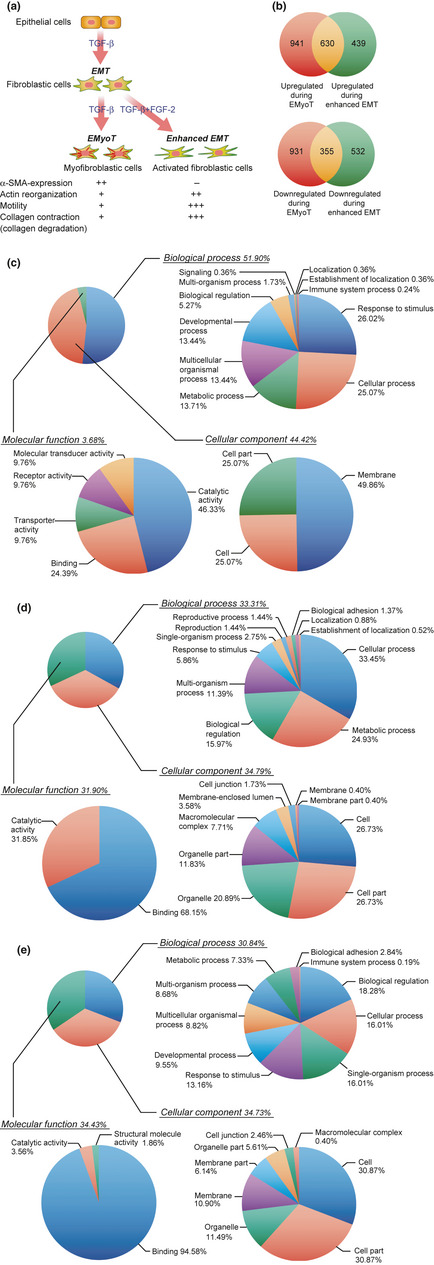
Pie charts of Gene Ontology terms of genes whose expression was differentially regulated by transforming growth factor (TGF)‐β alone or by TGF‐β and fibroblast growth factor (FGF)‐2. (a) Diagram illustrating the progression and characteristics of NMuMG cells undergoing epithelial–myofibroblastic transition (EMyoT) and enhanced epithelial–mesenchymal transition (EMT). α‐SMA, smooth muscle actin‐α. (b) Venn diagrams of the genes regulated by TGF‐β alone and TGF‐β in combination with FGF‐2 in NMuMG cells. The total number of probes upregulated or downregulated at least two fold in the cells treated with both stimulations is displayed. Overlapping genes were determined by the cut‐off threshold of P < 10−4. (c–e) Annotation distribution of the candidate genes that were altered by both stimulations in NMuMG cells. The genes altered by TGF‐β in combination with FGF‐2 (c, enhanced EMT) or TGF‐β alone (d, EMyoT) are shown. The genes affected during both enhanced EMT and EMyoT are shown in (e). Gene Ontology terms belonging to “biological process,” “molecular function,” and “cellular component” were analyzed by GeneSpring software.
Human breast cancers are classified into two subtypes, luminal and basal‐like, corresponding to the two distinct types of epithelial cells found in the normal mammary gland. The basal‐like subtype is associated with aggressive behavior and poor prognosis, and typically does not express estrogen or progesterone receptors or ERBB2 (the triple‐negative subtype).5 We recently found that breast cancer cells of the basal‐like subtype expressed high mRNA levels of δEF1, whereas the expression levels of other EMT regulators, including Twist, Snail, and Slug, were not well correlated with the aggressiveness of breast cancer cells.6 Thus, δEF1 seems to play a crucial role in promoting the aggressive phenotype of the basal‐like subtype of breast cancers.
In the present study, we carried out microarray analyses and found that ITGA3 and Ret were potential marker proteins in cells undergoing enhanced EMT induced by FGF‐2 and TGF‐β in NMuMG cells. Ret was predominantly overexpressed in the luminal subtype of breast cancer cells, whereas the expression of ITGA3 was upregulated in cells of the basal‐like subtype. In addition, cancer cells with the basal‐like subtype showed high levels of δEF1 and phosphorylated ERK. Moreover, inhibition of the MEK–ERK pathway by a chemical compound suppressed expression levels of ITGA3 as well as δEF1 in NMuMG cells and cancer cells. Therefore, ITGA3 appears to represent a useful positive marker for detecting cells that have undergone enhanced EMT, or cancer cells with aggressive phenotypes.
Materials and Methods
Cell culture
All cells used in the present study were from ATCC (Manassas, VA, USA). The cell media and culture conditions have been previously described.4 NMuMG cells were passaged every 2 days in medium with or without 1 ng/mL TGF‐β1, 30 ng/mL FGF‐2, and 100 μg/mL heparin.
Reagents and antibodies
Recombinant human TGF‐β1 and FGF‐2 were purchased from R&D Systems (Minneapolis, MN, USA). U0126 was purchased from Calbiochem (Darmstadt, Germany). The rabbit polyclonal anti‐phospho‐ERK1/2 antibody was obtained from Cell Signaling (Beverly, MA, USA). The rabbit polyclonal anti‐δEF1 and ITGA3 antibodies were from Novus Biologicals (Littleton, CO, USA) and Millipore (Temecula, CA, USA), respectively. The rabbit monoclonal anti‐Ret antibody was from Epitomics (Burlingame, CA, USA). The mouse monoclonal anti‐β‐actin, anti‐α‐tubulin, and anti‐α‐SMA antibodies were purchased from Sigma‐Aldrich (Saint Louis, MO, USA). The rabbit polyclonal anti‐keratin eight antibody was from Sigma–Aldrich.
Quantitative RT‐PCR and microarray‐based gene expression analysis
Total RNA was extracted and analyzed by quantitative RT‐PCR (qRT‐PCR) analysis as previously described.4 Values were normalized to human GAPDH or mouse TBP. The RT‐PCR primer sequences used are shown in Table 1. Microarray analysis was carried out using the GeneChip Mouse 430 2.0 Array (Affymetrix, Santa Clara, CA, USA) according to the manufacturer's instructions. The resulting data was imported into GeneSpring software (Silicon Genetics, Redwood City, CA, USA) for further analysis.
Table 1.
Primers used in the present study
| Name of primer | Forward sequence | Reverse sequence |
|---|---|---|
| Mouse TBP | 5′‐GCGATTTGCTGCAGTCATCA‐3′ | 5′‐GCTGCTAGTCTGGATTGTTCTTCAC‐3′ |
| Mouse α‐SMA | 5′‐CAGGGAGTAATGGTTGGAATGG‐3′ | 5′‐GCCGTGTTCTATCGGATACTTCAG‐3′ |
| Mouse CD44 | 5′‐CAGTCACAGACCTACCCAATTCCT‐3′ | 5′‐GTGTGTTCTATACTCGCCCTTCTTG‐3′ |
| Mouse CXCR7 | 5′‐GAAGAAGATGGTACGCCGTGTT‐3′ | 5′‐AGCAGATGTGACCGTCTTCAGGTA‐3′ |
| Mouse ITGA2 | 5′‐CGGCAGAGATCGATACACATAACC‐3′ | 5′‐CCTATGATAACCCCTGTCGGTACTT‐3′ |
| Mouse EFNB1 | 5′‐GCCCTACGAGTACTACAAGCTGTACCT‐3′ | 5′‐TGATGGTGAAGCGGATTTCC‐3′ |
| Mouse FXYD5 | 5′‐CCTCACTATTGTCGCCCTGATT‐3′ | 5′‐TGTCACGAGTAGTCGCAGAAGTCT‐3′ |
| Mouse ARAP3 | 5′‐CCCTACTGTTTGCACCTAGTGTGTT‐3′ | 5′‐GCCTGGTCCGAGTCAATATCAA‐3′ |
| Mouse DLL1 | 5′‐GCTTCAATGGAGGACGATGTTC‐3′ | 5′‐AAGAGCCGCAGAGATCCATCTT‐3′ |
| Mouse GAP43 | 5′‐CTAGCTTCCGTGGACACATAACAA‐3′ | 5′‐CAGAGCCATCTCCCTCCTTCTT‐3′ |
| Mouse SERPINB2 | 5′‐AAAGCATGGGCATGGAGGAT‐3′ | 5′‐GGCTTGATGGAACACCTCAGAA‐3′ |
| Mouse RET | 5′‐ACACGGCTGCATGAGAATGAC‐3′ | 5′‐TGCTGAGCTGTTCCCAGGAA‐3′ |
| Mouse ITGA3 | 5′‐GTCTGGAGTGGCCCTATGAAGTTA‐3′ | 5′‐GAGAGTAAGGTTGAGAGGGTTGACAAG‐3′ |
| Human GAPDH | 5′‐CGACCACTTTGTCAAGCTCA‐3′ | 5′‐CCCTGTTGCTGTAGCCAAAT‐3′ |
| Human RET | 5′‐GGCTTGTCCCGAGATGTTTA‐3′ | 5′‐GCAGGACACCAAAAGACCAT‐3′ |
| Human ITGA3 | 5′‐GCCTGCCAAGCTAATGAGAC‐3′ | 5′‐ACCTGAAGGTCCCTTGTGTG‐3′ |
Invasion assay, immunoblotting, immunofluorescence labeling, and immunohistochemical analyses of tumor samples
The procedures used for immunoblotting and immunofluorescence were as previously described.4 For invasion assay, the cells were treated with 3 μg/mL anti‐ITGA3 antibody (Millipore) or control IgG (Abcam, Cambridge, UK).7 For immunohistochemical analyses, formalin‐fixed, paraffin‐embedded primary breast tumor tissues were obtained as part of the routine clinical management of patients with breast cancer at the University of Yamanashi Hospital (Yamanashi, Japan). All studies were carried out using the protocol approved by the Ethics Committee of the University of Yamanashi.
Results
Transcriptomic analysis of genes induced by costimulation with TGF‐β and FGF‐2
We have previously reported that prolonged treatment of NMuMG cells with TGF‐β elicits EMyoT, and that FGF‐2 inhibits EMyoT but facilitates “enhanced EMT” (Fig. 1a).4 To identify the genes that were specifically expressed in the cells undergoing enhanced EMT, we extracted mRNAs from NMuMG cells treated with TGF‐β alone or both TGF‐β and FGF‐2 for 3 days, and carried out a DNA microarray analysis. Changes of more than two fold for the gene expression signal levels compared to those in non‐treated cells were judged as significantly increased or decreased. The screen identified 1069 genes upregulated and 887 genes downregulated by TGF‐β plus FGF‐2 (enhanced EMT genes); 1571 genes were found to be upregulated and 1286 genes downregulated by TGF‐β alone (EMyoT genes) (Fig. 1b). Six hundred and thirty upregulated genes and 355 downregulated genes overlapped between enhanced EMT genes and EMyoT genes. A total of 971 genes, including 439 upregulated genes and 532 downregulated genes, were specific for enhanced EMT; these were classified into three groups by Gene Ontology parameters (Fig. 1c). The EMyoT genes and those overlapping between enhanced EMT and EMyoT genes were also analyzed by Gene Ontology parameters (Fig. 1d,e). Interestingly, the genes in the “molecular function” category among the enhanced EMT‐specific genes made up only 3.68% of the total, which was remarkably lower than those in the EMyoT genes. We therefore chose several genes from this category and further analyzed their expression during enhanced EMT.
qRT‐PCR analysis of genes specifically regulated during enhanced EMT
TGF‐β upregulates α‐SMA in NMuMG cells during TGF‐β‐induced EMyoT, whereas FGF‐2 abolishes it.4 We first confirmed these responses using microarray analysis (data not shown) and qRT‐PCR (Fig. 2a). Epithelial stromal interaction 1 (EPSTI 1) and CD44 were reportedly regulated by TGF‐β alone,6, 8 and we found that the addition of FGF‐2 failed to affect them further (Fig. 2b,c). In addition, the expression of several genes was transiently increased by stimulation with both TGF‐β and FGF‐2 when we carried out microarray analyses, although they were downregulated thereafter (Fig. 2d). In contrast, expression of several genes was drastically induced in cells costimulated with TGF‐β and FGF‐2 over this time period compared to treatment by TGF‐β alone or by control. Based on these genes' pathophysiological function and significance, we chose four as potential molecular markers in cells undergoing enhanced EMT induced by TGF‐β and FGF‐2: GAP43, SERPINB2 (also known as plasminogen activator inhibitor‐2), Ret proto‐oncogene, and ITGA3 (Fig. 2e).
Figure 2.
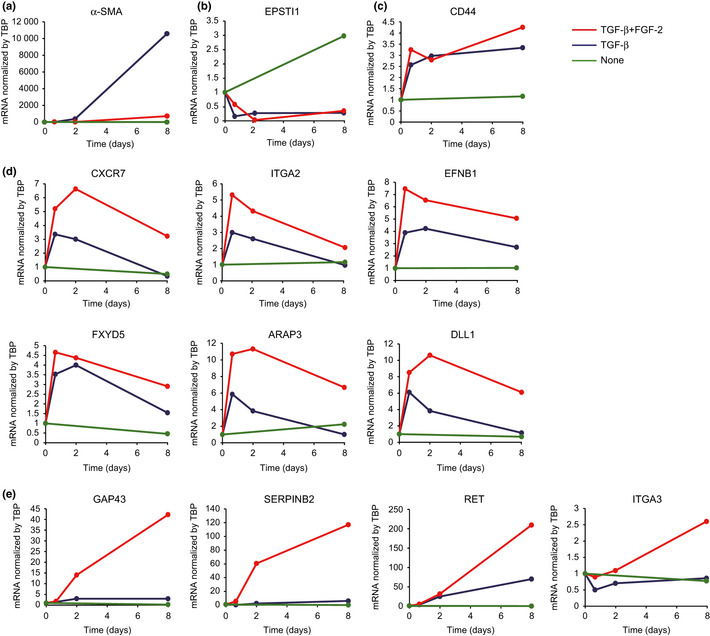
Quantitative RT‐PCR analysis of the selected genes. NMuMG cells were treated with transforming growth factor (TGF)‐β or both TGF‐β and fibroblast growth factor (FGF)‐2, and then examined for gene induction at the indicated time points. Values were normalized to the housekeeping gene TBP.
Induction of Ret and ITGA3 by TGF‐β plus FGF‐2
To examine the protein levels of the selected genes, NMuMG cells were treated with TGF‐β alone or with both TGF‐β and FGF‐2 for 7 days. Both treatments repressed protein levels of E‐cadherin and affected those of α‐SMA, as previously reported,4 whereas the expression levels of keratin eight was unaltered (Fig. 3a). Consistent with the mRNA expression patterns described above, combined treatment, but not TGF‐β‐treatment alone, dramatically induced protein levels of Ret, whereas those of ITGA3 were considerably enhanced. Protein expression of Ret or ITGA3 was not detected in mouse fibroblast NIH‐3T3 cells. By immunohistochemical analysis, induction of Ret was minimally detected in the cells treated with TGF‐β and FGF‐2 (Fig. 3b). The discrepancy between immunohistochemical and immunoblot analyses is probably due to the poor quality of the commercially available anti‐Ret antibody, which was not suitable for immunohistochemical analyses in mice. In contrast, upregulation of ITGA3 was clearly observed in the cells treated with this combination (Fig. 3b). Protein levels of GAP43 and SERPINB2 were not significantly detected in NMuMG cells with or without any stimulation, also due to the low quality of these commercially available antibodies against mouse antigens (data not shown). Thus, Ret and ITGA3 appeared to be promising candidates for markers of cells undergoing enhanced EMT.
Figure 3.
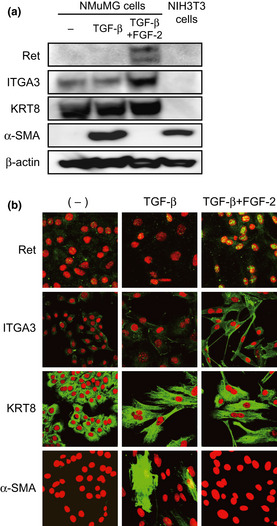
Protein levels for the selected genes. (a,b) Immunoblotting and immunohistochemical analyses of the indicated gene products. NMuMG cells were treated with transforming growth factor (TGF)‐β or both TGF‐β and fibroblast growth factor (FGF)‐2 for 7 days, and examined for the induction of the gene products by immunoblotting (a) and immunohistochemical (b) analyses with the indicated antibodies. β‐Actin levels were monitored as a loading control for the whole‐cell extracts. Propidium iodide was used to detect nuclei (red). ITGA3, integrin α3; KRT8, keratin 8; α‐SMA, smooth muscle α actin.
Expression of Ret and ITGA3 in breast cancer cells
EMT is widely considered to accelerate tumor aggressiveness, especially in breast cancer cells. To examine the expression of Ret and ITGA3 in human breast cancer, we extracted mRNAs and proteins from 20 human breast cancer cell lines. We have already reported high expression levels of δEF1 mRNA in the basal‐like subtype,6 and found that δEF1 in this subtype was also elevated at the protein level (Fig. 4a). Unexpectedly, at both the mRNA and protein levels, Ret was predominantly overexpressed in the luminal subtype. In contrast, ITGA3 was expressed at high levels in the basal‐like subtype, and was accompanied by elevated ERK phosphorylation (Fig. 4a).
Figure 4.
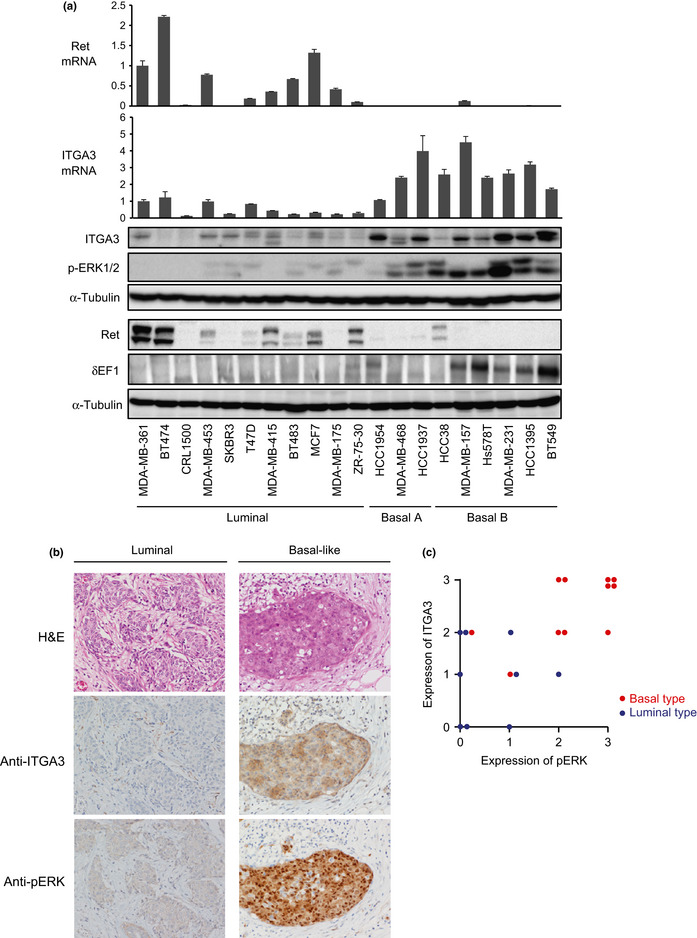
(On next page) Expression profiles of Ret and integrin α3 (ITGA3) in human breast cancer cells. (a) Expression levels of Ret, ITGA3, δEF1, and phosphorylated ERK (p‐ERK) in 20 human breast cancer cell lines. Expressions of mRNA and protein levels were determined by quantitative RT‐PCR and immunoblot analyses, respectively. Values were normalized to the housekeeping gene TBP. α‐Tubulin levels were monitored as a loading control for the whole‐cell extracts. The gene clusters shown have been reported.5 The basal A subtype reveals a basal‐like signature that is basal cytokeratin (K5/K14)‐positive, whereas the basal B subtype shows a stem‐cell‐like expression profile that is vimentin‐positive, possibly reflecting the clinical triple‐negative tumor type.5 (b) Immunohistochemical analysis of ITGA3. Representative images of H&E staining, and immunohistochemical staining of ITGA3 and p‐ERK are shown in luminal and basal‐like subtypes of primary tumor samples from breast cancer patients. (c) The following score in the assessment of ITGA3 and p‐ERK immunostaining was used: 0, no staining or unspecific staining of tumor cells; 1, weak and incomplete staining of more than 10% of tumor cells; 2, moderate and complete staining of more than 10% of tumor cells; and 3, strong and complete staining of more than 10% of tumor cells.
We next examined the expression of ITGA3 by immunohistochemical analyses using primary tumor tissues from cancer patients, among which 11 with basal‐like features and nine with luminal features were subjected to immunostaining with anti‐ITGA3 and anti‐phospho‐ERK antibodies. In all samples used in this study, and as shown in the representative samples in Figure 4(b), ITGA3 and the phosphorylated form of ERK were positively detected in specimens with basal‐like features, whereas they were negative or much lower in specimens with luminal features (Fig. 4c). These findings indicate that ITGA3 was overexpressed in breast cancer cells with more aggressive phenotypes.
Involvement of the ERK pathway in ITGA3 overexpression
As breast cancer cells with the basal‐like subtype showed high levels of ITGA3 and the phosphorylated form of ERK, we next examined whether the ERK pathway was involved in the upregulation of ITGA3. NMuMG cells were first treated with both TGF‐β and FGF‐2 for 7 days in the presence or absence of U0126, a MEK1/2 inhibitor. Upregulation of both ITGA3 and Ret by the combined treatment was clearly reduced by the addition of U1026 (Fig. 5a for ITGA3; data not shown for Ret). Among breast cancer cells, we selected MDA‐MB‐231, Hs578T, and HCC1395 cell lines as examples of those with the basal‐like subtype, and the MCF7 cell line as an example of those with the luminal subtype. Elevated levels of ITGA3 in all cells with the basal‐like subtype were suppressed by U0126, and this was accompanied by a reduction in δEF1 protein levels (Fig. 5b). As ITGA3 has been reported to be highly expressed in glioma cells,9 the effect of U0126 was also examined in human glioma KG1C and U251 cell lines (Fig. 5c). The expression of ITGA3 and δEF1 was much higher in both glioma cell lines than in the MDA‐MB‐231 breast cancer cell line of the basal‐like subtype. U0126 also reduced expression of ITGA3 and δEF1 in both glioma cells. These findings suggest that MEK–ERK pathways upregulate the expression levels of ITGA3 and δEF1 in human breast cancer cells and glioma cells.
Figure 5.
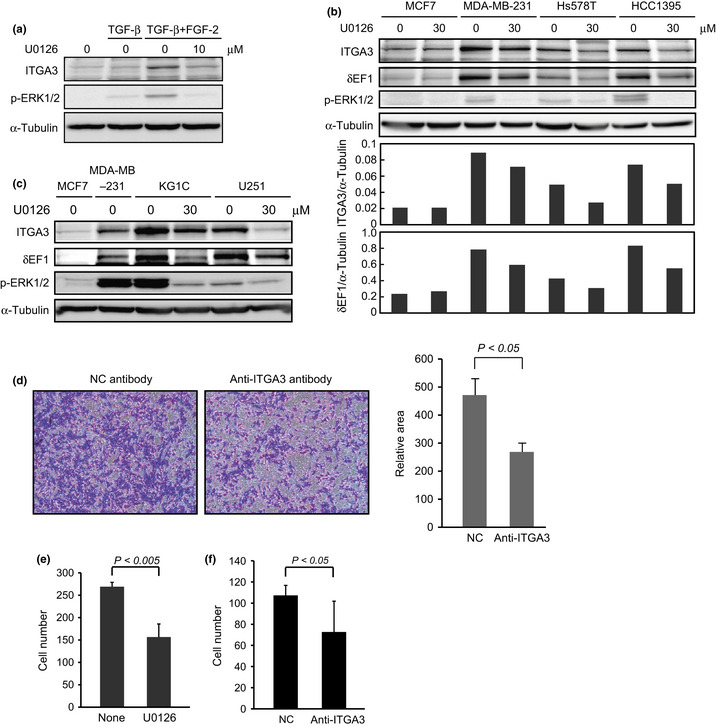
Effects of U0126 on integrin α3 (ITGA3) expression. (a) Repression of ITGA3 by U0126 in NMuMG cells. NMuMG cells were treated with transforming growth factor (TGF)‐β alone or combined TGF‐β and fibroblast growth factor (FGF)‐2 for 7 days in the presence or absence of 10 μM U0126. The cells were lysed and subjected to immunoblot analysis with the indicated antibodies. α‐Tubulin levels were monitored as a loading control for the whole‐cell extracts. p‐ERK, phosphorylated ERK. (b) Inhibitory effects of U0126 on ITGA3 expression in human breast cancer cells. Luminal subtype MCF7 cells and basal‐like subtype MDA‐MB‐231, Hs578T, and HCC1395 cells were incubated with 30 μM U0126 for 24 h. The cells were lysed and subjected to immunoblot analysis with the indicated antibodies. The ratio of ITGA3 or δEF1 to α‐tubulin was validated by densitometric analysis and is shown in the lower panels. α‐Tubulin levels were monitored as a loading control for the whole‐cell extracts. (c) Inhibitory effects of U0126 on ITGA3 expression in human glioma cells. KG1C and U251 glioma cells were incubated with 30 μM U0126 for 24 h. The cells were lysed and subjected to immunoblot analysis with the indicated antibodies. α‐Tubulin levels were monitored as a loading control for the whole‐cell extracts. (d,e) Inhibitory effects of anti‐ITGA3 antibody (d) and U0126 (e) on the invasive properties of NMuMG cells. NMuMG cells were pretreated with TGF‐β or both TGF‐β and FGF‐2 for 4 days. The cells were then seeded onto cell culture inserts coated with type I collagen in the presence or absence of anti‐ITGA3 antibody or 10 μM U0126. After 24 h, the cells that had invaded into the lower surface of the filters were stained with crystal violet (left), followed by quantification by measuring the area of photographed cells (right). (f) Inhibitory effects of anti‐ITGA3 antibody on the invasive properties of MDA‐MB‐231cells. NC, control IgG.
Finally, we examined the effect of functional inhibition of ITGA3 in NMuMG cells. We previously reported that the addition of FGF‐2 dramatically enhanced the invasive properties induced by TGF‐β.4 In this study, we found that when ITGA3 was functionally blocked by neutralizing antibody or its expression was reduced by U0126, the enhanced invasion was significantly repressed (Fig. 5d,e, and data not shown). Moreover, treatment with the neutralizing antibody also suppressed invasion of MDA‐MB‐231 cells, suggesting that ITGA3 promoted invasion of NMuMG cells undergoing enhanced EMT and of MDA‐MB‐231 cells in the basal‐like subtype.
Discussion
In the present study, upregulation of ITGA3 was observed in specimens from breast cancer patients and in human breast cancer cells with aggressive phenotypes (the basal‐like subtype), although Ret was unexpectedly overexpressed in the luminal subtype of breast cancer cells (Fig. 4a). Ret mutations are rarely identified in breast cancer, whereas Ret overexpression with a corresponding increase in protein levels is detected in a subset of estrogen receptor positive breast cancers.10 Ret signaling activated by glial cell line‐derived neurotrophic factor from tumor‐associated macrophages causes increased cell scattering and anchorage‐independent proliferation of cancer cells,11, 12 suggesting that estrogen receptor‐dependent expression of Ret is important in the progression of the luminal subtype of breast cancer. On the other hand, ITGA3 is an integrin α subunit that makes up half of the integrin duplex along with the β1 subunit, which interacts with various ECM proteins including laminin‐332 and laminin‐511.13, 14 Expression of laminin‐332 is induced at the wounded edge of epidermis and at the leading edge of invading carcinomas. Additionally, laminin‐332 and ‐511 enhance migration and scattering of the cells through binding to integrin α3β1, and blockade of these interactions by mAb strongly inhibited α3β1 integrin‐mediated adhesion of cancer cells.15, 16 In the present study, ITGA3 was shown to be associated with invasion of phospho‐ERK‐positive cells (Figs 4a,5f). Thus, ERK‐dependent expression of ITGA3 could be important in progression of the basal‐like subtype of breast cancer.
The detailed mechanisms of ITGA3 overexpression remain to be elucidated. In this study, addition of either TGF‐β alone or SB431542, a TGF‐β type I receptor inhibitor, in the basal‐like subtype of breast cancer cells failed to regulate the expression of ITGA3, because these treatments did not affect the phosphorylation levels of ERK. U0126 repressed the expression of ITGA3 in NMuMG cells and cancer cells (Fig. 5), although the regulatory transcription factors involved have not yet been addressed. We previously reported that Ets1 induced δEF1 expression and activated δEF1‐promoter luciferase activity in NMuMG cells.17 In addition, Ets1 siRNA inhibited TGF‐β‐induced δEF1 expression in these cells. Interestingly, Ets1 has been identified as a novel marker of the basal‐like subtype.18 Based on previous reports that the ERK pathway activates Ets1 activity,19 Ets1 seems to play an important role in the upregulation of both δEF1 and ITGA3 in breast cancer cells as well as glioma cells.
Cancer cell invasion was recently classified into two categories, so‐called “collective cancer cell invasion” and “fibroblast‐led collective invasion”.16 In the former, cancer cells invade without the assistance of other cells, whereas the latter highlights the importance of certain fibroblasts that initiate a collective invasion chain of cancer cells.20 Although the specific fibroblasts associated with this latter phenomenon have not been identified, they were reported to express ITGA3 at high levels, and the siRNA‐mediated depletion of ITGA3 in fibroblasts reduced cancer cell invasion.20 Based on these observations, fibroblastic cells that differentiate from epithelial cells through EMT induced by TGF‐β and FGF‐2 function as these types of fibroblasts, as with NMuMG cells. The epidermis‐specific depletion of the ITGA3 gene in mice resulted in a dramatic decrease in tumor initiation due to increased epidermal turnover, and the mice developed undifferentiated carcinoma after chemical tumorigenesis.21 Conversely, loss of the ITGA3 gene was reported to be associated with the acquisition of malignant behavior in ovarian cancer cells.22 In this study, ITGA3 was overexpressed in the basal‐like subtype of breast cancer cells. In addition, human specimens showed a small number of ITGA3‐positive cells localized at the invasion front (data not shown). However, we have not definitively characterized whether these positive cells were cancer cells or fibroblastic cells differentiated from epithelial cells by EMT. To do this, high‐quality antibodies with adequate sensitivities for immunohistochemical analyses would be required.
From the results of this study, we conclude that ITGA3 is a potential molecular marker for cells undergoing enhanced EMT as well as for cancer cells with aggressive phenotypes. Integrin α3 likely plays a crucial role in the progression of both cancer cells and fibroblastic cells in cancer microenvironments.
Disclosure Statement
The authors have no conflict of interest.
Abbreviations
- EMT
epithelial–mesenchymal transition
- EMyoT
epithelial–myofibroblastic transition
- FGF‐2
fibroblast growth factor‐2
- GAP
growth‐associated protein
- ITGA3
integrin α3
- qRT‐PCR
quantitative RT‐PCR
- α‐SMA
smooth muscle α actin
- TBP
TATA binding protein
- TGF
transforming growth factor
Acknowledgments
We are grateful to Ms K. Endo and Mr Y. Koshimizu for their technical assistance. We thank Drs N. Oishi, T. Kawataki, H. Kinouchi, H. Fujii, and R. Kato for their advice and discussion regarding human clinical samples. This work was supported by the Foundation for Promotion of Cancer Research and JSPS KAKENHI Grant No. 23790455 (T.S.), and Kobayashi Foundation for Cancer Research, JSPS KAKENHI Grant No. 24390419, the Cooperative Program for Graduate Student Education between the University of Yamanashi and Waseda University from the Ministry of Education, Culture, Sports, Science and Technology of Japan, and JSPS Core‐to‐Core Program “Cooperative International Framework in TGF‐β Family Signaling”.
(Cancer Sci, doi: 10.1111/cas.12220, 2013)
References
- 1. Thiery JP, Acloque H, Huang RY, Nieto MA. Epithelial‐mesenchymal transitions in development and disease. Cell 2009; 139: 871–90. [DOI] [PubMed] [Google Scholar]
- 2. Miyazono K. Transforming growth factor‐beta signaling in epithelial‐mesenchymal transition and progression of cancer. Proc Jpn Acad Ser B Phys Biol Sci 2009; 85: 314–23. [DOI] [PMC free article] [PubMed] [Google Scholar]
- 3. Saitoh M, Miyazawa K. Transcriptional and post‐transcriptional regulation in TGF‐β‐mediated epithelial‐mesenchymal transition. J Biochem 2012; 151: 563–71. [DOI] [PubMed] [Google Scholar]
- 4. Shirakihara T, Horiguchi T, Miyazawa M et al TGF‐β regulates isoform switching of FGF receptors and epithelial‐mesenchymal transition. EMBO J 2011; 30: 783–95. [DOI] [PMC free article] [PubMed] [Google Scholar]
- 5. Neve RM, Chin K, Fridlyand J et al A collection of breast cancer cell lines for the study of functionally distinct cancer subtypes. Cancer Cell 2006; 10: 515–27. [DOI] [PMC free article] [PubMed] [Google Scholar]
- 6. Horiguchi K, Sakamoto K, Koinuma D et al TGF‐β drives epithelial‐mesenchymal transition through δEF1‐mediated downregulation of ESRP. Oncogene 2012; 31: 3190–201. [DOI] [PMC free article] [PubMed] [Google Scholar]
- 7. Saito D, Kyakumoto S, Chosa N et al Transforming growth factor‐β1 induces epithelial‐mesenchymal transition and integrin alpha3beta1‐mediated cell migration of HSC‐4 human squamous cell carcinoma cells through Slug. J Biochem 2012; 153: 303–15. [DOI] [PubMed] [Google Scholar]
- 8. Kondo M, Cubillo E, Tobiume K et al A role for Id in the regulation of TGF‐β‐induced epithelial‐mesenchymal transdifferentiation. Cell Death Differ 2004; 11: 1092–101. [DOI] [PubMed] [Google Scholar]
- 9. DeFreitas MF, Yoshida CK, Frazier WA, Mendrick DL, Kypta RM, Reichardt LF. Identification of integrin α3β1 as a neuronal thrombospondin receptor mediating neurite outgrowth. Neuron 1995; 15: 333–43. [DOI] [PubMed] [Google Scholar]
- 10. Stine ZE, McGaughey DM, Bessling SL, Li S, McCallion AS. Steroid hormone modulation of RET through two estrogen responsive enhancers in breast cancer. Hum Mol Genet 2011; 20: 3746–56. [DOI] [PMC free article] [PubMed] [Google Scholar]
- 11. Esseghir S, Todd SK, Hunt T et al A role for glial cell derived neurotrophic factor induced expression by inflammatory cytokines and RET/GFR α1 receptor up‐regulation in breast cancer. Cancer Res 2007; 67: 11732–41. [DOI] [PubMed] [Google Scholar]
- 12. Boulay A, Breuleux M, Stephan C et al The Ret receptor tyrosine kinase pathway functionally interacts with the ERα pathway in breast cancer. Cancer Res 2008; 68: 3743–51. [DOI] [PubMed] [Google Scholar]
- 13. Rozzo C, Chiesa V, Ponzoni M. Integrin up‐regulation as marker of neuroblastoma cell differentiation: correlation with neurite extension. Cell Death Differ 1997; 4: 713–24. [DOI] [PubMed] [Google Scholar]
- 14. Miyazaki K. Laminin‐5 (laminin‐332): Unique biological activity and role in tumor growth and invasion. Cancer Sci 2006; 97: 91–8. [DOI] [PMC free article] [PubMed] [Google Scholar]
- 15. Kawataki T, Yamane T, Naganuma H et al Laminin isoforms and their integrin receptors in glioma cell migration and invasiveness: Evidence for a role of α5‐laminin(s) and α3β1 integrin. Exp Cell Res 2007; 313: 3819–31. [DOI] [PubMed] [Google Scholar]
- 16. Wondimu Z, Omrani S, Ishikawa T et al A novel monoclonal antibody to human laminin α5 chain strongly inhibits integrin‐mediated cell adhesion and migration on laminins 511 and 521. PLoS ONE 2013; 8: e53648. [DOI] [PMC free article] [PubMed] [Google Scholar]
- 17. Shirakihara T, Saitoh M, Miyazono K. Differential regulation of epithelial and mesenchymal markers by δEF1 proteins in epithelial mesenchymal transition induced by TGF‐β. Mol Biol Cell 2007; 18: 3533–44. [DOI] [PMC free article] [PubMed] [Google Scholar]
- 18. Charafe‐Jauffret E, Ginestier C, Monville F et al Gene expression profiling of breast cell lines identifies potential new basal markers. Oncogene 2006; 25: 2273–84. [DOI] [PubMed] [Google Scholar]
- 19. Paumelle R, Tulasne D, Kherrouche Z et al Hepatocyte growth factor/scatter factor activates the ETS1 transcription factor by a RAS‐RAF‐MEK‐ERK signaling pathway. Oncogene 2002; 21: 2309–19. [DOI] [PubMed] [Google Scholar]
- 20. Gaggioli C, Hooper S, Hidalgo‐Carcedo C et al Fibroblast‐led collective invasion of carcinoma cells with differing roles for RhoGTPases in leading and following cells. Nat Cell Biol 2007; 9: 1392–400. [DOI] [PubMed] [Google Scholar]
- 21. Sachs N, Secades P, van Hulst L, Kreft M, Song JY, Sonnenberg A. Loss of integrin α3 prevents skin tumor formation by promoting epidermal turnover and depletion of slow‐cycling cells. Proc Natl Acad Sci USA 2012; 109: 21468–73. [DOI] [PMC free article] [PubMed] [Google Scholar]
- 22. Suzuki N, Higashiguchi A, Hasegawa Y et al Loss of integrin α3 expression associated with acquisition of invasive potential by ovarian clear cell adenocarcinoma cells. Hum Cell 2005; 18: 147–55. [DOI] [PubMed] [Google Scholar]


