

Abstract
Esophageal squamous cell carcinoma (ESCC) is one of the deadliest malignancies worldwide. Ying Yang 1 (YY1), a ubiquitously expressed GLI‐Krüppel zinc finger transcription factor, plays a regulatory role in a variety of fundamental biological processes, such as embryonic development, growth, apoptosis, differentiation and oncogenic transformation. The purpose of this study was to investigate the expression of YY1 in normal and cancerous esophageal tissues and its function in ESCC development. We found that the expression of YY1 mRNA was significantly increased in the tumor tissues, compared with the para‐tissues or normal esophageal tissues. The increased expression of YY1 in tumor samples was further confirmed by immunohistochemistry. Furthermore, the overexpression of YY1 conferred radioresistance to the ESCC TE‐1 cells and resulted in markedly reduced cell proliferation. Accordingly, the small interfering RNA‐mediated silencing of YY1 expression in TE‐1 cells resulted in increased proliferation by enhancing the binding of P21 to Cyclin D1 and CDK4, a protein complex known to mediate cell cycle progression. Moreover, besides P21, heme oxygenase‐1 (HO‐1) was identified as a YY1 downstream effector, as YY1 stimulated HO‐1 expression in esophageal cancer cells. YY1 mediated biological function through transcription of HO‐1. Forced expression of HO‐1 could moderately suppress proliferation of TE‐1 cells. The expression of YY1 significantly correlated with that of HO‐1 in ESCC tissues. Taken together, we demonstrated overexpression of YY1 in esophageal carcinoma and identified HO‐1 as its target.
Esophageal squamous cell carcinoma (ESCC) remains the sixth most common cause of cancer‐related death.1 Despite intensive multimodality therapies, including surgery, radiotherapy and chemotherapy, the prognosis of this disease remains poor. Patients with esophageal carcinomas have a low 5‐year survival rate because of late diagnosis and the rapid spread of cancer cells.2 The pathology of ESCC remains complex and largely unknown. Understanding the biological mechanisms involved in esophageal tumor development has emerged as a significant issue in ESCC research. Accumulating evidence indicates that transcription factors have emerged as important players in human cancer development and progression. The aberrant activation of these transcription factors leads to the deregulated expression of multiple gene sets. The activation or inactivation of transcription factors promotes cancer development, cell survival and proliferation and induces tumor angiogenesis.3, 4
Ying Yang 1 (YY1), a ubiquitously expressed GLI‐Krüppel zinc finger transcription factor, plays a regulatory role in a variety of fundamental biological processes, such as embryonic development, growth, apoptosis, differentiation and oncogenic transformation.5 YY1 is capable of influencing gene expression via its ability to directly or indirectly activate or suppress gene transcription.6 Moreover, YY1 has also been shown to regulate its targets through a post‐transcriptional mechanism.7, 8 The function of YY1 in tumorigenesis and cancer progression has proven to be controversial. YY1 has been shown to activate a variety of oncoproteins by interacting with E1A and C‐Myc.7, 8 YY1 also attenuates the stability of the tumor suppressor p53, indicating that YY1 acts as an oncogene.9 Some reports also indicate that YY1 mediates the activation of genes with tumor‐suppressive functions. A recent report demonstrates that YY1 can suppress the growth of different tumor cell types in vitro, including human breast carcinoma cells and glioblastoma cells.10 However, the role of YY1 in cancer development may vary depending on the underlying tissue‐specific conditions; further, the biological significance of YY1 in esophageal cancer cells is largely unknown.
One well‐characterized YY1 target is P21 (also known as P21WAF1/Cip1), which mediates p53‐dependent G1 growth arrest.11, 12, 13 P21 can be activated in p53‐dependent and p53‐independent manners and induces G1‐phase arrest by inhibition of key Cyclin/Cdk complexes and thus plays a role as a tumor suppressor.13, 14 YY1 inhibits P21 transcription in smooth muscle cells by preventing Sp1 occupancy of an upstream element in the P21 promoter, thus perturbing the assembly of the P21‐Cdk4‐Cyclin D1 complex.14 YY1 can also inhibit P21 complex formation with Cdk4 and Cyclin D1 in cancer cells.10
Heme oxygenase‐1 (HO‐1), an inducible isotype of the three HO family isoenzymes, catalyzes the heme ring into carbon monoxide (CO), free iron and biliverdin.15 HO‐1 is strongly induced by various stimuli, including heat shock, metals, cytokines and oxidative stress.16 HO‐1 and its metabolites have shown an anti‐proliferative role in human hepatocellular, breast and prostate cancer cells but an oncogenic role in melanoma and pancreatic cancer.17, 18 Beck et al. 15revealed a forward feedback interaction between HO‐1 and YY1 in both the abdominal aorta of rabbits and the carotid artery of rats. The effects of HO‐1 on ESCC development have not yet been analyzed, and there is no current information on the interplay of YY1 and HO‐1 in cancer cells.
Here, we investigated the expression of YY1 and its functional consequences in ESCC. We demonstrate that YY1 expression is significantly upregulated in ESCC tissues, compared to normal tissues. In addition, YY1 inhibits cell proliferation in ESCC TE‐1 cells through P21 and HO‐1.
Materials and Methods
Tissue samples
For real‐time PCR analysis, 24 normal esophageal tissues and 60 human ESCC tissues were used, as previously reported.19 For immunohistochemistry, another 102 ESCC samples and 52 matched, adjacent normal esophagus tissues were collected from the 102 patients. Fifteen normal esophageal tissues were obtained from surgical resections of trauma patients. These tissues were obtained postoperatively between 2010 and 2012 from the Gastrointestinal Center, Jiangyin People's Hospital, Medical School of University of Southeast of China (Jiangyin, China).
All patients gave signed, informed consent for their tissues to be used for scientific research. Ethical approval for the study was obtained from the Jiangyin People's Hospital. All diagnoses were based on pathological and/or cytological evidence; the histological features of the specimens were evaluated by two senior pathologists according to the classification criteria from the World Health Organization (WHO).20
Real‐time PCR
Total RNA from esophageal tissues was extracted with Trizol (Invitrogen, Carlsbad, CA, USA) and reversely transcribed to cDNA using an oligo(dT)12 primer and Superscript II (Invitrogen). The mRNA levels of YY1 and the internal standard glyceraldehyde 3‐phosphate dehydrogenase (GAPDH) were measured by real‐time quantitative PCR in triplicate on a Prism 7900 real‐time PCR machine (Applied Biosystems, Foster City, CA, USA). The specific primers for YY1 and GAPDH were listed in Table 1.
Table 1.
Primer sequences for real‐time polymerase chain reaction (PCR) analysis
| Gene | Forward primer | Reverse primer |
|---|---|---|
| GAPDH | 5′‐GAAGGTGAAGGTCGGAGTC‐3′ | 5′‐GAAGATGGTGATGGGATTTC‐3′ |
| YY1 | 5′‐GGATAACTCGGCCATGAGAA‐3′ | 5′‐ATAGGGCCTGTCTCCGGTAT‐3′ |
Immunohistochemistry
Three‐micrometer‐thick tissue paraffin sections were deparaffinized and heat‐treated with citrate buffer, pH 6.0, for 7 min as an epitope retrieval protocol. Endogenous peroxidase was blocked with 3% hydrogen peroxide for 15 min at room temperature, and non‐specific‐binding sites were blocked with 4% skimmed milk powder for 30 min. Sections were then incubated with the YY1 or HO‐1 antibody (Santa Cruz Biotechnology, Santa Cruz, CA, USA) for 1 h (dilution 1:200) and mixed with 2% skimmed milk powder to again reduce unspecific staining. Biotinylated secondary antibody was then added for 30 min. Avidin‐biotin‐peroxidase complex (Dako LSAB2 system; DAKO, Carpinteria, CA, USA) was added, and the color was developed using 3‐3′‐diaminobenzidine. Counterstaining was performed with hematoxylin. All steps were performed at room temperature.
The stained sections were scored using the following criteria: negative (−), <10% of the whole tissue mass stained; weakly positive (+1), 10–25 of the whole tissue mass stained; moderately positive (+ 2), 25%–75% of the whole tissue mass stained; and strongly positive (+3), >75% of the tissue showed positive.
YY1 overexpression and RNAi
The human YY1 (GenBank accession no. ENST00000262238) coding region was amplified by PCR using a primer pair specific to YY1. The amplified fragment was inserted into the pcDNA3.1 vector. The plasmid was then sequenced for confirmation. The shRNA targeting YY1 and the shRNA control (shRNA‐NC) was obtained from Santa Cruz Biotechnology. The siRNA targeting HO‐1 and the siRNA control (siRNA‐NC) was obtained from Genepharma (Shanghai, China).
Cell culture and stable transfection
The human esophageal cancer cell line, TE‐1, was maintained in DMEM supplemented with 10% FBS and antibiotics (Gibco, Grand Island, NY, USA). Cells were grown in a 37°C incubator with 5% CO2. To generate a stable control or YY1‐overexpressing clones, the cells were grown in a 24‐well culture plate to 70%–80% confluence and then transfected with either pcDNA3.1 or pcDNA3.1‐YY1 vector using Lipofectamine 2000 (Invitrogen) according to the manufacturer's instructions. The medium was replaced with DMEM containing 600 μg/mL G418 (Life Technologies, Gaithersburg, MD, USA) 48 h post‐transfection. After 3–4 weeks, G418‐resistant colonies were selected and screened for YY1 expression by Western blot.
Cell viability assay
Cell viability was evaluated using the 3‐(4,5‐dimethylthiazol‐2‐yl)‐2,5‐diphenyl‐2H‐tetrazolium bromide (MTT) assay. Cells were plated in 96‐well plates. The next day, the cells were transfected with plasmids or siRNAs according to the experimental design. The cells were then incubated with 20 μL MTT (5 mg/mL) for 4 h. After the medium was removed, 100 μL DMSO was added and the optical density (OD) at 490 nm was measured using a Microplate Reader (Bio‐Rad, Hercules, CA, USA).
Clonogenic assay of radiosensitivity
Stable cell lines were seeded onto six‐well plates at 200–2000 cells/well, depending on the dose of radiation. Cells were irradiated using 6‐MV X‐rays from linear accelerators (Varian Medical Systems, Alto, CA, USA) at a dose rate of 2 Gy/min; a 1.5‐cm bolus was used as a compensator. The cells were then grown for 7–10 days to allow for colony formation and were subsequently fixed and stained using crystal violet. Colonies consisting of 50 or more cells were counted as a clone.
Luciferase assays
A luciferase reporter containing a fragment of the HO‐1 promoter (−4798 to +16, relative to the transcription start site) was constructed by Shanghai Biobuy (Shanghai, China). For the luciferase assay, the reporter vector with the HO‐1 promoter was co‐transfected with pRL‐TK (Promega, Madison, WI, USA) to correct transfection efficiency. Luciferase activity was measured with the Dual‐Luciferase Reporter Assay System (Promega). Promoter activities were expressed as the ratio of Firefly luciferase to Renilla luciferase activities.
Focus formation
Cells transfected with the indicated vectors were plated at low density (1000 cells per 6‐cm plate), incubated for 10 days and fixed and stained with crystal violet. Foci and colonies containing more than 50 cells were counted using a microscope.
Western blot
Cells were lysed in Lysis buffer (Promega) and centrifuged at 4°C for 10 min. The supernatant was collected and subjected to Western‐blot. Fifty micrograms of protein from each lysate were fractionated by 10% SDS‐PAGE and transferred to polyvinylidene difluoride membranes (Millipore, Bedford, MA, USA). After blocking with 5% nonfat milk in PBS‐Tween‐20 for 1 h at room temperature, the membranes were blotted with the appropriate YY1, HO‐1 or GAPDH primary antibody (All from Santa Cruz Biotechnology) at a 1:1000 dilution. Membranes were then incubated with the appropriate secondary antibody linked to horseradish peroxidase at a 1:2000 dilution for 1 h at room temperature. After TBST washes, the blot was incubated in the ECL detection kit (Amersham Bioscience, Freiburg, Germany).
Co‐immunoprecipitation
Co‐immunoprecipitation was performed as previously described.21 In short, TE‐1 cells were transfected with vectors. After 48 h, the cells were then washed with cold phosphate‐buffered saline and harvested by adding 150 μL of IP buffer. Cells were sonicated and centrifuged to remove insoluble material. Following pre‐clearing for 1 h at 4°C, total cell extract (200 μg protein) was incubated with an anti‐P21 antibody (Epitomics, Burlngame, CA, USA) at 4°C with gentle rotation overnight. The antibody–protein complexes were precipitated by addition of 50 μL of protein G agarose and rotation for 2 h at 4°C. The supernatants were then removed by centrifuging, and the pellets were washed with IP buffer and subjected to Western blotting with antibodies against Cyclin D1 (Santa Cruz Biotechnology) and CDK4 (Epitomics).
Adenovirus preparation
Adenoviruses containing HO‐1 cDNA (Ad‐HO‐1) and EGFP (Ad‐EGFP) were used as previously reported.22 Both vectors were propagated in 293A cells. Cells were transduced with a multiplicity of infection (MOI) of 20 virus particles/cell 24 h before being used in experimentation.
Statistical analysis
Data were expressed as the mean ± standard error of the mean (SEM) of at least three independent experiments. Standard error bars were included for all data points. The data were then analyzed using Student's t‐test when only two groups were present or assessed by one‐way analysis of variance (anova) when more than two groups were compared. Correlation analysis between IHC staining score of YY1 and HO‐1 was performed using Spearman's rho test. Statistical analysis was performed using spss software (Release 17.0; SPSS Inc., San Rafael, CA, USA). Data were considered significant if P < 0.05.
Results
Expression of YY1 is upregulated in esophageal cancer tissues
To test the hypothesis that normal and cancerous esophageal tissues express a different subset of the YY1 gene, we measured the YY1 mRNA level using real‐time PCR. The histopathological features of the 24 normal esophageal tissues and 60 ESCC samples are summarized previously.19 The relative expression of YY1 in 24 normal esophageal tissues and 60 ESCC tissues is shown in Figure 1(a). Statistical analysis revealed significant differences in YY1 gene expression between cancerous and normal tissues (0.88 ± 0.24 vs 1.93 ± 0.38, P < 0.05, Fig. 1a).
Figure 1.
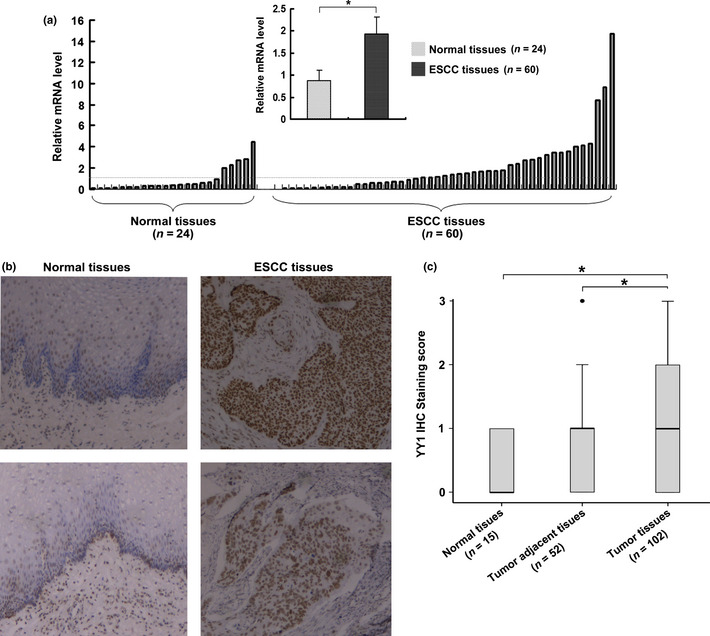
Upregulation of Ying Yang 1 (YY1) in esophageal squamous cell carcinoma (ESCC) samples. (a) Quantitative analyses of relative mRNA levels of YY1. YY1 mRNA expression in 24 normal esophageal tissue specimens and 60 ESCC tissue samples were analyzed by real‐time PCR. mRNA levels are normalized to GAPDH, *P < 0.05. (b) Representative immunohistochemistry (IHC) analysis of YY1 expression in normal esophageal tissue specimen and ESCC tissues (magnification, ×100). (c) Box plot representing the range of YY1 IHC staining score in normal esophageal tissues (n = 15), ESCC tissues (n = 102) and tumor adjacent tissues (n = 52), *P < 0.05.
To confirm the upregulation of YY1 on the protein level, immunohistochemistry staining was performed in 15 paraffin‐embedded normal esophageal tissues and 102 ESCC tissues, 52 of which had corresponding adjacent tumor tissues. The histopathological features of the patients are summarized in Table S1. Corresponding with the real‐time PCR analysis, an overall stronger staining for YY1 was frequently observed in the nucleus of ESCC tissues, whereas very weak staining of YY1 was observed in the normal samples (Fig. 1b). However, there was heterogeneity within the tumor samples. The difference in the YY1 expression pattern within tumor samples may be attributed to the heterogeneity of the ESCC background. When the samples were scored by a pathologist, as described in the Materials and Methods section, YY1 expression in normal esophageal tissues was similar to its expression in adjacent tumor tissues; however, there were significant differences in its expression among tumor tissues and between tumor tissues and adjacent tumor tissues (P = 0.003 and P = 0.001, respectively; Fig. 1c). These results demonstrated an increase in the transcription of YY1 in esophageal carcinoma, suggesting a characteristic of this malignancy.
YY1 suppressed esophageal cancer cell growth in vitro
To explore the role of YY1 in esophageal cancer cell growth, cells were first transfected with a YY1‐overexpressing vector (pcDNA.3.1‐YY1) or a control vector (pcDNA3.1), and the resulting growth was measured with MTT and colony formation. The results showed that increased YY1 expression suppressed cell growth and focus formation (Fig. 2a,b). We further knocked down YY1 expression using an shRNA. The downregulation of YY1 promoted cell proliferation and colony formation (Fig. 2c,d).
Figure 2.
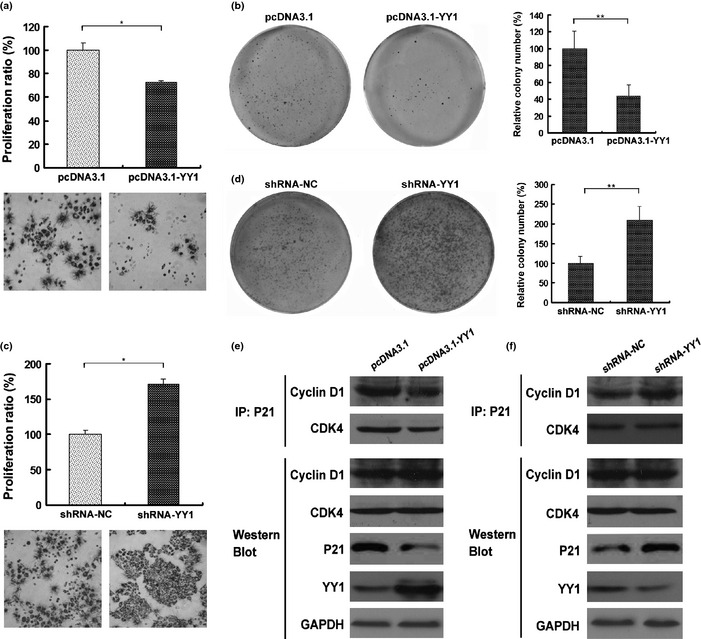
Effect of Ying Yang 1 (YY1) on cell proliferation and focus formation. (a) and (b) TE‐1 cell lines were seeded in a 96‐well plate and incubated for 48 h. Cell proliferation was measured by MTT. (b) and (d) Cells were stably transfected with indicated vectors. One thousand cells were seeded onto each plate. After 10 days, cells were stained with crystal violet. Colonies consisting of more than 50 cells were counted. Data are presented as the means ± SEM and were normalized to the control cells, *P < 0.05; **P < 0.01. (e) and (f) TE‐1 cells were transfected with indicated vectors for 48 h. Cell extracts were subjected either to Western blot analysis for YY1, P21, CDK4 or Cyclin D1, or co‐immunoprecipitation (IP) with p21 antibodies followed by blotting for CDK4 or Cyclin D1.
It has been reported that YY1 inhibits P21 expression and interfere with p21‐CDK4‐CyclinD1 cell cycle regulatory complex,10 which is implicated in cell cycle progression,23, 24 We therefore determined the effect of YY1 expression on p21‐CDK4‐CyclinD1 complex formation. As shown in Figure 2e, YY1 overexpression reduced p21 expression in TE‐1 cells. Moreover, co‐immunoprecipitation studies revealed that YY1 reduced intracellular levels of p21‐CDK4 and p21‐CyclinD1 complexes (Fig. 2e). Conversely, knockdown of YY1 by shRNA upregulated P21 expression and increased its binding to CDK4 and Cyclin D1 (Fig. 2f), indicating that YY1 inhibits ESCC cell growth and inhibits formation of a cell cycle regulatory complex. In contrast, YY1 overexpression or underexpression did not affect total levels of CyclinD1 and CDK4 (Fig. 2e,f). Taken together, these results indicate that YY1 suppresses esophageal tumor growth in vitro.
YY1 overexpression conferred radioresistance to TE‐1 cells
To investigate the effect of YY1 on the radiosensitivity of TE‐1 cells, we performed an in vitro clonogenic cell survival assay. TE‐1 cells that were stably transfected with pcDNA3.1‐YY1 exhibited higher clonogenic survival rates than cells that were treated with radiation alone. The sensitizer enhancement ratio (SER) was 0.66 for cells transfected with pcDNA3.1‐YY1, compared to cells transfected with pcDNA3.1 (Fig. 3). The data were further analyzed using two‐way anova to test the interaction effect between YY1 expression and radiation. The relationship between YY1 expression and radiation was statistically significant (P < 0.001) in TE‐1 cells. This result demonstrates that YY1 overexpression conferred radioresistance to TE‐1 cells.
Figure 3.
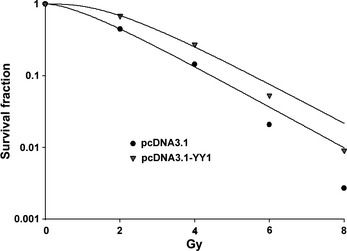
Effect of Ying Yang 1 (YY1) on cell radiosensitivity in TE‐1 cells. Clonogenic cell survival curves were generated for TE‐1 cells that were stably transfected with the indicated vectors and were then exposed to 2, 4, 6 or 8 Gy X‐ray irradiation. The survival data were normalized to those of the non‐irradiated control group. The SER was calculated for TE‐1 cells that were transfected with the YY1 overexpression vector (pcDNA3.1‐YY1). The values shown are for three independent experiments.
YY1 positively regulates HO‐1 expression
As a multifunctional transcription factor, YY1 harbors a variety of targets. YY1 was recently reported to activate HO‐1 in rat aortic smooth muscle cells.15 To investigate whether YY1 targets HO‐1 in esophageal cancer cells, we transfected TE‐1 cells with a YY1‐overexpressing vector (pcDNA.3.1‐YY1). The results revealed that the transfection of YY1 cDNA increased both YY1 and HO‐1 proteins (Fig. 4a). The effective knockdown of YY1 by shRNA was confirmed by Western blot and reduced HO‐1 expression (Fig. 4b).
Figure 4.
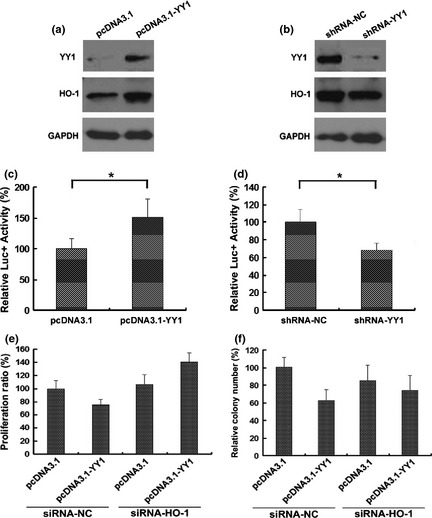
Ying Yang 1 (YY1) positively regulates heme oxygenase‐1 (HO‐1) in esophageal cancer cells. (a) TE‐1 cells were stably transfected with YY1 overexpression vector (pcDNA3.1‐YY1) or control vector (pcDNA3.1). YY1, HO‐1, P21 and GAPDH protein levels were detected by Western blot. (b) Cells were transfected with an shRNA targeting YY1 (shRNA‐YY1) or control shRNA (shRNA‐NC) for 24 h. HO‐1, YY1 and GAPDH protein levels were detected by Western blot. (c) A luciferase reporter containing the HO‐1 promoter was co‐transfected with indicated vectors or shRNAs into TE‐1 cells. After 24 h of incubation, luciferase activity was measured using the Dual‐Luciferase Reporter Assay System (Promega). TE‐1 cell lines were co‐transfected with indicated siRNA and vector, and evaluated for cell proliferation (e) and focus formation (f). *P < 0.05, compared with pcDNA3.1 tranfected cells.
HO‐1 expression was also measured using a luciferase construct containing the HO‐1 promoter (pGL3‐HO1). The co‐transfection of pGL3‐HO1 with the YY1 overexpression vector significantly increased the reporter activity, indicating that YY1 stimulates YY1 transcription (Fig. 4c). Conversely, the co‐transfection of the luciferase reporter with shRNA‐YY1 significantly decreased luciferase activity (Fig. 4d). These results demonstrate that YY1 positively regulates HO‐1 transcription in esophageal cancer cells. It was of interest to explore the possibility that YY1 mediated biological function through HO‐1. We found that the cell proliferation and focus formation inhibited by YY1 overexpression were both reversed by silencing of HO‐1 (Fig. 4e,f, and Fig. S1). These results together indicate that YY1 acts through HO‐1 to suppress cell growth in TE‐1 cells.
Expression of YY1 correlates that of HO‐1 in ESCC tissues
We next performed a correlation analysis between YY1 and HO‐1 expression in tissue samples. We detected the expression of YY1 and HO‐1 using IHC in 102 ESCC samples and 52 adjacent tumor esophageal tissues. Representative IHC staining of both YY1 and HO‐1 in the same tissue is shown in Figure 5(a). Tissue samples with strong YY1 staining in the nucleus exhibited positive HO‐1 staining, whereas weak YY1 expression showed negative HO‐1 staining. Statistical analysis revealed that the protein levels of the two genes correlated with each other (ρ = 0.505, P < 0.01; Fig. 5b), indicating that the expression of YY1 correlates with the expression of HO‐1 in human tissues.
Figure 5.
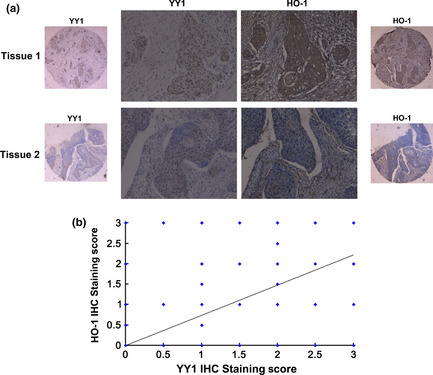
Correlation analyses between Ying Yang 1 (YY1) and heme oxygenase‐1 (HO‐1) expression in tissue samples. (a) Representative immunohistochemistry (IHC) staining of both YY1 and HO‐1 in the same tissue. (b) IHC staining of YY1 protein showed a significant positive correlation with HO‐1.
HO‐1 overexpression inhibited esophageal cancer cell growth
The effect of HO‐1 in esophageal cancer cell growth remains unknown. To explore its role in proliferation, cells were infected with the HO‐1‐overexpressing virus, Ad‐HO‐1 or control virus, Ad‐EGFP. Cells infected with Ad‐HO‐1 showed no significant difference in cell growth after 48 h of incubation, compared with cells infected with mock virus or Ad‐EGFP (data not shown). However, as shown in Fig. S2(a,b), the overexpression of HO‐1 by a vector or adenovirus caused a significant reduction in TE‐1 cell colony size but not colony number, indicating that HO‐1 could moderately suppress proliferation long term. These results suggest that HO‐1 is a YY1 target that plays a role in regulating cell growth in esophageal cancer cells.
Discussion
Ying Yang 1 has exhibited the multifunctional ability to regulate various biological processes.5, 6, 7, 8 Transcription factor YY1 is capable of either repressing or stimulating gene transcription.25, 26 It was estimated that over 7% of vertebrate genes contained YY1 binding sites, suggesting a ubiquitous regulation of YY1 in multiple biological processes, including proliferation, apoptosis, development and mitochondrial function.27, 28
Ying Yang 1 is overexpressed in most cancer types, such as prostate carcinoma,29 cervical cancer,30 colon cancer,31 breast cancer,32 ovarian cancer,33 and gliomas.34 In the present study, we found that the mRNA and protein levels of YY1 in ESCC tissues were significantly increased compared with normal esophageal tissues or adjacent tumor tissues. Using a human ESCC TE‐1 cell line, we found that YY1 inhibits cell proliferation but confers cell radioresistance. Our study supports previous findings demonstrating that in addition to P21, YY1 also stimulated HO‐1 in ESCC cells. The expression of YY1 significantly correlated with that of HO‐1 in ESCC tissues.
The role of YY1 in tumorigenesis and cancer progression is still a matter of intense debate.35 The controversial results indicate that YY1 exhibits distinct effects on tumorigenesis, which may represent different phases of the multi‐step carcinogenesis process. It may depend on the type of tumor or other still‐undefined factors. Here, we found that YY1 inhibits TE‐1 cell proliferation by enhancing the binding of P21 to Cyclin D1 and CDK4, a protein complex known to mediate cell cycle progression. YY1 controls a plethora of genes, including c‐Myc, c‐Fos, Her2, VEGF and cyclooxygenase‐2.36 Here, we also identified HO‐1, the rate‐limiting enzyme in heme degradation, as a novel downstream target of YY1 in esophageal cancer cells. Cell proliferation and focus formation inhibited by YY1 overexpression were both reversed by silencing of HO‐1, suggesting that YY1 mediates biological function through HO‐1. However, the consensus binding sequence for YY1 was not found in the HO‐1 promoter, suggesting that YY1 may act as a co‐activator to facilitate HO‐1 transcription. The overexpression of YY1 induces the expression of HO‐1 in rat aortic smooth muscle cells (RASMCs) in vitro, and the interaction between YY1 and HO‐1 is complex and may involve a feed forward amplification.15
The role of HO‐1 in tumor growth is controversial. HO‐1 inhibits cell proliferation, migration and invasion in prostate cancer cells and impairs tumor growth in vivo by repressing MMP‐9.37, 38 In breast cancer, HO‐1 may inhibit cell proliferation.18 The overexpression of human HO‐1 after its retroviral transfer into Panc‐1 cells did not interfere with tumor growth in vitro, while the development of tumors in vivo was accelerated upon transfection with HO‐1.39 However, the overexpression of HO‐1 enhances the proliferation and increases angiogenic potential of murine and human melanoma cells. Moreover, the increased production of HO‐1 in B16 tumor cells shortens the survival of mice.40 In the present report, we found that HO‐1 inhibited ESCC proliferation using an HO‐1‐overexpression vector and an HO‐1‐overexpression adenovirus. Smaller and fewer colonies were found in the HO‐1‐overexpressed cells.
In summary, the expression of YY1 is upregulated in ESCC tissues and modulates cell proliferation through HO‐1 in esophageal cancer cells. Thus, YY1 may be involved in the progression and pathogenesis of ESCC.
Disclosure
The authors have no conflict of interest.
Supporting information
Fig. S1. Effect of heme oxygenase‐1 (HO‐1) on cell focus formation.
Fig. S2. Ying Yang 1 (YY1) mediated focus formation through heme oxygenase‐1 (HO‐1).
Table S1. Patient demographics for the IHC analysis.
Acknowledgments
This work is supported by the National Natural Science Foundation of China (81102078 and 81172597), Natural Science Foundation of Jiangsu Province (BK2012561), Innovative Project of Jiangsu Province (BL2012046), Changzhou Social Development (CE20125026) and the Priority Academic Program Development of Jiangsu Higher Education Institutions (PAPD).
(Cancer Sci 2013; 104: 1544–1551)
References
- 1. Jemal A, Siegel R, Xu J, Ward E. Cancer statistics. CA Cancer J Clin 2010; 60: 277–300. [DOI] [PubMed] [Google Scholar]
- 2. Enzinger PC, Mayer RJ. Esophageal cancer. N Engl J Med 2003; 349: 2241–52. [DOI] [PubMed] [Google Scholar]
- 3. Darnell JE Jr. Transcription factors as targets for cancer therapy. Nat Rev Cancer 2002; 2: 740–9. [DOI] [PubMed] [Google Scholar]
- 4. Libermann TA, Zerbini LF. Targeting transcription factors for cancer gene therapy. Curr Gene Ther 2006; 6: 17–33. [DOI] [PubMed] [Google Scholar]
- 5. Rizkallah R, Alexander KE, Kassardjian A, Luscher B, Hurt MM. The transcription factor YY1 is a substrate for Polo‐like kinase 1 at the G2/M transition of the cell cycle. PLoS One 2011; 6: e15928. [DOI] [PMC free article] [PubMed] [Google Scholar]
- 6. Gordon S, Akopyan G, Garban H, Bonavida B. Transcription factor YY1: structure, function, and therapeutic implications in cancer biology. Oncogene 2006; 25: 1125–42. [DOI] [PubMed] [Google Scholar]
- 7. Li M, Luo J, Brooks CL, Gu W. Acetylation of p53 inhibits its ubiquitination by Mdm2. J Biol Chem 2002; 277: 50607–11. [DOI] [PubMed] [Google Scholar]
- 8. Luo J, Li M, Tang Y, Laszkowska M, Roeder RG, Gu W. Acetylation of p53 augments its site‐specific DNA binding both in vitro and in vivo . Proc Natl Acad Sci USA 2004; 101: 2259–64. [DOI] [PMC free article] [PubMed] [Google Scholar]
- 9. el Affar B, Gay F, Shi Y et al Essential dosage‐dependent functions of the transcription factor yin yang 1 in late embryonic development and cell cycle progression. Mol Cell Biol 2006; 26: 3565–81. [DOI] [PMC free article] [PubMed] [Google Scholar]
- 10. Ishii H, Hulett MD, Li JM, Santiago FS, Parish CR, Khachigian LM. Yin Yang‐1 inhibits tumor cell growth and inhibits p21WAF1/Cip1 complex formation with Cdk4 and Cyclin D1. Int J Oncol 2012; 40: 1575–80. [DOI] [PubMed] [Google Scholar]
- 11. Abbas T, Dutta A. p21 in cancer: intricate networks and multiple activities. Nat Rev Cancer 2009; 9: 400–14. [DOI] [PMC free article] [PubMed] [Google Scholar]
- 12. Roninson IB. Oncogenic functions of tumour suppressor p21(Waf1/Cip1/Sdi1): association with cell senescence and tumour‐promoting activities of stromal fibroblasts.Cancer Lett 2002; 179: 1–14. [DOI] [PubMed] [Google Scholar]
- 13. Sarbia M, Stahl M, zur Hausen A et al Expression of p21WAF1 predicts outcome of esophageal cancer patients treated by surgery alone or by combined therapy modalities. Clin Cancer Res 1998; 4: 2615–23. [PubMed] [Google Scholar]
- 14. Santiago FS, Ishii H, Shafi S et al Yin Yang‐1 inhibits vascular smooth muscle cell growth and intimal thickening by repressing p21WAF1/Cip1 transcription and p21WAF1/Cip1‐Cdk4‐Cyclin D1 assembly. Circ Res 2007; 101: 146–55. [DOI] [PubMed] [Google Scholar]
- 15. Beck K, Wu BJ, Ni J et al Interplay between heme oxygenase‐1 and the multifunctional transcription factor yin yang 1 in the inhibition of intimal hyperplasia. Circ Res 2010; 107: 1490–7. [DOI] [PubMed] [Google Scholar]
- 16. Wu CC, Hsu MC, Hsieh CW, Lin JB, Lai PH, Wung BS. Upregulation of heme oxygenase‐1 by Epigallocatechin‐3‐gallate via the phosphatidylinositol 3‐kinase/Akt and ERK pathways. Life Sci 2006; 78: 2889–97. [DOI] [PubMed] [Google Scholar]
- 17. Zou C, Zhang H, Li Q et al Heme oxygenase‐1: a molecular brake on hepatocellular carcinoma cell migration. Carcinogenesis 2011; 3: 1840–8. [DOI] [PubMed] [Google Scholar]
- 18. Hill M, Pereira V, Chauveau C et al Heme oxygenase‐1 inhibits rat and human breast cancer cell proliferation: mutual cross inhibition with indoleamine 2,3‐dioxygenase. FASEB J 2005; 19: 1957–68. [DOI] [PubMed] [Google Scholar]
- 19. Zhou J, Zhang S, Xie L et al Overexpression of DNA polymerase iota (Poliota) in esophageal squamous cell carcinoma. Cancer Sci 2012; 103: 1574–9. [DOI] [PMC free article] [PubMed] [Google Scholar]
- 20. Sobin LH, Wittekind C. TNM Classification of Malignant Tumor, 6th edn New Jersey: John Wiley and Sons, 2002. [Google Scholar]
- 21. Zhou J, Zhang S, Xue J et al Activation of peroxisome proliferator‐activated receptor alpha (PPARalpha) suppresses hypoxia‐inducible factor‐1alpha (HIF‐1alpha) signaling in cancer cells. J Biol Chem 2012; 287: 35161–9. [DOI] [PMC free article] [PubMed] [Google Scholar]
- 22. Zhang S, Song C, Zhou J et al Amelioration of radiation‐induced skin injury by adenovirus‐mediated heme oxygenase‐1 (HO‐1) overexpression in rats. Radiat Oncol 2012; 7: 4. [DOI] [PMC free article] [PubMed] [Google Scholar]
- 23. Alt JR, Gladden AB, Diehl JA. p21(Cip1) Promotes cyclin D1 nuclear accumulation via direct inhibition of nuclear export. J Biol Chem 2002; 277: 8517–23. [DOI] [PubMed] [Google Scholar]
- 24. Stein GH, Drullinger LF, Soulard A, Dulic V. Differential roles for cyclin‐dependent kinase inhibitors p21 and p16 in the mechanisms of senescence and differentiation in human fibroblasts. Mol Cell Biol 1999; 19: 2109–17. [DOI] [PMC free article] [PubMed] [Google Scholar]
- 25. Sui G, el Affar B, Shi Y et al Yin Yang 1 is a negative regulator of p53. Cell 2004; 117: 859–72. [DOI] [PubMed] [Google Scholar]
- 26. Atchison M, Basu A, Zaprazna K, Papasani M. Mechanisms of Yin Yang 1 in oncogenesis: the importance of indirect effects. Crit Rev Oncog 2011; 16: 143–61. [DOI] [PMC free article] [PubMed] [Google Scholar]
- 27. Hyde‐DeRuyscher RP, Jennings E, Shenk T. DNA binding sites for the transcriptional activator/repressor YY1. Nucleic Acids Res 1995; 23: 4457–65. [DOI] [PMC free article] [PubMed] [Google Scholar]
- 28. Cunningham JT, Rodgers JT, Arlow DH, Vazquez F, Mootha VK, Puigserver P. mTOR controls mitochondrial oxidative function through a YY1‐PGC‐1alpha transcriptional complex. Nature 2007; 450: 736–40. [DOI] [PubMed] [Google Scholar]
- 29. Seligson D, Horvath S, Huerta‐Yepez S et al Expression of transcription factor Yin Yang 1 in prostate cancer. Int J Oncol 2005; 27: 131–41. [PubMed] [Google Scholar]
- 30. Baritaki S, Sifakis S, Huerta‐Yepez S et al Overexpression of VEGF and TGF‐beta1 mRNA in Pap smears correlates with progression of cervical intraepithelial neoplasia to cancer: implication of YY1 in cervical tumorigenesis and HPV infection. Int J Oncol 2007; 31: 69–79. [PubMed] [Google Scholar]
- 31. Chinnappan D, Xiao D, Ratnasari A, Andry C, King TC, Weber HC. Transcription factor YY1 expression in human gastrointestinal cancer cells. Int J Oncol 2009; 34: 1417–23. [PubMed] [Google Scholar]
- 32. Allouche A, Nolens G, Tancredi A et al The combined immunodetection of AP‐2alpha and YY1 transcription factors is associated with ERBB2 gene overexpression in primary breast tumors. Breast Cancer Res 2008; 10: R9. [DOI] [PMC free article] [PubMed] [Google Scholar]
- 33. Berchuck A, Iversen ES, Lancaster JM et al Patterns of gene expression that characterize long‐term survival in advanced stage serous ovarian cancers. Clin Cancer Res 2005; 11: 3686–96. [DOI] [PubMed] [Google Scholar]
- 34. Baritaki S, Chatzinikola AM, Vakis AF et al YY1 Over‐expression in human brain gliomas and meningiomas correlates with TGF‐beta1, IGF‐1 and FGF‐2 mRNA levels. Cancer Invest 2009; 27: 184–92. [DOI] [PubMed] [Google Scholar]
- 35. Deng Z, Cao P, Wan MM, Sui G. Yin Yang 1: a multifaceted protein beyond a transcription factor. Transcription 2010; 1: 81–4. [DOI] [PMC free article] [PubMed] [Google Scholar]
- 36. Zhang Q, Stovall DB, Inoue K, Sui G. The oncogenic role of Yin Yang 1. Crit Rev Oncog 2011; 16: 163–97. [DOI] [PMC free article] [PubMed] [Google Scholar]
- 37. Gueron G, De Siervi A, Ferrando M et al Critical role of endogenous heme oxygenase 1 as a tuner of the invasive potential of prostate cancer cells. Mol Cancer Res 2009; 7: 1745–55. [DOI] [PubMed] [Google Scholar]
- 38. Sacca P, Meiss R, Casas G et al Nuclear translocation of haeme oxygenase‐1 is associated to prostate cancer. Br J Cancer 2007; 97: 1683–9. [DOI] [PMC free article] [PubMed] [Google Scholar]
- 39. Sunamura M, Duda DG, Ghattas MH et al Heme oxygenase‐1 accelerates tumor angiogenesis of human pancreatic cancer. Angiogenesis 2003; 6: 15–24. [DOI] [PubMed] [Google Scholar]
- 40. Was H, Cichon T, Smolarczyk R et al Overexpression of heme oxygenase‐1 in murine melanoma: increased proliferation and viability of tumor cells, decreased survival of mice. Am J Pathol 2006; 169: 2181–98. [DOI] [PMC free article] [PubMed] [Google Scholar]
Associated Data
This section collects any data citations, data availability statements, or supplementary materials included in this article.
Supplementary Materials
Fig. S1. Effect of heme oxygenase‐1 (HO‐1) on cell focus formation.
Fig. S2. Ying Yang 1 (YY1) mediated focus formation through heme oxygenase‐1 (HO‐1).
Table S1. Patient demographics for the IHC analysis.