

Abstract
The association of microRNAs (miRs) with cancer progression has been established in many cancers including esophageal squamous cell carcinoma (ESCC). A public microarray database showed that the expression of miR‐150 was lower in ESCC than in normal esophageal mucosa. Here, we focused on ZEB1, epithelial‐mesenchymal‐transition (EMT)‐inducer, as a target gene of miR‐150 based on in silico predictions. The purpose of this study was to clarify the clinicopathological significance of miR‐150 in ESCC, and to investigate miR‐150′s EMT‐regulatory ability. Quantitative RT‐PCR was used to evaluate miR‐150 expression in 108 curative resected ESCC samples to determine the clinicopathological significance. Moreover, we examined the in vitro and in vivo function of miR‐150 via degradation of ZEB1. MiR‐150 expression was significantly lower in cancer tissues compared to adjacent non‐cancerous tissues (P < 0.001). Low expression of miR‐150 in ESCC contributed to malignant potential, such as tumor depth, lymph node metastasis, lymphatic invasion, venous invasion, clinical staging, and poor prognosis (P < 0.05). In vitro assays showed that EMT‐inducer‐ZEB1 is a new direct target of miR‐150. Moreover, miR‐150 induced MET‐like changes in TE‐8 cells through ZEB1 degradation (e.g., E‐cadherin expression, vimentin repression, epithelial morphology, and suppression of migration ability), and significantly inhibited tumorigenicity and tumor growth in a mouse xenograft model. Analysis of the regulation of ZEB1 by miR‐150 could provide new insights into preventing metastasis and also suggests novel targeted therapeutic strategies in ESCC. (Cancer Sci 2013; 104: 48–54)
Progress in perioperative management and definitive or adjuvant therapy has led to improved survival of esophageal squamous cell carcinoma (ESCC) patients. However, for patients with advanced disease, prognosis remains poor.1, 2, 3 Local ESCCs directly invade other organs, presenting serious obstacles to radical resection, a characteristic which enhances local recurrence. Moreover, ESCCs cause early lymphatic and hematogenous disseminations more frequently compared to other solid gastrointestinal cancers.4, 5 Therefore, clinical indicators that accurately predict ESCC progression and prognosis are essential for improving patient survival.
Recently, microRNAs (miRs) have attracted attention for their involvement in the regulation of gene expression. miRs are small non‐coding RNAs, approximately 18–25 nucleotides in length, which partially bind to the 3′‐untranslated region (3′‐UTR) of target mRNAs, leading to mRNA degradation and/or translational repression.6 Many miRs play an essential role in cellular processes, such as proliferation, differentiation, apoptosis, and cancer progression, depending on their specific gene targets. To find cancer‐associated miRs in ESCC, we re‐analyzed GSE6188 in the Gene Expression Omnibus public microarray database.7 In this way, we detected five downregulated miRs in ESCC compared to normal esophageal mucosa (Fig. S1). First, we examined the clinical significance of miR‐133 in ESCC samples and validated the high expression of miR‐133 in ESCC relative to normal mucosa. However, we could not show the prognostic value or a correlation with clinicopathological factors in miR‐133 analysis. MiR‐375 had previously been reported to function as a tumor suppressing miR via IGF1R in ESCC.8 Therefore, we focused on miR‐150, known to be downregulated in malignant lymphoma,9 chronic myeloid leukemia,10 mantle cell lymphoma,11 and pituitary tumor,12 and upregulated in osteosarcoma.13 On the other hand, miR‐150 represses MYB which is associated with cancer progression in many malignancies.14, 15 Therefore, we suggested that miR‐150 may function as a tumor suppressing miR in ESCC.
The epithelial‐mesenchymal transition (EMT) and the mesenchymal‐epithelial transition (MET) have attracted attention as regulatory mechanisms of invasion and metastasis in many cancers including ESCC.16 EMT‐induced cancer cells are more efficient at forming cancer stem cells with invasive and tumorigenic phenotypes.17 Therefore, EMT‐regulatory miRs in cancers have been considered as new diagnostic and therapeutic tool for human malignancies.18, 19 In this study, we focused on EMT‐inducers ZEB1 as target genes of miR‐150 based on in silico miR target prediction tools. ZEB1 were previously reported to be associated with EMT induction.18
The purpose of this study was to clarify the clinicopathological significance of miR‐150 in ESCC, and to investigate miR‐150‐mediated regulation of EMT. Therefore, we examined the expression levels of miR‐150 in clinical ESCC samples, and demonstrated the direct binding of miR‐150 to ZEB1′s 3′‐UTR using a luciferase reporter assay. Furthermore, miR‐150 functional analysis was performed in TE‐8 cells which express ZEB1, and repress E‐cadherin, similar to EMT‐induced cancer cells.20
Material and Methods
Clinical samples and RNA isolation
Primary ESCC (n = 108) and corresponding normal esophageal epithelia (n = 108) were obtained from ESCC patients (97 males and 11 females) who had undergone potentially curative surgery at the Department of General Surgical Science, Gunma University, between 1990 and 2009. These samples were used after obtaining written informed consent in accordance with institutional guidelines and the Helsinki Declaration. The patients' ages ranged from 42 to 81 years, with a mean of 64.9. The median follow‐up period for survivors was 27 months (range: 1–128 months). The pathologic features of the specimens were classified based on the sixth edition of the TNM classification of the International Union against Cancer (UICC). The operations were classified as curative surgery, there was no evidence of residual tumor, and the resected margins were microscopically free of tumor (R0). Normal tissues were obtained far from the center of the cancer in surgical specimens. All specimens were immediately frozen in liquid nitrogen and stored at −80°C until RNA extraction. Total RNA was extracted using miRNeasy Mini kit (Qiagen, Spoorstraat, the Netherlands) according to the manufacturer's instructions.
Evaluation of miR‐150 expression in clinical ESCC samples
For miR‐150 quantitative real‐time reverse transcriptase PCR (RT‐PCR), cDNA was synthesized from 10 ng of total RNA using TaqMan MicroRNA Reverse Transcription Kit and specific stem‐loop reverse transcription primers (Applied Biosystems, Carlsbad, CA, USA) according to the manufacturer's protocol. PCR was performed in a LightCycler™ 480 System (Roche, Basel, Switzerland). The 20 μL PCR mix including the LightCycler 480 Probes Master kit (Roche) was incubated in a 96 well optical plate at 95°C for 10 min and then followed by 45 cycles of 95°C for 10 s and 60°C for 30 s. Expression levels of miR‐150 were normalized to that of the small nuclear RNA RNU6B and analyzed using the method.
Cell line
The human ESCC cell line TE‐8 was kindly provided by the Cell Resource Center of Biomedical Research, Institute of Development, Aging and Cancer, Tohoku University. TE‐8 cells express ZEB1, and repress E‐cadherin‐like EMT‐induced cancer cells. Therefore, this cell line was selected to evaluate the relationship between ZEB1 and miR‐150. TE‐8 cells were cultured in RPMI 1640 medium (Wako, Osaka, Japan) supplemented with 10% fetal bovine serum and 1% penicillin–streptomycin antibiotics (Invitrogen, Carlsbad, CA, USA). It was previously validated that these cells were not cross‐contaminated with other cell lines by STR‐PCR in the RIKEN BioResource Center.
Plasmid construction
The sequence in the 3′‐UTR region of ZEB1 targeted by miR‐150 was predicted with Targetscan (release 5.1) and the human ZEB1 3′‐UTR (full length: 542 bp) was amplified from the genomic DNA of normal cells. The amplified fragment was inserted into the XhoI restriction sites of the dual‐luciferase plasmid pmirGLO vector (Promega, Madison, WI, USA) by In‐Fusion® Dry‐Down PCR Cloning Kit (Clontech, Mountain View, CA, USA). The nucleotide sequences of the plasmids were confirmed by sequencing.
Transfection of the miR‐150 precursor (PremiR‐150)
Pre‐miR™ miRNA Precursor Molecule mimicking miR‐150 (premiR‐150; Applied Biosystem) or non‐specific control miR (Pre‐miR™ miRNA Negative Control #1; premiR‐nc; Applied Biosystem) was transfected at 30 nmol/L into TE‐8 cells using Lipofectamine RNAiMAX (Invitrogen) according to the manufacturer's instruction. Before conducting assays, we confirmed that miR‐150 expression in premiR‐150‐treated cells was significantly higher than that in the parent TE‐8 cells and premiR‐nc treated cells using RT‐PCR.
Luciferase assay
TE‐8 cells were seeded in a 96‐well plate and then co‐transfected with 0.2 μg pmirGLO Dual‐Luciferase miRNA Target Expression Vector (Promega), 100 nmol/L premiR‐150, and 0.5 μL Lipofectamine RNAiMAX in 50 μL Opti‐MEM with Reduced‐Serum Medium (Invitrogen). PremiR‐nc was used as a control. Forty‐eight hours following transfection, the activities of firefly luciferase and Renilla luciferase in cell lysates were measured using the Dual‐Glo® Luciferase Assay System (Promega) and the Fluoroskan Ascent FL (Thermo Fischer Scientific, Waltham, MA, USA). Each firefly luciferase activity was normalized to Renilla luciferase activity. All transfection experiments were conducted in triplicate.
Protein expression analysis
Western blotting was used to confirm the expression of ZEB1, E‐cadherin, vimentin, and beta‐actin proteins in premiR‐150‐transfected cells. Total protein (40 μg) was electrophoresed and then electrotransferred at 200 mA for 180 min at 4°C. These proteins were detected using anti‐ZEB1 rabbit monoclonal antibody (1:1000) (D80D3; Cell Signaling Technology), anti‐E‐cadherin mouse monoclonal antibody (1 μg/mL) (MAB1838; R&D Systems), or anti‐vimentin rabbit monoclonal antibody (1:1000) (D21H3; Cell Signaling Technology). Anti‐beta‐actin mouse monoclonal antibody (clone AC‐74; Sigma) diluted 1:1000 served as a control. Bands on the membrane were detected using Retiga‐4000R and QCapture Pro 6.0, an enhanced chemiluminescence detection system according to the manufacturer's instructions (QImaging, Nippon Roper, Tokyo, Japan).
Evaluation of ZEB1 expression in clinical ESCC samples
For ZEB1 mRNA evaluation, quantitative real‐time RT‐PCR was performed from 10 ng total RNA from each of 108 ESCC patients with the GoTaq® 1‐Step RT‐qPCR System (Promega) according to the manufacturer's protocols. ZEB1 levels were quantified using LightCycler 480 (Roche Applied Science) with the following specific ZEB1 primers (forward, 5′‐TTAGTTGCTCCCTGTGCAGTT‐3′ and reverse, 5′‐TAGGAGCCAGAATGGGAAAAG‐3′). The expression levels were normalized to GAPDH (forward, 5′‐AAGGTGAAGGTCGGAGTCAAC‐3′ and reverse, 5′‐CTTGATTTTGGAGGGATCTCG‐3′).
Immunocytochemical analysis
Transfected TE‐8 cells were seeded on glass coverslips and incubated for 24 h at 37°C. After washing with PBS to remove non‐attached cells, the adherent cells were fixed with 90% methanol (−20°C) for 5 min, followed by incubation with anti‐E‐cadherin mouse monoclonal antibody (20 μg/mL) (MAB1838; R&D Systems), or anti‐vimentin rabbit monoclonal antibody (1:100) (D21H3; Cell Signaling Technology) for 1 h at room temperature. To detect these antibodies, the cells were finally incubated in streptavidin‐biotin peroxidase complex solution (Nichirei Co., Tokyo, Japan), as described previously.21
Wound healing assay
We examined the migration of premiR‐nc‐ and premiR‐150‐transfected TE‐8 cells using an in vitro wound healing assay. Briefly, the transfected TE‐8 cells were grown in 24‐well plates. After the growing cell layers had reached confluence, we inflicted a uniform straight line wound in each well using a pipette tip and washed the wounded layers with PBS to remove all cell debris. The cells were cultured in 5% CO2 at 37°C, and we subsequently evaluated the closure or filling in of the wounds at 24 h using bright‐field microscopy (Nikon TMS; Nikon, Tokyo, Japan) at 40× magnification. All experiments were performed in triplicate.
Proliferation assay
Cell proliferation analysis was performed using cells that had been transfected with negative control or premiR‐150. The cells were plated in 96 well plates in 100 μL of medium at about 3000 cells per well. For the quantitation of cell viability in the WST‐8 assay (Dojindo Lab., Tokyo, Japan), 10 μL of the cell counting solution were added to each well after 0, 24, 48, 72, and 96 h and incubated at 37°C for 2 h. The cell proliferation rate was then determined by measuring the absorbance of the well at 450 nm with the reference wavelength set at 650 nm. Absorbance was read using a microtiter plate reader (Molecular Devices, Sunnyvale, CA, USA).
Mouse xenograft model
Forty‐eight hours following transfection with premiR‐150 or premiR‐nc, 6 week old female BALB/c nude mice received subcutaneous injections with 1 × 10⁴, 1 × 10⁵, or 1 × 10⁶ transfected TE‐8 cells. The tumor volume and tumorigenicity were determined by caliper measurements at day 30. Tumor volume was calculated using the formula: Volume = S × S × L/2, where S is the short length of the tumor in mm and L is the greatest length of the tumor in mm.
Immunohistochemistry
Formalin‐fixed, paraffin‐embedded tis‐sues were deparaffinized, blocked, incubated at 4°C overnight with anti‐ ZEB1 rabbit monoclonal antibody (1:100) (D80D3; Cell Signaling Technology), or anti‐E‐cadherin mouse monoclonal antibody (20 μg/mL) (MAB1838; R&D Systems) at a dilution of Can Get Signal immunostain solution A (Toyobo Life Science, Japan). Immunohistochemistry was performed using a Histofine® Simple Stain MAX PO (Nichirei Co., Tokyo, Japan). All sections were counterstained with hematoxylin.
Statistical analysis
Differences between two groups were estimated using Student's t test and the Chi‐square test, and the repeated measures anova test. Kaplan–Meier curves were generated for overall survival, and statistical significance was determined using the log‐rank test. A probability value of < 0.05 was considered significant. All statistical analyses were performed using JMP5.0 software (SAS Institute Inc., Cary, NC, USA).
Results
The clinical significance of miR‐150 expression in ESCC patients
Five down‐regulated miRs (including miR‐150) in ESCC were selected based upon our re‐analysis of GSE6188 (Fig. S1 A, B). Among them, we focused on miR‐150 because this miR had previously been reported as a tumor suppressor in hematopoietic malignancies. We assessed miR‐150 expression in 108 ESCC samples (T) and 108 paired non‐cancerous samples (N). The expression of miR‐150 was significantly lower in T compared to N (P < 0.001) (Fig. 1A).
Figure 1.
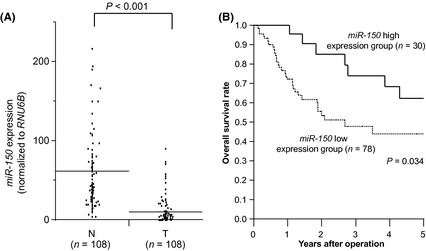
Clinical significance of miR‐150 expression in ESCC samples. (A) MiR‐150 expression in cancerous (T) (n = 108) and adjacent non‐cancerous (N) (n = 108) tissues from ESCC patients assessed by TaqMan RT‐PCR. All data were normalized to RNU6B. Horizontal lines indicate each means. (B) Kaplan‐Meier curves and miR‐150 expression in ESCC.
We divided 108 ESCC patients into two groups according to the levels of miR‐150 expression in T. The cut‐off point was the mean expression level of miR‐150 in T (high expression group, n = 30; low expression group, n = 78). Clinicopathological factors were significantly different in the miR‐150 low expression group. The depth of tumor invasion was greater (P = 0.039), and there was greater lymph node metastasis (P = 0.035), lymphatic invasion (P = 0.005), venous invasion (P = 0.006), and clinical staging (P = 0.018) compared to the miR‐150 high expression group. However, no significant differences were observed regarding age and gender (Table 1).
Table 1.
miR‐150 expression and clinicopathological factors in 108 ESCC patients
| Factors | miR‐150/RNU6B | P value | |
|---|---|---|---|
| High expression | Low expression | ||
| n = 30 | n = 78 | ||
| Age | 64.8 ± 7.6 | 65.0 ± 8.4 | 0.94 |
| Gender | |||
| Male | 26 | 71 | 0.48 |
| Female | 4 | 7 | |
| Depth | |||
| T1, 2 | 15 | 21 | 0.039a |
| T3, 4 | 15 | 57 | |
| Lymph node metastasis | |||
| Absent | 14 | 20 | 0.035a |
| Present | 16 | 58 | |
| Lymphatic invasion | |||
| Absent | 7 | 4 | 0.005a |
| Present | 23 | 74 | |
| Venous invasion | |||
| Absent | 12 | 12 | 0.006a |
| Present | 18 | 66 | |
| Stage | |||
| I | 7 | 5 | 0.018a |
| II | 12 | 24 | |
| III | 9 | 30 | |
| IV | 2 | 19 | |
P < 0.05.
In the overall survival curve, patients in the miR‐150 low expression group had a significantly poorer prognosis than those in the miR‐150 high expression group (P = 0.034) (Fig. 1B).
In univariate analysis, low expression of miR‐150 in ESCC was found to be a significant prognostic factor for poor survival in addition to the depth of tumor invasion, lymph node metastasis, lymphatic invasion, and venous invasion. However, multivariate analysis of the factors found to be significant in the univariate analysis showed that low miR‐150 expression was not an independent prognostic factor (P = 0.25, data not shown).
EMT‐inducer ZEB1 is a new target gene of miR‐150
Using in silico miR target prediction tools, such as TargetScan, we identified the sequence of the miR‐150 binding sites in the 3′‐UTR of transcripts encoding EMT‐inducers ZEB1 (Fig. 2A). To investigate miR‐150 binding and repression, a luciferase reporter assay was carried out with a vector which included the 3′‐UTR of ZEB1 downstream from the luciferase reporter gene. Transient cotransfection of TE‐8 cells with the reporter plasmid and premiR‐150 significantly reduced luciferase activity in comparison with the parent TE‐8 cells and premiR‐nc treated cells (*P < 0.05) (Fig. 2B). These data suggested that ZEB1 mRNA was a direct functional target of miR‐150.
Figure 2.

ZEB1 was directly suppressed by miR‐150 in ESCC. (A) MiR‐150 binding sites in the ZEB1 3′‐UTR. Putative conserved target sites in 3′‐UTR were identified using in silico miR target prediction tools. (B) Luciferase assays of premiR‐150 transfected TE‐8 cells. The error bars represent the SD from eight replicates. Left bar: ZEB1 3′UTR luciferase vector only. Middle bar: ZEB1 3′‐UTR luciferase vector + premiR‐nc. Right bar: ZEB1 3′‐UTR luciferase vector + premiR‐150. (C) Western blotting of ZEB1, E‐cadherin, and vimentin protein in premiR‐150 transfected TE‐8 cells. These proteins were normalized to the level of beta‐actin. Bar graph shows miR‐150 expression in in the premiR‐150‐treated group and control cell groups (*P < 0.05). (D) MiR‐150 and ZEB1 expression levels in ESCC samples were measured by real‐time RT‐PCR. ZEB1 expression was inversely correlated with the expression of miR‐150 (correlation coefficient, ‐0.40). MiR‐150 and ZEB1 data were normalized to RNU6B and GAPDH.
ZEB1 and EMT‐related genes were regulated by miR‐150
It was previously reported that the ESCC cell line TE‐8 expressed vimentin and repressed E‐cadherin, as observed in EMT‐induced cells.20 In this study, we selected TE‐8 cells to determine whether miR‐150 regulated ZEB1 and its downstream EMT‐related genes (e.g., mesenchymal marker vimentin, and epithelial marker E‐cadherin). The cell lysates of miR‐150‐transfected cells were analyzed by Western blotting. The expression levels of ZEB1 and vimentin were down‐regulated, and those of E‐cadherin were up‐regulated in premiR‐150 treated cells in comparison with the premiR‐nc treated cells (Fig. 2C). We also found an inverse correlation between miR‐150 and ZEB1 expression in clinical cases of ESCC (n = 108). Cases that were in the high expression group of ZEB1 (by real‐time RT‐PCR) were associated with low levels of miR‐150 expression (P < 0.001; correlation coefficient, −0.40) (Fig. 2D).
MiR‐150 regulates morphology, migration ability, and proliferation potency in TE‐8 cells
TE‐8 cells have an EMT‐like phenotype, including a spindle‐shaped morphology, suppression of E‐cadherin, and expression of vimentin. To determine whether miR‐150 could regulate cell morphology and migration ability in TE‐8 cells, we performed wound healing assay and immunocytochemical staining of E‐cadherin and vimentin in TE‐8 cells treated with premiR‐nc or premiR‐150. The cellular morphology of premiR‐150‐treated cells changed to an epithelial phenotype, and the immunocytochemical staining of E‐cadherin and vimentin in those cells supported the results from the Western blotting analysis (Fig. 3A). Next, we assessed the role of miR‐150 on cell migration ability. The wound healing assay revealed suppressed migration ability in premiR‐150‐treated cells in comparison with premiR‐nc‐treated cells (Fig. 3B). From the above results in Figures 3, miR‐150 appeared to induce MET‐like changes in TE‐8 cells by targeting the EMT‐inducers ZEB1. Moreover, evaluation of proliferation potency in premiR‐150‐transfected cells showed that proliferation rates were significantly reduced in premiR‐150‐treated cells in comparison with premiR‐nc‐treated cells (P < 0.05) (Fig. 3C).
Figure 3.

MiR‐150 induces MET‐like changes in the E‐cadherin‐suppressed ESCC cell line TE‐8. (A) Immunocytochemical staining indicated E‐cadherin and vimentin expression in premiR‐150‐treated TE‐8 cells compared to the premiR‐nc‐treated cells. (B) Left panel: representative images of wound healing assays of premiR‐150‐treated TE‐8 cells. TE‐8 cells transfected with premiR‐nc or premiR‐150 were wounded (time zero) and maintained for 24 h in RPMI1640 with 10% FBS. Right panel: this figure shows the ratio of wound closure in TE‐8 cells transfected with premiR‐nc or premiR‐150. The error bars represents the SD from eight replicates. (C) Proliferation assay: the proliferation rate of premiR‐150‐treated cells was suppressed in comparison with that of premiR‐nc‐treated cells. The data represent the means ± SD (*P < 0.05).
MiR‐150 suppressed tumor growth and tumorigenicity in a mouse xenograft model
We investigated whether miR‐150 could function as a tumor suppressor (as it does in other malignancies) using a mouse xenograft model. PremiR‐150‐transfected TE‐8 cells produced tumors with significantly reduced volumes 30 days after injection compared to tumors initiated by cells treated with premiR‐nc (P < 0.05) (Fig. Fig. 4 A,B). Moreover, we found that the in vivo tumorigenic potential of premiR‐150 transfectants was inhibited: only one in three mice developed tumors (1 × 10⁴ cells injected, 33%) compared with three of three mice (1 × 10⁴; 100%) treated with premiR‐nc cells (Fig. 4C). To clarify premiR‐150 transfection activity, we examined miR‐150 expression in xenograft tumors 7 and 30 days after injection. The results showed that miR‐150 expression was upregulated in the xenograft tumors after 7 days (Fig. 4D), but not after 30 days (data not shown). Moreover, the cell density of the premiR‐150‐treated tumors was significantly reduced compared with the control tumor after 7 days and 30 days. Immunostaining of proteins downstream from miR‐150 (ZEB1 and E‐cadherin) showed MET‐like changes in premiR‐150‐treated tumors 7 days after injection. Thus, the antitumor effect was apparent after 1 week.
Figure 4.
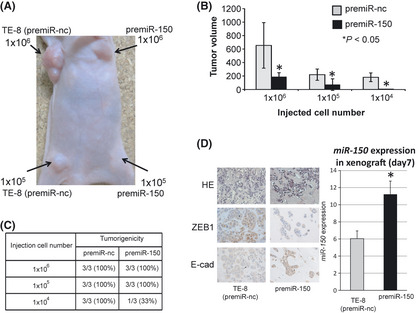
MiR‐150 suppressed tumorigenicity and tumor volume in a mouse xenograft model. (A) TE‐8 cells (1 × 10⁴, 1 × 10⁵, or 1 × 10⁶), transfected with premiR‐nc or premiR‐150, were subcutaneously injected into female BALB/c nude mice (n = 3). Representative image was taken at day 30. Left side: tumors from premiR‐nc‐treated cells. Right side: tumors from premiR‐150‐treated cells. (B) Comparison of tumor volumes 30 days after subcutaneous injection of TE‐8 cells transfected with premiR‐nc or premiR‐150. The error bars represents the means ± SD (*P < 0.05). (C) Incidence of tumors (tumorigenicity) is shown for 1 × 10⁴, 1 × 10⁵, and 1 × 10⁶ TE‐8 cells transfected with premiR‐nc or premiR‐150. (D) Left panel: representative immunohistochemical staining of ZEB1 and E‐cadherin in xenograft tumors transfected with premiR‐nc or premiR‐150 (original magnification 200 × ). Right panel: miR‐150 expression in xenograft tumors transfected with premiR‐nc or premiR‐150 7 days after injection (*P < 0.05).
Discussion
In this study, we found that the expression level of miR‐150 in T was lower than in N, consistent with data from the previous microarray expression analysis.7 We also showed that miR‐150 may function as an inducer of MET‐like changes in vitro and as an inhibitor of tumorigenicity in vivo by targeting the EMT‐inducers ZEB1.
EMT has important roles in cancer invasion, metastasis and cancer stem cell properties.16, 17 EMT‐inducer ZEB1 was identified as a new miR‐150 target in this study. ZEB1 were previously reported to be associated with cancer progression,22 and are likely necessary for EMT. Note that TGF‐beta‐induced EMT is inhibited in squamous cells by suppression of ZEB1 via blocking of cellular senescence programs.23 On the other hand, it was reported that cancer stem cell properties (including tumorigenicity in colon and pancreatic cancers) are promoted by suppression of the stemness‐inhibiting miR‐200 family by a ZEB/miR‐200 feedback loop.24 In this study, we demonstrated that ZEB1 ‐targeting by miR‐150 could suppress E‐cadherin expression, migration ability, and tumorigenicity in ESCC cells. In ESCC, ZEB1 may control not only EMT via TGF‐beta signals but also cancer stem cells via the miR‐200 family.
In this study, miR‐150 was able to induce MET‐like changes and to suppress tumorigenicity in TE‐8 cells. While the EMT has been shown to promote cancer migration and intravasation from primary cancer in metastatic cascade in many cancers, the meaning of the MET in metastasis is still controversial.16 Recently, induction of the MET at the metastatic site was reported to facilitate metastatic colonization in mouse models.25 The MET induced by miR‐200 was shown to promote the development of metastasis by controlling E‐cadherin and Sec23a expression, thereby mediating the secretion of metastasis‐suppressive proteins.25, 26 MiR‐150 controls the EMT‐MET by controlling ZEB1/miR‐200 loop; however, miR‐150 itself has many targets that are known to be involved in cancer progression, including Myb, Notch, and CXCR4, and therefore is unlikely to target Sec23a, as suggested by in silico analyses.14, 27, 28 Indeed, premiR‐150 transfection in ESCC cell lines suppressed tumorigenic progression in vivo (Fig. 4), and use of an miR‐150 inhibitor suppressed E‐cadherin expression and promoted proliferation and migration in a separate ESCC cell line, TE‐15 (Fig. S2). Therefore, these data suggest that induction of miR‐150 in ESCC cells acts via regulation of miR‐200 as well as other targets. Future studies are needed in order to clarify the connection between miR‐150 and the metastatic cascade.
Previous studies have demonstrated that siRNA administered systemically to humans could inhibit specific genes via an RNA interference mechanism.29 Small RNAs, including miRs, have attracted attention as potential new tools for cancer therapeutic strategies.30, 31 Some groups have reported the potential of targeting specific miRs in cancer therapy.32, 33 Currently, the regulation of ZEB1 by miR‐150 in the human circulatory system is not well understood. In the future, miR150 administration to patients with ESCC may provide a promising new therapeutic strategy for suppressing cancer metastasis and reducing cancer recurrence via ZEB1‐mediated MET induction in ESCC cells.
In conclusion, our data indicate that downregulated‐miR‐150 is associated with poor prognosis and cancer progression in ESCC. EMT‐inducer ZEB1 is regulated by miR‐150, which may function as a regulator of EMT and MET in ESCC. The regulation by miR‐150 could provide new insights into preventing metastasis and also provide a promising novel candidate for targeted therapeutic strategies in ESCC.
Disclosure Statement
All authors have no conflict of interest.
Abbreviations
- miR
microRNA
- ESCC
esophageal squamous cell carcinoma
- T
Tumor tissue
- N
Normal tissue
- EMT
epithelial‐mesenchymal transition
- MET
mesenchymal‐epithelial transition
Supporting information
Fig. S1. Re‐analysis of microarray database GSE6188.
Fig. S2. Proliferation and migration were upregulated in TE‐15 cells treated with an miR‐150 inhibitor.
Acknowledgments
We thank Ms Yukie Saito, Ms Masako Shin, Ms Tomoko Yano, Ms Midori Ohno, Ms Sayaka Muraoka, Ms Yuka Matsui, and Ms Ayaka Ishida for their excellent assistance. This work was supported in part by the following grants and foundations: Grants‐in‐Aid for Scientific Research from the Japan Society for the Promotion of Science (JSPS); grant numbers 21591690, 22591450, 23591857 and 30546726.
(Cancer Sci, doi: 10.1111/cas.12030, 2012)
References
- 1. Malthaner RA, Wong RK, Rumble RB, Zuraw L. Neoadjuvant or adjuvant therapy for resectable esophageal cancer: a systematic review and meta‐analysis. BMC Med 2004; 2: 35. [DOI] [PMC free article] [PubMed] [Google Scholar]
- 2. Gebski V, Burmeister B, Smithers BM, Foo K, Zalcberg J, Simes J. Survival benefits from neoadjuvant chemoradiotherapy or chemotherapy in oesophageal carcinoma: a meta‐analysis. Lancet Oncol 2007; 8: 226–34. [DOI] [PubMed] [Google Scholar]
- 3. Tepper J, Krasna MJ, Niedzwiecki D et al Phase III trial of trimodality therapy with cisplatin, fluorouracil, radiotherapy, and surgery compared with surgery alone for esophageal cancer: CALGB 9781. J Clin Oncol 2008; 26: 1086–92. [DOI] [PMC free article] [PubMed] [Google Scholar]
- 4. Enzinger PC, Mayer RJ. Esophageal cancer. N Engl J Med 2003; 349: 2241–52. [DOI] [PubMed] [Google Scholar]
- 5. Parkin DM, Bray F, Ferlay J, Pisani P. Global cancer statistics, 2002. CA Cancer J Clin 2005; 55: 74–108. [DOI] [PubMed] [Google Scholar]
- 6. Valencia‐Sanchez MA, Liu J, Hannon GJ, Parker R. Control of translation and mRNA degradation by miRNAs and siRNAs. Genes Dev 2006; 20: 515–24. [DOI] [PubMed] [Google Scholar]
- 7. Guo Y, Chen Z, Zhang L et al Distinctive microRNA profiles relating to patient survival in esophageal squamous cell carcinoma. Cancer Res 2008; 68: 26–33. [DOI] [PubMed] [Google Scholar]
- 8. Kong KL, Kwong DL, Chan TH et al microRNA‐375 inhibits tumour growth and metastasis in oesophageal squamous cell carcinoma through repressing insulin‐like growth factor 1 receptor. Gut 2012; 61: 33–42. [DOI] [PubMed] [Google Scholar]
- 9. Watanabe A, Tagawa H, Yamashita J et al The role of microRNA‐150 as a tumor suppressor in malignant lymphoma. Leukemia 2011; 25: 1324–34. [DOI] [PubMed] [Google Scholar]
- 10. Agirre X, Jimenez‐Velasco A, San Jose‐Eneriz E et al Down‐regulation of hsa‐miR‐10a in chronic myeloid leukemia CD34+ cells increases USF2‐mediated cell growth. Mol Cancer Res 2008; 6: 1830–40. [DOI] [PubMed] [Google Scholar]
- 11. Zhao JJ, Lin J, Lwin T et al microRNA expression profile and identification of miR‐29 as a prognostic marker and pathogenetic factor by targeting CDK6 in mantle cell lymphoma. Blood 2010; 115: 2630–9. [DOI] [PMC free article] [PubMed] [Google Scholar]
- 12. Amaral FC, Torres N, Saggioro F et al microRNAs differentially expressed in ACTH‐secreting pituitary tumors. J Clin Endocrinol Metab 2009; 94: 320–3. [DOI] [PubMed] [Google Scholar]
- 13. Lulla RR, Costa FF, Bischof JM et al Identification of Differentially Expressed microRNAs in Osteosarcoma. Sarcoma 2011; 2011: 732690. [DOI] [PMC free article] [PubMed] [Google Scholar]
- 14. Xiao C, Calado DP, Galler G et al MiR‐150 controls B cell differentiation by targeting the transcription factor c‐Myb. Cell 2007; 131: 146–59. [DOI] [PubMed] [Google Scholar]
- 15. Ramsay RG, Gonda TJ. MYB function in normal and cancer cells. Nat Rev Cancer 2008; 8: 523–34. [DOI] [PubMed] [Google Scholar]
- 16. Polyak K, Weinberg RA. Transitions between epithelial and mesenchymal states: acquisition of malignant and stem cell traits. Nat Rev Cancer 2009; 9: 265–73. [DOI] [PubMed] [Google Scholar]
- 17. Mani SA, Guo W, Liao MJ et al The epithelial‐mesenchymal transition generates cells with properties of stem cells. Cell 2008; 133: 704–15. [DOI] [PMC free article] [PubMed] [Google Scholar]
- 18. Brabletz S, Brabletz T. The ZEB/miR‐200 feedback loop–a motor of cellular plasticity in development and cancer? EMBO Rep 2010; 11: 670–7. [DOI] [PMC free article] [PubMed] [Google Scholar]
- 19. Korpal M, Kang Y. The emerging role of miR‐200 family of microRNAs in epithelial‐mesenchymal transition and cancer metastasis. RNA Biol 2008; 5: 115–9. [DOI] [PMC free article] [PubMed] [Google Scholar]
- 20. Usami Y, Satake S, Nakayama F et al Snail‐associated epithelial‐mesenchymal transition promotes oesophageal squamous cell carcinoma motility and progression. J Pathol 2008; 215: 330–9. [DOI] [PubMed] [Google Scholar]
- 21. Suzuki S, Miyazaki T, Tanaka N et al Prognostic significance of CD151 expression in esophageal squamous cell carcinoma with aggressive cell proliferation and invasiveness. Ann Surg Oncol 2011; 18: 888–93. [DOI] [PubMed] [Google Scholar]
- 22. Chen ML, Liang LS, Wang XK. miR‐200c inhibits invasion and migration in human colon cancer cells SW480/620 by targeting ZEB1. Clin Exp Metastasis 2012; 29: 457–69. [DOI] [PubMed] [Google Scholar]
- 23. Ohashi S, Natsuizaka M, Wong GS et al Epidermal growth factor receptor and mutant p53 expand an esophageal cellular subpopulation capable of epithelial‐to‐mesenchymal transition through ZEB transcription factors. Cancer Res 2010; 70: 4174–84. [DOI] [PMC free article] [PubMed] [Google Scholar]
- 24. Wellner U, Schubert J, Burk UC et al The EMT‐activator ZEB1 promotes tumorigenicity by repressing stemness‐inhibiting microRNAs. Nat Cell Biol 2009; 11: 1487–95. [DOI] [PubMed] [Google Scholar]
- 25. Korpal M, Ell BJ, Buffa FM et al Direct targeting of Sec23a by miR‐200s influences cancer cell secretome and promotes metastatic colonization. Nat Med 2011; 17: 1101–8. [DOI] [PMC free article] [PubMed] [Google Scholar]
- 26. Thompson EW, Haviv I. The social aspects of EMT‐MET plasticity. Nat Med 2011; 17: 1048–9. [DOI] [PubMed] [Google Scholar]
- 27. Ghisi M, Corradin A, Basso K et al Modulation of microRNA expression in human T‐cell development: targeting of NOTCH3 by miR‐150. Blood 2011; 117: 7053–62. [DOI] [PubMed] [Google Scholar]
- 28. Tano N, Kim HW, Ashraf M. microRNA‐150 regulates mobilization and migration of bone marrow‐derived mononuclear cells by targeting Cxcr4. PLoS ONE 2011; 6: e23114. [DOI] [PMC free article] [PubMed] [Google Scholar]
- 29. Davis ME, Zuckerman JE, Choi CH et al Evidence of RNAi in humans from systemically administered siRNA via targeted nanoparticles. Nature 2010; 464: 1067–70. [DOI] [PMC free article] [PubMed] [Google Scholar]
- 30. Soifer HS, Rossi JJ, Saetrom P. microRNAs in disease and potential therapeutic applications. Mol Ther 2007; 15: 2070–9. [DOI] [PubMed] [Google Scholar]
- 31. Pecot CV, Calin GA, Coleman RL, Lopez‐Berestein G, Sood AK. RNA interference in the clinic: challenges and future directions. Nat Rev Cancer 2011; 11: 59–67. [DOI] [PMC free article] [PubMed] [Google Scholar]
- 32. Elmen J, Lindow M, Schutz S et al LNA‐mediated microRNA silencing in non‐human primates. Nature 2008; 452: 896–9. [DOI] [PubMed] [Google Scholar]
- 33. Silvestri P, Di Russo C, Rigattieri S et al microRNAs and ischemic heart disease: towards a better comprehension of pathogenesis, new diagnostic tools and new therapeutic targets. Recent Pat Cardiovasc Drug Discov 2009; 4: 109–18. [DOI] [PubMed] [Google Scholar]
Associated Data
This section collects any data citations, data availability statements, or supplementary materials included in this article.
Supplementary Materials
Fig. S1. Re‐analysis of microarray database GSE6188.
Fig. S2. Proliferation and migration were upregulated in TE‐15 cells treated with an miR‐150 inhibitor.