

Abstract
Recently, many studies have suggested that microRNAs (miRNAs) are involved in cancer cell development, invasion, and metastasis of various types of human cancers. In a previous study, miRNA expression signatures from renal cell carcinoma (RCC) revealed that expression of microRNA‐135a (miR‐135a) was significantly reduced in cancerous tissues. The aim of this study was to investigate the functional significance of miR‐135a and to identify miR‐135a‐mediated molecular pathways in RCC cells. Restoration of mature miR‐135a significantly inhibited cancer cell proliferation and induced G0/G1 arrest in the RCC cell lines caki2 and A498, suggesting that miR‐135a functioned as a potential tumor suppressor. We then examined miR‐135a‐mediated molecular pathways using genome‐wide gene expression analysis and in silico analysis. A total of 570 downregulated genes were identified in miR‐135a transfected RCC cell lines. To investigate the biological significance of potential miR‐135a‐mediated pathways, we classified putative miR‐135a‐regulated genes according to the Kyoto Encyclopedia of Genes and Genomics pathway database. From our in silico analysis, 25 pathways, including the cell cycle, pathways in cancer, DNA replication, and focal adhesion, were significantly regulated by miR‐135a in RCC cells. Moreover, based on the results of this analysis, we investigated whether miR‐135a targeted the c‐MYC gene in RCC. Gain‐of‐function and luciferase reporter assays showed that c‐MYC was directly regulated by miR‐135a in RCC cells. Furthermore, c‐MYC expression was significantly upregulated in RCC clinical specimens. Our data suggest that elucidation of tumor‐suppressive miR‐135a‐mediated molecular pathways could reveal potential therapeutic targets in RCC.
Renal cell carcinoma (RCC) is the most common neoplasm of the adult kidney, and approximately 80% of RCC patients are diagnosed with the clear cell RCC (ccRCC) subtype.1 In the USA, the incidence and mortality rates of RCC have increased in recent years, with approximately 58 000 new cases and 13 000 deaths in 2010.2 Although surgery is curative for localized disease, a significant percentage of patients developed relapses or metastases with poor prognosis.3, 4 Therefore, researchers have become interested in elucidating the molecular mechanisms of RCC oncogenesis and metastasis, which could lead to development of better prognostic, diagnostic, and therapeutic interventions for the disease.
RNA can be divided into two categories, protein‐coding RNAs and non‐coding RNAs (ncRNAs). It is important to examine the functions of ncRNAs in both normal and diseased tissues and to elucidate their involvement in human diseases, including cancer. MicroRNAs (miRNAs) are endogenous small ncRNA molecules (19–22 bases) that regulate protein‐coding gene expression by repressing translation of RNA or cleaving RNA transcripts in a sequence‐specific manner.5 A growing body of evidence suggests that miRNAs are aberrantly expressed in many human cancers and that they play significant roles in the initiation, development, and metastasis of these cancers.6 Some highly expressed miRNAs may function as oncogenes by repressing tumor suppressors, whereas miRNAs showing relatively low expression may function as tumor suppressors by negatively regulating oncogenes.7 In cancer‐related pathways, normal regulatory mechanisms can be disrupted by aberrant expression of tumor‐suppressive or oncogenic miRNAs.
Genome‐wide miRNA expression signatures can be used to rapidly and precisely determine aberrant miRNA expression in cancerous tissues and cells. Because of this, we carried out miRNA expression signature analyses and searched for tumor‐suppressive miRNAs in various types of cancers. Two microRNA signatures in RCC have been published; cancerous and non‐cancerous tissue could be clearly differentiated by their signatures.8, 9 Our previous studies successfully identified several tumor‐suppressive miRNAs and miRNA‐regulated molecular targets.10, 11, 12, 13, 14, 15, 16, 17, 18, 19, 20, 21, 22, 23, 24 In addition, more recently, we examined miRNA expression signatures in RCC using clinical specimens by using the latest platform containing 778 human miRNA spots, which revealed the downregulation of several miRNAs in these RCC specimens. At present, our functional studies have shown that three miRNAs have tumor‐suppressive functions, including miR‐1/miR‐133a, miR‐1285, and miR‐138, which target TAGLN2, TGM2, and VIM, respectively.16, 20, 24 These studies suggest that there may be additional tumor‐suppressive miRNA in this signature.
The aim of the current study was to identify new tumor‐suppressive miRNAs from our RCC expression signature. Our previous study showed that miR‐135a had the fourth strongest inhibitory effect on cell proliferation among the top 20 downregulated miRNAs.20 We have already examined other candidate miRNAs and focused on miR‐135a in this study. We sought to identify target genes regulated by tumor‐suppressive miR‐135a using genome‐wide gene expression analysis and in silico analysis. To determine the biological significance of miR‐135a‐mediated cancer pathways, we classified these genes according to the Kyoto Encyclopedia of Genes and Genomics (KEGG) pathway database. Among genes classified within the cell cycle pathway, we focused on c‐MYC as a potential miR‐135a target. Restoration of miR‐135a and luciferase reporter assays indicated that c‐MYC was directly regulated by miR‐135a in RCC cells. The c‐MYC oncogenes have been established as acting as a master genes in various types of cancers, regulating other cancer‐related genes.25, 26 Moreover, c‐MYC has also been reported to be upregulated in RCC clinical specimens.27, 28, 29, 30 Thus, our data suggest that the identification of tumor‐suppressive miR‐135a‐mediated cancer pathways may provide insights into potential therapeutic targets for the treatment of RCC.
Materials and Methods
Clinical specimens and cell culture
A total of 38 pairs of ccRCC specimens and adjacent non‐cancerous specimens were collected from patients who had undergone radical nephrectomies at Kagoshima University Hospital (Kagoshima, Japan) between 2006 and 2009 (see Table 1 for patient information). The samples were processed and stored in RNAlater (Qiagen, Valencia, CA, USA) at −20°C until RNA extraction or staged according to the American Joint Committee on Cancer/Union Internationale Contre le Cancer (UICC) TNM classification and histologically graded.31 Our study was approved by the Bioethics Committee of Kagoshima University; written prior informed consent and approval were given by all patients.
Table 1.
Characteristics of clear cell renal cell carcinoma specimens and adjacent non‐cancerous specimens from patients who had undergone radical nephrectomies
| n | |
|---|---|
| Total number | 38 |
| Median age (range) in years | 65 (36–87) |
| Gender | |
| Male | 27 |
| Female | 11 |
| Pathological tumor stage | |
| pT1a | 19 |
| pT1b | 11 |
| pT2 | 2 |
| pT3a | 3 |
| pT3b | 3 |
| pT4 | 0 |
| Grade | |
| G1 | 7 |
| G2 | 29 |
| G3 | 0 |
| Unknown | 2 |
| Infiltration | |
| α | 27 |
| β | 11 |
| γ | 0 |
| Venous invasion | |
| v (−) | 30 |
| v (+) | 8 |
In addition to clinical samples, two human RCC cell lines, caki‐2 and A498, obtained from the ATCC (Manassas, VA, USA), were used. Cells were grown in RPMI‐1640 medium (Invitrogen, Carlsbad, CA, USA) supplemented with 10% FBS and maintained in a humidified incubator (5% CO2) at 37°C.
RNA extraction
Total RNA, including miRNA, was extracted using the mirVana miRNA isolation kit (Ambion, Austin, TX, USA) following the manufacturer's protocol. The integrity of the RNA was checked with an RNA 6000 Nano Assay Kit and a 2100 Bioanalyzer (Agilent Technologies, Santa Clara, CA, USA).
Quantitative real‐time RT‐PCR
TaqMan probes and primers for c‐MYC (P/N: Hs00153406_m1) were Assay‐on‐Demand Gene Expression Products (Applied Biosystems, Foster City, CA, USA). All reactions were carried out in duplicate and a negative control lacking cDNA was included. The PCR conditions were chosen according to the manufacturer's protocol. Stem–loop RT‐PCR (TaqMan MicroRNA Assays; P/N: PM11126 for miR‐135a; Applied Biosystems) was used to quantify miRNAs according to previously described methods.13 To normalize the data for quantification of c‐MYC mRNA and miRNAs, we used human GUSB (P/N: Hs99999908_m1; Applied Biosystems) and RNU48 (P/N: 001006; Applied Biosystems), respectively, and the delta–delta Ct method was used to calculate the fold change. As control RNA, we used Premium Total RNA from normal human kidney (AM 7976; Applied Biosystems).
Mature miRNA and siRNA transfection
As described elsewhere,13 RCC cell lines were transfected with 10 nM mature miRNA molecules using Lipofectamine RNAiMAX transfection reagent (Invitrogen) and Opti‐MEM (Invitrogen). We first tested the transfection efficacy of miRNA precursors in RCC cell lines based on the downregulation of PTK9 mRNA by overexpression of miR‐1. This method was recommended by the manufacturer (Applied Biosystems). Pre‐miR (Applied Biosystems) and negative control miRNA (Applied Biosystems) were used in gain‐of‐function experiments; c‐MYC siRNA (SASI_ Hs01_00222676 and SASI_HS01_00222677; Sigma‐Aldrich, St. Louis, MO, USA) and negative control siRNA (MISSION siRNA Universal Negative Control; Sigma‐Aldrich) were used in loss‐of‐function experiments. Cells were seeded in 10‐cm dishes for protein extraction (8 × 10⁵ cells per dish); 24‐well plates for mRNA extraction, Matrigel invasion assays, and luciferase reporter assays (5 × 10⁴ cells per well); and in 96‐well plates for XTT assays (3 × 10³ cells per well).
Construction of miR‐135a expression vectors and transfection to A498
The miR‐135a vector was constructed by a inserting full‐length mature miR‐135a sequence into the BamHI and HindIII restriction site of the pBApo‐CMV Neo vector (Takara Bio, Otsu, Japan). The miR‐135a and the non‐targeting (control) vectors were transfected into A498 cells using a transfection reagent, FuGENE (Roche Applied Science, Tokyo, Japan) following the manufacturer's protocol. The A498/miR‐135a transfectant was split and grown in selective medium with 1000 mg/L G418. The G418‐resistant colonies were chosen and expanded in medium containing 200 mg/L G418. DNA sequences of all constructs were confirmed by DNA sequencing (Bio Matrix Research, Tokyo, Japan).
Cell proliferation and invasion assays
Cell proliferation was determined using XTT assays (Roche Applied Science), carried out according to the manufacturer's instructions. Cell invasion assays were carried out using modified Boyden chambers consisting of Transwell precoated Matrigel membrane filter inserts with 8‐mm pores in 24‐well tissue cultures plates (BD Biosciences, Bedford, MA, USA). Minimum essential medium containing 10% FBS in the lower chamber served as the chemoattractant, as described previously.32 All experiments were carried out in triplicate.
Cell cycle analysis
Caki2 and A498 cells were harvested 72 h after transfection with miR‐control or miR‐135a by trypsinization. For cell cycle analysis, cells were stained with propidium iodide using the Cycletest Plus DNA Reagent Kit (BD Biosciences) following the manufacturer's protocol, and cell cycle distribution was analyzed by FACScan (BD Biosciences). The percentages of cells in G0/G1, S, and G2/M phases were counted and compared. Experiments were carried out in triplicate.
Screening of miR‐135a‐regulated genes using microarray and database analysis
Oligo‐microarray Human 44K (Agilent) was used for expression profiling in miR‐135a‐transfected A498 cells, and gene expression was compared with miR‐negative control transfectants, as previously described.32 Hybridization and washing steps were carried out in accordance with the manufacturer's instructions. The arrays were scanned using a Packard GSI Lumonics ScanArray 4000 (PerkinElmer, Boston, MA, USA). The data obtained were analyzed with DNASIS array software (Hitachi Software Engineering, Tokyo, Japan), which converted the signal intensity for each spot into text format. The log2 ratios of the median subtracted background intensities were analyzed. Data from each microarray study were normalized using the global normalization function.
The predicted target genes and their miRNA binding site seed regions were investigated using TargetScan (release 6.2, http://www.targetscan.org/). The sequences of the predicted mature miRNAs were confirmed using miRBase (release 19.0, August 2012; http://www.mirbase.org/).
Pathway analysis
We carried out gene expression analyses using miR‐135a transfectants. To identify molecular targets and signaling pathways regulated by miR‐135a, downregulated genes were analyzed in KEGG pathway categories using the GeneCodis (http://genecodis.cnb.csic.es/) program.
Western blotting
Three days after transfection, protein lysates (80 μg) were separated by NuPAGE on 4–12% Bis‐Tris gels (Invitrogen) and transferred to PVDF membranes. Immunoblotting was carried out using diluted (1:500) monoclonal c‐MYC antibodies (catalog number, 5605; Cell Signaling Technology, Danvers, MA, USA) and GAPDH antibodies (MAB374; Chemicon, Temecula, CA, USA). The membrane was washed then incubated with HRP‐conjugated goat anti‐rabbit IgG (H+L) (Bio‐Rad, Hercules, CA, USA). Specific complexes were visualized with an ECL detection system (GE Healthcare, Little Chalfont, UK), and protein expression was evaluated by ImageJ software (version 1.43; http://rsbweb.nih.gov/ij/index.html).
Plasmid construction and dual‐luciferase reporter assays
MicroRNA target sequences were inserted between the XhoI and PmeI restriction sites in the 3′‐untranslated region (UTR) of the hRluc gene in the psiCHECK‐2 vector (C8021; Promega, Madison, WI, USA). Primer sequences for the full‐length 3′‐UTR of c‐MYC mRNA (5′‐GATCGCTCGAGGACTTGTTGCGGAAACGAC‐3′ and 5′‐GGCCGCTCTAGGTTTAAACAAGTTCTTTTATGCCCAAAGTCC‐3′) were designed. Transfections were carried out in caki2 cells using 15 ng vector, 10 nM miRNAs, and 1 μL Lipofectamine 2000 (Invitrogen) in 100 μL Opti‐MEM (Invitrogen). The activities of firefly and Renilla luciferases in cell lysates were determined using a dual‐luciferase assay system (E1910; Promega). Normalized data were calculated as the ratio of Renilla to firefly luciferase activities.
Statistical analysis
Relationships between two variables and the numerical values obtained by real‐time RT‐PCR were analyzed using Mann–Whitney U‐tests. Relationships between three variables and the numerical values obtained by real‐time RT‐PCR were analyzed using Bonferroni‐adjusted Mann–Whitney U‐tests. Expert StatView analysis software (version 4; SAS Institute, Cary, NC, USA) was used in both cases. In comparisons of three variables, a non‐adjusted statistical level of significance of P < 0.05 corresponded to a Bonferroni‐adjusted level of P < 0.0167.
Results
Expression of miR‐135a in RCC cell lines and clinical specimens
First, we evaluated miR‐135a expression in RCC cell lines (caki2 and A498) by real‐time PCR analysis. Expression of miR‐135a was significantly lower in caki2 and A498 cells than in non‐cancerous kidney tissues (Fig. 1a). We also evaluated miR‐135a expression in 38 ccRCC clinical specimens and matched adjacent non‐cancerous tissues (Table 1) and confirmed that miR‐135a was significantly downregulated in cancerous tissues (P < 0.001 by Mann–Whitney's U‐test; Fig. 1b,c). We further assessed whether miR‐135a expression status in RCC specimens correlated with clinicopathological features, such as pathological stage, grade, and metastatic status. However, there were no significant differences between miR‐135a expression and clinicopathological features in this study (data not shown).
Figure 1.

Expression of miR‐135a in RCC cell lines and RCC clinical specimens. (a) Expression of miR‐135a in RCC cell lines. MiR‐135a expression was significantly downregulated in RCC cell lines (caki2 and A498) as compared with normal kidney cells. **P < 0.0001. (b) Expression of miR‐135a in clinical RCC specimens. MiR‐135a expression levels are expressed as compared with adjacent non‐cancerous kidney tissues. RNU48 was used as the internal control. (c) Normalized relative expression of miR‐135a is shown in the bar chart. White and black bars indicate expression levels in normal and tumor tissues, respectively.
Effects of miR‐135a restoration on cell proliferation and invasion in RCC cells
To investigate the functional role of miR‐135a, we carried out gain‐of‐function studies using transient transfection with mature miR‐135a in RCC cell lines. The XTT assays showed that cell proliferation was significantly inhibited in both miR‐135a transfected cell lines (caki2 and A498) in comparison with the miR‐control cells (percent cell viability for caki2, 61.1% ± 1.0% and 100.0% ± 0.9%, respectively, P < 0.05; for A498, 51.3% ± 3.1% and 100.0%± 3.4%, respectively, P < 0.05; Fig. 2a). Moreover, the number of invasive cells decreased significantly after miR‐135a transfection (percent invasion for caki2, 45.8% ± 2.3% and 100.0% ± 8.5%, respectively, P < 0.05; for A498, 47.7% ± 4.2% and 100.0% ± 3.9%, respectively, P < 0.05; Fig. 2b). We also established a stable miR‐135a transfectant (A498) (Fig. S1a). Expression of c‐Myc mRNA was significantly repressed in the transfectant (Fig. S1b). We found that both cell proliferation and cell invasion were significantly inhibited in the transfectant (Fig. S1c,d).
Figure 2.

Effect of mature miR‐135a transfection in the RCC cell lines. (a) Cell proliferation was determined in caki2 and A498 cell lines using XTT assays 72 h after transfection with 10 nM miR‐135a or miR‐control. MiR‐135a transfection significantly inhibited cell proliferation as compared with miR‐control transfection. *P < 0.05. (b) Cell invasion activity was determined by Matrigel invasion assay 48 h after miR‐135a transfection. Relative to miR‐control transfection, the number of invasive cells decreased significantly after miR‐135a transfection. *P < 0.05. (c) Cell cycle analysis of miR‐135a and miR‐control transfectants. G0/G1 arrest was induced by miR‐135a transfection. **P < 0.0001 relative to the miR‐control.
MiR‐135a induced G0/G1 arrest in RCC cell lines
Because miR‐135a restoration significantly inhibited cell proliferation in RCC cell lines, we hypothesized that miR‐135a restoration may induce apoptosis and/or cell cycle arrest; therefore, we carried out flow cytometry analysis to measure cell cycle distributions in miR‐135a transfected cells versus miR‐control transfected cells. In this study, the apoptotic cell fraction (apoptosis plus early apoptotic cells) was not significantly between miR‐135a transfected cells and miR‐control cells (data not shown). However, in the cell cycle distribution analysis, the number of cells in the G2/M phase was significantly lower in both miR‐135a transfected cell lines, as compared to miR‐control transfected cells (P < 0.001; Fig. 2c). These results suggested that miR‐135a restoration induced G0/G1 arrest in RCC cells.
Identification of miR‐135a‐mediated cancer pathways by genome‐wide gene expression analysis
To identify miR‐135a‐mediated cancer pathways, we carried out genome‐wide gene expression analysis of miR‐135a transfected A498 cells. In miR‐135a transfectant, 570 genes were downregulated (log2 fold changes <−0.5) compared with miR‐control transfectants (Table S1). Entries from the microarray expression data were approved by the Gene Expression Omnibus (GEO), and were assigned GEO accession numbers as GSE37119.
To reveal the molecular pathways regulated by miR‐135a, we assigned the downregulated genes obtained by gene expression analysis of miR‐135a transfectants into 25 KEGG pathways (Table 2). Among these, the “cell cycle” pathway was chosen for further analysis because miR‐135a restoration induced G0/G1 arrest in RCC cell lines. Genes contained within the “cell cycle” signaling pathway are shown in Table 3. From these genes, we chose to focus on the c‐MYC gene, which had a putative miR‐135a binding site in its 3′‐UTR region.
Table 2.
Significantly enriched annotations regulated by microRNA‐135a in A498 renal cell carcinoma cells
| Number of genes | P‐value | Annotations |
|---|---|---|
| 14 | 3.96E‐14 | DNA replication |
| 15 | 1.80E‐07 | Cell cycle |
| 10 | 1.21E‐05 | Pancreatic cancer |
| 10 | 5.75E‐05 | Small‐cell lung cancer |
| 12 | 2.21E‐04 | RNA transport |
| 18 | 2.40E‐04 | Pathways in cancer |
| 13 | 6.76E‐04 | Focal adhesion |
| 6 | 1.29E‐03 | Bladder cancer |
| 7 | 3.74E‐03 | Chronic myeloid leukemia |
| 6 | 4.31E‐03 | Non‐small‐cell lung cancer |
| 6 | 5.28E‐03 | Acute myeloid leukemia |
| 4 | 6.08E‐03 | Mismatch repair |
| 6 | 6.12E‐03 | Colorectal cancer |
| 7 | 6.22E‐03 | Transforming growth factor‐β signaling pathway |
| 6 | 6.26E‐03 | Glioma |
| 7 | 6.26E‐03 | Prostate cancer |
| 6 | 6.47E‐03 | Shigellosis |
| 5 | 7.12E‐03 | Metabolic pathways |
| 5 | 7.13E‐03 | Valine, leucine, and isoleucine degradation |
| 6 | 7.17E‐03 | p53 signaling pathway |
| 6 | 7.33E‐03 | Epithelial cell signaling in Helicobacter pylori infection |
| 6 | 7.63E‐03 | Bacterial invasion of epithelial cells |
| 6 | 7.63E‐03 | Melanoma |
| 6 | 9.11E‐03 | Arrhythmogenic right ventricular cardiomyopathy |
| 4 | 9.63E‐03 | Citrate cycle (TCA cycle) |
Table 3.
Cell cycle affected by the putative targets of microRNA‐135a
| Gene ID | Gene symbol | Log2 ratio | Gene name | Target site |
|---|---|---|---|---|
| 4172 | MCM3 | −1.32 | Minichromosome maintenance complex component 3 | − |
| 898 | CCNE1 | −1.26 | Cyclin E1 | − |
| 4174 | MCM5 | −1.17 | Minichromosome maintenance complex component 5 | − |
| 4173 | MCM4 | −1.06 | Minichromosome maintenance complex component 4 | − |
| 4175 | MCM6 | −1.05 | Minichromosome maintenance complex component 6 | − |
| 1021 | CDK6 | −1.01 | Cyclin‐dependent kinase 6 | − |
| 1874 | E2F4 | −1.01 | E2F transcription factor 4, p107/p130‐binding | − |
| 4176 | MCM7 | −0.92 | Minichromosome maintenance complex component 7 | − |
| 4171 | MCM2 | −0.84 | Minichromosome maintenance complex component 2 | − |
| 5591 | PRKDC | −0.76 | Protein kinase, DNA‐activated, catalytic polypeptide | − |
| 4609 | MYC | −0.74 | v‐myc myelocytomatosis viral oncogene homolog (avian) | + |
| 1870 | E2F2 | −0.71 | E2F transcription factor 2 | − |
| 595 | CCND1 | −0.66 | Cyclin D1 | − |
| 1869 | E2F1 | −0.63 | E2F transcription factor 1 | − |
| 64682 | ANAPC1 | −0.52 | Anaphase promoting complex subunit 1 | − |
+, putative miR‐135a target sites in the 3' UTR; −, no target sites.
c‐MYC as a direct miR‐135a target in RCC cell lines
Next we evaluated the expression of c‐MYC in RCC cell lines (caki2 and A498) and found that c‐MYC expression was significantly higher in RCC cell lines and RCC clinical specimens than in non‐cancerous kidney tissues (Fig. 3a). Moreover, both c‐MYC mRNA and c‐MYC protein expression were markedly reduced in miR‐135a transfected cells compared with miR‐control transfected cells (Fig. 3b,c, Fig. S1b). To determine whether the 3′‐UTR of c‐MYC contained an actual target site for miR‐135a, we carried out a luciferase reporter assay using a vector encoding the full‐length 3′‐UTR of the c‐MYC gene. Our data showed that luminescence intensity was significantly reduced in miR‐135a transfectants compared to miR‐control transfectants (Fig. 3d).
Figure 3.

Direct regulation of MYC by miR‐135a in the RCC cell lines. (a) MYC mRNA expression in RCC cell lines (caki2 and A498) compared to normal kidney RNA. GUSB was used as an internal control. **P < 0.0001. (b) MYC mRNA expression in RCC cell lines (caki2 and A498) 24 h after transfection with 10 nM miR‐135a. GUSB was used as an internal control. *P < 0.05. (c) MYC protein expression in RCC cell lines (caki2 and A498) 72 h after transfection with 10 nM miR‐135a. GAPDH was used as a loading control. **P < 0.0001, *P < 0.05. (d) MiR‐135a binding site in the 3′UTR of MYC mRNA. Luciferase assays were performed using a vector encoding the full‐length 3′UTR of MYC mRNA. Renilla luciferase values were normalized to firefly luciferase values. *P < 0.05.
Effects of si‐c‐MYC transfection on RCC cells
To examine significance of c‐MYC activity in cell variability of RCC, we carried out loss‐of‐function studies in A498 cells transfected with two different si‐c‐MYC sequences. Both c‐MYC mRNA and c‐MYC protein expression were markedly repressed by these si‐c‐MYC transfections (Fig. 4a,b).
Figure 4.
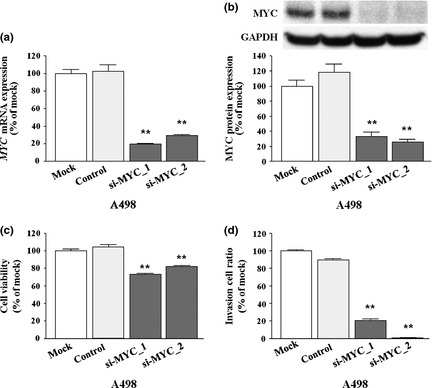
Effect of MYC silencing by si‐MYC in A498 cell line. (a) MYC mRNA expression 24 h after transfection with 10 nM si‐MYC in A498 RCC cells. GUSB was used as an internal control. **P < 0.0001. (b) MYC protein expression 72 h after transfection with si‐MYC. GAPDH was used as a loading control. **P < 0.0001. (c) Cell proliferation was determined by XTT assays in A498 cells 72 h after transfection with 10 nM si‐MYC or si‐control. Cell proliferation was significantly inhibited in si‐MYC‐transfected cells in comparison with mock or si‐control‐transfected cells. **P < 0.0001. (d) Cell invasion was measured by Matrigel invasion assay 48 h after transfection of si‐MYC. Cell numbers significantly decreased after si‐MYC transfection. **P < 0.0001 versus mock‐ and si‐control‐transfected cells.
The XTT assays revealed significant inhibition of cell proliferation in si‐c‐MYC transfectants compared with untransfected cells (mock) and si‐control transfectants (percent cell viability for A498, 73.3 ± 0.9%, 81.8 ± 1.6%, 100.0 ± 2.0%, and 104.6 ± 2.1%, respectively, P < 0.0001; Fig. 4c).
In addition, Matrigel invasion assays showed a significant decrease in the number of invading cells in the two si‐c‐MYC transfectants compared with their control counterparts (percent invasion for A498, 20.4 ± 2.1%, 0.9 ± 0.1%, 100.0 ± 1.1%, and 89.4 ± 1.8%, respectively, P < 0.0001; Fig. 4d).
Expression of c‐MYC in RCC clinical specimens
Gene expression signature of miR‐135a transfected A498 cells was analyzed by oligo‐microarray. A total of 507 genes were significantly downregulated in miR‐135a transfectants. These genes were analyzed and characterized in KEGG pathway categories using the GeneCodis program. Twenty‐five signaling pathways were identified in this analysis, and we selected 15 genes from the “cell cycle” pathway for further analysis. To confirm whether miR‐135a regulates molecular pathways in RCC, we investigated the expression of 15 cell cycle pathway genes in 53 RCC specimens and 23 adjacent non‐cancerous kidney specimens using available datasets (GSE36895 and GSE22541); the results of this analysis are shown in a heatmap diagram (Fig. 5a), which shows that c‐MYC mRNA expression was upregulated in RCC specimens compared to normal tissues. In addition, the c‐MYC target gene cyclin D1 (CCND1) was also upregulated in this analysis (Fig. 5a). Overexpression of both c‐MYC and CCND1 was validated in our RCC clinical specimens (Fig. 5b,c). There were no significant inverse correlations between c‐MYC/CCND1 mRNA expression and miR‐135a expression in our clinical samples.
Figure 5.

MYC and CCND1 mRNA expressions in RCC specimens and normal kidney tissues. (a) Heat map diagram of 15 genes related to “Cell cycle” pathway based on GEO data sets (53 RCC specimens and 23 adjacent non‐cancerous kidney specimens); the results demonstrate that MYC was upregulated in RCC clinical specimens. (b,c) Expression of MYC and CCND1mRNA in clinical RCC specimens. Relative MYC and CCND1mRNA expression levels are shown in box plots.
Discussion
Accumulating evidence has suggested that aberrant expression of miRNAs contributes to the initiation, development, and metastasis of human cancer.6 Moreover, aberrant expression of miRNAs in human cancer cells causes destruction of miRNA‐mediated mRNA networks. Therefore, identification of miRNA‐mediated molecular pathways is important for the next generation of human cancer research. Based on this assertion, we constructed RCC miRNA expression signatures and identified tumor‐suppressive miRNA‐mediated novel cancer pathways.20 To further investigate this concept, in the current study, we identified specific tumor‐suppressive miRNAs in these RCC signatures.
Although our previous results from RCC signatures revealed that miR‐135a was significantly downregulated in cancerous tissues,20 no reports have described a tumor‐suppressive function for miR‐135a in RCC. Thus, the current study is the first to report that miR‐135a is frequently downregulated in RCC clinical specimens and that it can function as a tumor suppressor. In the human genome, miR‐135a mapped on two different chromosomes (miR‐135a‐1 at 3p21.1 and miR‐135a‐2 at 12q23.1), and the mature miRNA sequences resulting from these two loci are identical. Although it is believed that genomic deletion or epigenetic silencing of miRNA can cause repression of several oncogenic genes in cancer cells, the mechanisms that regulate miR‐135a expression differ according to cancer and cell type. Moreover, little is known about the epigenetic control of miRNA expression in RCC cells. These important issues will need to be elucidated in later studies.
Recently, another research group reported that miR‐135a functions as a tumor suppressor in malignant glioma.33 According to this report, miR‐135a is frequently downregulated in malignant glioma, with its expression negatively correlated to pathological grading, and can induce mitochondria‐dependent apoptosis targeting STAT6, SMAD5, and BMPR2. These results are consistent with our current data. However, miR‐135a has also been shown to function as an oncogene in colorectal cancer, targeting the tumor suppressor APC.34 In this report, the expression of miR‐135a in primary tumors was significantly correlated with the presence of metastatic disease, suggesting that miR‐135a may be a potential prognostic biomarker in colorectal cancer. At present, it is difficult to explain these contradictory effects of aberrant miR‐135a expression in different cancer types.
MicroRNAs are unique in their ability to regulate many protein‐coding genes. One miRNA is capable of targeting a number of genes, globally regulating a myriad of biological processes. Bioinformatic predictions suggest that miRNAs regulate more than 30% of protein‐coding genes. The elucidation of new molecular pathways regulated by tumor‐suppressive miR‐135a is therefore important for our understanding of human RCC oncogenesis. Based on this view, we also carried out molecular target searches for miR‐135a in RCC cells using a combination of genome‐wide gene expression analysis and in silico analysis. According to GeneCodis software analysis and gene expression analysis in miR‐135a transfectants, miR‐135a regulates several pathways, including DNA replication, the cell cycle, cancer‐related pathways, and focal adhesion.
Recently, several investigators have reported that c‐MYC was directory repressed by tumor suppressive miRNAs, such as the let‐7 family, miR‐22, miR‐34a, miR‐145, miR‐185‐3p, and miR‐429 in several human malignancies.28, 35, 36, 37, 38, 39, 40 In terms of RCC, there were two reports indicating that let‐7a and miR‐34a functioned as tumor suppressors through directly binding to c‐MYC mRNA.28, 37 We hypothesized that tumor‐suppressive miRNAs regulate several oncogenic genes in normal cells, but reduced expression of tumor‐suppressive miRNAs causes aberrant expression of oncogenes in cancer cells. Thus, we chose to focus on the c‐MYC gene, which contains a putative miR‐135a target site in the 3′‐UTR and was categorized under the pathways in cancer and cell cycle pathways classifications.
The c‐MYC protein encodes a basic helix–loop–helix leucine zipper transcription factor that acts as an important regulator of several cellular processes, including protein synthesis, cell growth, and proliferation, in various cell types.34, 41, 42 Moreover, the c‐MYC oncogene is overexpressed in many types of human cancers25, 26 and contributes to cancer cell cycle progression, cell growth, inhibition of apoptosis, and angiogenesis.43, 44, 45 Several reports have shown that the c‐MYC pathway is activated in RCC due to the overexpression and amplification of the c‐MYC gene.27, 30 For example, CCND1, which is considered a proto‐oncogene, promotes the G1/S phase transition in the progression of the cell cycle by regulating cyclin‐dependent kinase activity.46, 47 In the current study, our expression profile analysis identified CCND1 as an miR‐135a regulated gene involved in cancer‐related and cell cycle pathways, supporting previous studies. The mRNA expression signatures of RCC clinical specimens derived from GEO databases also showed overexpression of CCND1. These data suggest that downregulation of tumor‐suppressive miR‐135a caused overexpression of c‐MYC and CCND1 genes in RCC clinical specimens. Furthermore, many reports have indicated that inactivation of c‐MYC and CCND1 can cause cell cycle arrest, differentiation, and apoptosis, thus inducing cancer regression in many types of cancers.48, 49 In this context, our results suggested that cancer pathways mediated by tumor‐suppressive miR‐135a, including pathways involving c‐MYC and cyclin D1, play crucial roles in RCC oncogenesis.
We found no significant inverse correlation between c‐MYC/CCND1 mRNA expression and miR‐135a expression, nor between miR‐135a expression and clinicopathological features in our clinical samples. The epigenetic regulation of c‐MYC/CCND1 expression by miR‐135a might not be so dominant compared to other regulatory mechanisms of these genes’ expression in human RCC. In addition, our cohort was too small (n = 38) to evaluate the precise relationship with clinicopathological parameters because the cohort included only eight samples of advanced cancer (≥pT2 or venous invasion) and no samples with grade 3. Studies on a large number of samples with a balanced pathological background will have to be carried out to elucidate the precise correlation between them.
In conclusion, miR‐135a was significantly downregulated in RCC clinical specimens and appeared to function as a tumor suppressor in RCC through regulation of c‐MYC expression and cell cycle progression. Identification of such tumor‐suppressive, miRNA‐mediated cancer pathways in human RCC could provide new information on potential therapeutic targets in the treatment of RCC.
Disclosure Statement
The authors declare no conflicts of interest.
Supporting information
Fig. S1. Cell viabilities altered in the miR‐135a stable transfectant.
Table S1. Down‐regulated genes in miR‐135a transfectants.
Acknowledgments
This study was supported by Grants‐in‐Aid for Science Research (B and C) (Grant Nos. 23501298 and 23592340) from the Ministry of Education, Sciences, Sports and Culture of Japan. We thank Ms. Mutsumi Miyazaki for her excellent laboratory assistance.
(Cancer Sci, doi: 10.1111/cas.12072, 2012)
References
- 1. Weng L, Wu X, Gao H et al MicorRNA profiling of clear cell renal carcinoma by whole‐genome small RNA deep sequencing of paired frozen and formalin‐fixed, paraffin‐embedded tissue specimens. J Pathol 2010; 222: 41–51. [DOI] [PubMed] [Google Scholar]
- 2. Cairns P. Renal cell carcinoma. Cancer Biomark 2010; 9: 461–73. [DOI] [PMC free article] [PubMed] [Google Scholar]
- 3. Fridman E, Dotan Z, Barshack I et al Accurate molecular classification of renal tumors using microRNA expression. J Mol Diagn 2010; 12: 687–96. [DOI] [PMC free article] [PubMed] [Google Scholar]
- 4. Aben KK, Luth TK, Jassen‐Heijinen ML, Mulders PF, Kiemeney LA, van Spronsen DJ. No improvement in renal cell carcinoma survival: a population‐based study in The Netherlands. Eur J Cancer 2008; 44: 1701–9. [DOI] [PubMed] [Google Scholar]
- 5. Filipowicz W, Bhattacharyya SN, Sonenberg N. Mechanism of post transcriptional regulation by microRNAs: are the answers in sight? Nat Rev Genet 2008; 9: 102–14. [DOI] [PubMed] [Google Scholar]
- 6. Nelson KM, Weiss GJ. MicroRNAs and caner: past, present, and potential future. Mol Cancer Ther 2008; 7: 3655–60. [DOI] [PubMed] [Google Scholar]
- 7. Esquela‐Kerscher A, Slack FJ. Oncomirs – microRNAs with a role in cancer. Nat Rev Cancer 2006; 6: 259–69. [DOI] [PubMed] [Google Scholar]
- 8. Nakada C, Matsuura K, Tsukamoto Y et al Genome‐wide microRNA expression profiling in renal cell carcinoma: significant down‐regulation of miR‐141 and miR‐200c. J Pathol 2008; 216: 418–27. [DOI] [PubMed] [Google Scholar]
- 9. Jung M, Mollenkopf HJ, Grimm C et al MicroRNA profiling of clear cell renal cell cancer identifies a robust signature to define renal malignancy. J Cell Mol Med 2009; 13: 3918–28. [DOI] [PMC free article] [PubMed] [Google Scholar]
- 10. Kano M, Seki N, Kikkawa N et al MiR‐145, miR‐133a and miR‐133b: tumor suppressive miRNAs target FSCN1 in esophageal squamous cell carcinoma. Int J Cancer 2010; 127: 2804–14. [DOI] [PubMed] [Google Scholar]
- 11. Kojima S, Chiyomaru T, Kawakami K et al Tumor suppressors miR‐1 and miR‐133a target the oncogenic function of purine nucleoside phosphorylase (PNP) in prostate cancer. Br J Cancer 2012; 106: 405–13. [DOI] [PMC free article] [PubMed] [Google Scholar]
- 12. Moriya Y, Nohata N, Kinoshita T et al Tumor suppressive microRNA‐133a regulates novel molecular networks in lung squamous carcinoma. J Hum Genet 2012; 57: 38–45. [DOI] [PubMed] [Google Scholar]
- 13. Nohata N, Hanazawa T, Kikkawa N et al Caveolin‐1 mediates tumor cell migration and invasion and its regulation by miR‐133a in head and neck squamous cell carcinoma. Int J Oncol 2011; 38: 209–17. [PubMed] [Google Scholar]
- 14. Nohata N, Hanazawa T, Kikkawa N et al Tumour suppressive microRNA‐874 regulates novel cancer networks in maxillary sinus squamous cell carcinoma. Br J Cancer 2011; 105: 833–41. [DOI] [PMC free article] [PubMed] [Google Scholar]
- 15. Nohata N, Hanazawa T, Kikkawa N et al Identification of novel molecular targets regulated by tumor suppressive miR‐1/miR‐133a in maxillary sinus squamous cell carcinoma. Int J Oncol 2011; 39: 1099–107. [DOI] [PubMed] [Google Scholar]
- 16. Yoshino H, Chiyomaru T, Enokida H et al The tumour‐suppressive function of miR‐1 and miR‐133a targeting TAGLN2 in bladder cancer. Br J Cancer 2011; 104: 808–18. [DOI] [PMC free article] [PubMed] [Google Scholar]
- 17. Chiyomaru T, Enokida H, Tatarano S et al miR‐145 and miR‐133a function as tumour suppressors and directly regulate FSCN1 expression in bladder cancer. Br J Cancer 2010; 102: 883–91. [DOI] [PMC free article] [PubMed] [Google Scholar]
- 18. Chiyomaru T, Enokida H, Kawakami K et al Function role of LASP1 in cell viability and its regulation by microRNAs in bladder cancer. Urol Oncol 2010; 30: 434–43. [DOI] [PubMed] [Google Scholar]
- 19. Tatarano S, Chiyomaru T, Kawakami K et al miR‐218 on the genomic loss region of chromosome 4p15.31 function as a tumor suppressor in bladder cancer. Int J Oncol 2011; 39: 13–21. [DOI] [PubMed] [Google Scholar]
- 20. Hidaka H, Seki N, Yamasaki T et al Tumor suppressive microRNA‐1285 regulates novel molecular targets: aberrant expression and functional significance in renal cell carcinoma. Oncotarget 2012; 3: 44–57. [DOI] [PMC free article] [PubMed] [Google Scholar]
- 21. Kawakami K, Enokida H, Chiyomaru T et al The functional siginicance of MiR‐1 and miR‐133a in renal cell carcinoma. Eur J Cancer 2012; 48: 827–36. [DOI] [PubMed] [Google Scholar]
- 22. Yoshino H, Enokida H, Chiyomaru T et al Tumor suppressive microRNA‐1 mediated novel apoptosis pathways through direct inhibition of splicing factor serine/arginine‐rich 9 (SRSF9/SRp30c) in bladder cancer. Biochem Biophys Res Commun 2012; 417: 588–93. [DOI] [PubMed] [Google Scholar]
- 23. Yamasaki T, Yoshino H, Hidaka H et al Novel molecular targets regulated by tumor sppressors microRNA‐1 and microRNA‐133a in bladder bladder cancer. Int J Oncol 2012; 40: 1821–30. [DOI] [PubMed] [Google Scholar]
- 24. Yamasaki T, Seki N, Yoshino H et al Tumor suppressive microRNA contributes to cell migration and invasion through its targeting of vimentin in renal cell carcinoma. Int J Oncol 2012; 41: 805–17. [DOI] [PMC free article] [PubMed] [Google Scholar]
- 25. Nesbit CE, Tersak JM, Prochownik EV. MYC oncogenes and human neoplastic disease. Oncogene 1999; 18: 3004–16. [DOI] [PubMed] [Google Scholar]
- 26. Pelenganis S, Khan M, Evan G. c‐MYC: more than just a matter of life and death. Nat Rev Cancer 2002; 2: 764–76. [DOI] [PubMed] [Google Scholar]
- 27. Tang SW, Chang Wh, Su YC et al MYC pathway is activated in clear cell renal cell carcinoma and essential for proliferation of clear cell renal cell carcinoma. Cancer Lett 2009; 273: 35–43. [DOI] [PubMed] [Google Scholar]
- 28. Lanigan D, McLean PA, Murphy DM, Donovan MG, Curran B, Leader M. c‐myc expression in renal cell carcinoma: correlation with clinical parameters. Br J Urol 1993; 72: 143–7. [DOI] [PubMed] [Google Scholar]
- 29. Liu Y, Ahang C, Fan J et al Comprehensive analysis of clinical significance of stem cell related factors in renal cell cancer. World J Surg Oncol 2011; 9: 121. [DOI] [PMC free article] [PubMed] [Google Scholar]
- 30. Liu Y, Yin B, Zhang C, Zhou L, Fan J. Has‐let‐7a functions as a tumor suppressor in renal cell carcinoma cell lines by targeting c‐myc. Biochem Biophyd Res Commun 2012; 417: 371–5. [DOI] [PubMed] [Google Scholar]
- 31. Sobin LH, Gospodarowicz MK, Wittenkind C. TNM Classification of Malignant Tumours, 7th edn. International Union Against Cancer, New York: Wiley‐Liss, 2009; 255–7. [Google Scholar]
- 32. Nohata N, Sone Y, Fuse M et al miR‐1 as a tumor suppressive microRNA targeting TAGLN2 in head and neck squamous cell carcinoma. Oncotarget 2011; 2: 29–42. [DOI] [PMC free article] [PubMed] [Google Scholar]
- 33. Wu S, Lin Y, Xu D et al MiR‐135a functions as selective killer of malignant glioma. Oncogene 2011; 31: 3866–74. [DOI] [PubMed] [Google Scholar]
- 34. Remco N, Carlos le S, Begona D et al Regulation of the Adenomatous Polyposis Coli Gene by the miR‐135 Family in Colorectal Cancer. Cancer Res 2008; 68: 5795–802. [DOI] [PubMed] [Google Scholar]
- 35. Lan FF, Wang H, Chen YC et al Hsa‐let‐7 g inhibits proliferation of hepatocellular carcinoma cells by downregulation of c‐Myc and upregulation of p16(INK4A). Int J Cancer 2011; 128: 319–31. [DOI] [PubMed] [Google Scholar]
- 36. Xiong J, Du Q, Liang Z. Tumor‐suppressive microRNA‐22 inhibits the transcription of E‐box‐containing c‐Myc target genes by silencing c‐Myc binding protein. Oncogene 2010; 29: 4980–8. [DOI] [PubMed] [Google Scholar]
- 37. Yamamura S, Saini S, Majid S et al MicroRNA‐34a suppresses malignant transformation by targeting c‐Myc transcriptional complexes in human renal cell carcinoma. Carcinogenesis 2012; 33: 294–300. [DOI] [PMC free article] [PubMed] [Google Scholar]
- 38. Sachdeva M, Zhu S, Wu F et al p53 represses c‐Myc through induction of the tumor suppressor miR‐145. Proc Natl Acad Sci U S A 2009; 106: 3207–12. [DOI] [PMC free article] [PubMed] [Google Scholar]
- 39. Liao JM, Lu H. Autoregulatory suppression of c‐Myc by miR‐185‐3p. J Biol Chem 2011; 286: 33901–9. [DOI] [PMC free article] [PubMed] [Google Scholar]
- 40. Sun T, Wang C, Xing J, Wu D. miR‐429 modulates the expression of c‐myc in human gastric carcinoma cells. Eur J Cancer 2011; 47: 2552–9. Epub 2011 Jun 16. [DOI] [PubMed] [Google Scholar]
- 41. Grandori C, Cowley SM, James LP. The Myc/Max/Mad network and the transcriptional control of cell behavior. Annu Rev Cell Dev Biol 2000; 16: 653–99. [DOI] [PubMed] [Google Scholar]
- 42. Eilers M, Eisenman RN. Myc's broad reach. Genes Dev 2008; 22: 2755–66. [DOI] [PMC free article] [PubMed] [Google Scholar]
- 43. Adhikary S, Eilers M. Transcriptional regulation and transformation by Myc proteins. Nat Rev Mol Cell Biol 2005; 6: 635–45. [DOI] [PubMed] [Google Scholar]
- 44. Dang CV, O'Donnel KA, Zeller KI, Nguyen T, Osthus RC, Li F. c‐Myc tatget gene network. Semin Cancer Biol 2006; 16: 253–64. [DOI] [PubMed] [Google Scholar]
- 45. Knoepfler PS. Myc goes global: new tricks for an old oncogene. Cancer Res 2007; 67: 5061–63. [DOI] [PubMed] [Google Scholar]
- 46. Guo QM, Malek RL, Kim S et al Identification of c‐myc responsive genes using rat cDNA microarray. Cancer Res 2000; 60: 5922–28. [PubMed] [Google Scholar]
- 47. Zhou Q, Hopp T, Fugua SA, Steeg PS. Cyclin D1 in breast premalignancy and early breast cancer: implication for prevention and treatment. Cancer Lett 2001; 162: 3–17. [DOI] [PubMed] [Google Scholar]
- 48. Arvanitis C, Felsher DW. Conditional transgenic models define how MYC initiates and maintains tumorigenesis. Semin Cnacer Biol 2006; 16: 313–17. [DOI] [PubMed] [Google Scholar]
- 49. Watt FM, Frye M, Benitah SA. MYC in mammalian epidermis: how can an oncogene stimulate. Nat Rev Cancer 2008; 8: 234–42. [DOI] [PMC free article] [PubMed] [Google Scholar]
Associated Data
This section collects any data citations, data availability statements, or supplementary materials included in this article.
Supplementary Materials
Fig. S1. Cell viabilities altered in the miR‐135a stable transfectant.
Table S1. Down‐regulated genes in miR‐135a transfectants.