

Abstract
Genetic alterations and deregulation of the miRNA biogenesis pathway components have been reported in human tumors. Tissue‐specific deletion of the Dicer gene, which encodes an essential miRNA processing enzyme, promotes carcinogenesis in animal models. These features indicate that aberrant miRNA biogenesis components are directly associated with cancer. For the present study, we conducted quantitative RT‐PCR of 14 genes that are related to the miRNA biogenesis pathway in 47 paired samples of primary hepatocellular carcinoma (HCC) and matched non‐cancerous liver. Expression of seven genes (Dgcr8, p68, p72, Dicer, Ago3, Ago4 and Piwil4) was significantly decreased in primary HCC, especially in non‐viral HCC subtypes, compared to the non‐cancerous liver. Combinations of decreased expression of the miRNA biogenesis components in non‐cancerous liver were related to cigarette smoking, alcohol intake and diabetes, which are known to be risk factors for HCC, and were also associated with the occurrence of multicentric tumors. Reduction of two of these genes (Dicer and p68) in HCC was associated with poor prognosis. Trimethylation of histone H3 lysine 27 in the promoters is implicated in the deregulation of these miRNA‐biogenesis‐related genes in non‐HBV genome integrated HCC cell lines. In conclusion, deregulation of the miRNA biogenesis pathway components is frequently observed in non‐viral‐associated HCC and is linked to etiological risk factors and poor prognosis. Our study further showed that epigenetic regulation could be implicated in the deregulation of these genes during hepatocarcinogenesis.
Hepatocellular carcinoma (HCC) is the third leading cause of cancer death worldwide.1 Although previous studies have revealed multiple etiologic factors responsible for HCC occurrence (e.g. hepatitis viruses [HBV and HCV], intake of alcohol or aflatoxin B1‐contaminated food, cigarette smoking, obesity and diabetes),1, 2 the understanding of the molecular abnormalities induced by these environmental agents during hepatocarcinogenesis is incomplete.
Micro‐RNA are a family of small (18–22 nucleotides [nt] in length) endogenous single‐stranded RNA.3 Their aberrant expression is associated with human diseases, including cancer.4 Most mammalian miRNA genes are initially transcribed into primary miRNA (pri‐miRNA) by RNA polymerase II (Fig. S1). These pri‐miRNA are then cleaved endonucleolytically by the Drosha complex to form approximately 70‐nt hairpin‐structured precursor miRNA (pre‐miRNA). The Drosha complex comprises the RNase III enzyme Drosha, the DiGeoge syndrome critical region gene 8 (DGCR8) and multiple RNA‐associated proteins, including the RNA helicases p68 (also known as DDX5) and p72 (also known as DDX17).5 Pre‐miRNA are transported into the cytoplasm with the help of Exportin‐5 (XPO5) and are cleaved into double‐stranded approximately 22‐nt duplexes by Dicer, another RNase III enzyme, in the cytoplasm. One of the strands associates with an Argonaute (Ago) protein, functioning as a guide to repress target mRNA.3, 5, 6, 7. Argonaute contains an RNA‐binding PAZ domain that is shared with another family of small‐RNA‐binding proteins, PIWILs.8
Previous miRNA profiling studies have revealed global deregulation of mature miRNA in human cancers.4, 6 Such a broad change of miRNA gene expression is due primarily to aberrant transcriptional regulation, including CpG hypermethylation silencing of the promoter and abnormalities of transcriptional factors. Alternatively, molecular defects of miRNA biogenesis would also severely affect the mature miRNA profiles in cancer, and recent studies have shown that cancer‐related signal molecules (e.g. TP53 and SMAD) regulate this process.9, 10, 11 Downregulation of Drosha and Dicer genes have been reported in ovarian and other cancers.12, 13 Importantly, mutational impairments of the miRNA‐processing pathway, including the Dicer14, 15 and Xpo5,16 genes have been reported in human tumors. Notably, tissue‐specific deletion of the Dicer gene, which encodes an essential processing enzyme, promotes lung and liver carcinogenesis in mice, indicating that aberrant miRNA biogenesis is directly associated with cancer.17, 18
Materials and Methods
Primary hepatocellular carcinoma and liver tissues
After obtaining approval from the institutional review board and informed consent from patients, 47 paired samples of primary HCC and matched adjacent non‐cancerous liver tissues, and 10 samples of non‐HCC‐associated liver tissue were obtained from surgical specimens resected at the National Cancer Research Center Hospital, Tokyo between December 1998 and March 2010. Among the 47 HCC patients, 16 were immunologically positive for HCV infection, 11 for persistent HBV infection (hepatitis B surface antigen positive), two had a history of previous HBV infection, which we excluded in our HBV analysis, and 18 were negative for both HCV and HBV infection. The 10 samples of non‐HCC‐related liver tissues were negative for either HCV or HBV infection. The clinicopathological data for all cases are shown in Table 1.
Table 1.
Clinicopathological data for the 47 cases
| Characteristic | n (%) | |
|---|---|---|
| Sex | Male | 40 (85.1) |
| Female | 7 (14.9) | |
| Median age, year (Range) | 66 (40.0–78.0) | |
| Viral infection | HBV positivea | 11 (23.4) |
| HCV positiveb | 16 (34.0) | |
| Both HBV and HCV Negative | 18 (38.3) | |
| Past of HBV positivec | 2 (4.3) | |
| Tobacco | Yes | 33 (70.2) |
| No | 14 (29.8) | |
| Alcohol | Yes | 34 (72.3) |
| No | 8 (17.0) | |
| Unknown | 5 (10.6) | |
| HbA1c | ≥6.0% | 12 (25.5) |
| <6.0% | 28 (59.6) | |
| Unknown | 7 (14.9) | |
| Grade of tumor differentiation | Well differentiated HCC | 7 (14.9) |
| Moderately differentiated HCC | 31 (66.0) | |
| Poorly differentiated HCC | 9 (19.1) | |
| Maximum tumor diameter | <2.0 cm | 4 (8.5) |
| >2.0 cm | 43 (91.5) | |
| Number of Tumors | Single | 32 (68.1) |
| Multiple | 15 (31.9) | |
| Non tumor liver | Normal | 7 (14.9) |
| Chronic hepatitis | 10 (21.3) | |
| Precirrhosis | 19 (40.4) | |
| Cirrhosis | 11 (23.4) | |
HBV positive represents positivity for hepatitis B surface antigen.
HCV positive represents positivity for serum HCV antibody.
History of past HBV infection represents negativity for hepatitis B surface antigen, positivity for hepatitis B surface antibody and positivity for hepatitis B core antibody.
RNA extraction and RT‐PCR and quantitative RT‐PCR
Total RNA was extracted using a mirVana miRNA Isolation Kit (Ambion, Austin, TX, USA) and the RNA samples were treated with DNase I (New England Bio Labs, Ipswich, MA, USA). Total RNA (5 μg) was used to generate complementary DNA by reverse transcription with a First Strand cDNA Synthesis Kit (Roche, Indianapolis, IN, USA). Quantitative RT‐PCR (qRT‐PCR) was performed on a Light Cycler 480 (Roche, Manheim, Germany) using TaqMan probes (Applied Biosystems, Foster City, CA, USA). Expression of each gene was determined using the 2−ΔΔCt method and normalized relative to the expression of the glyceraldehyde 3‐phosphate dehydrogenase (GAPDH) gene and TATA box binding protein. The sequences of the qRT‐PCR primers are listed in Table S1. For miRNA detection, total RNA (10 ng) from each sample was used, and mature has‐let‐7a was reverse‐transcribed with specific RT primer using the TaqMan MicroRNA Reverse Transcription Kit (Applied Biosystems). qRT‐PCR was performed on a Light Cycler 480 (Roche), quantified and normalized by U6 small nuclear RNA using TaqMan miRNA assays (Applied Biosystems).
Cell culture, drug treatments and siRNA‐mediated gene silencing
HuH‐1 cells were obtained from the Human Science Research Resource Bank (Osaka, Japan). HepG2 and Alex (PLC/PRF/5) cells were provided from the Riken Cell Bank (Tsukuba, Japan). KYN2 have been described previously.19 HepG2 and KYN2 cell lines are validated as negative for HBV genome integration (data not shown). HuH‐1 and Alex cells are derived from HBV‐positive HCC.20, 21 Cell lines were treated with 10 μM 5‐aza‐2′‐deoxycytidine (5‐aza‐dC; Sigma‐Aldrich, St. Louis, MO, USA) for 72 h.22 siRNA targeting the embryonic ectoderm development (EED) and GAPDH genes were purchased from Dharmacon (Lafayette, CO, USA) and were transfected using Lipofectamine RNAiMAX reagent (Invitrogen, Carlsbad, CA, USA).
Bisulfite sequencing
Bisulfite treatment of genomic DNA (500 ng) was performed using an EZ DNA methylation kit (Zymo Research, Orange, CA, USA). PCR products encompassing the CpG islands were cloned into the pCR2.1‐TOPO vector (Invitrogen), and at least 14 independent clones were sequenced using an ABI 3130 Genetic Analyzer (Applied Biosystems). We used a CpG island searcher (http://cpgislands.usc.edu/) to predict the CpG islands and QUMA (http://quma.cdb.riken.jp/top/index.html) for methylation quantification.
ChIP‐PCR assay
Approximately 1 × 10⁷ cells of each cell line were fixed with 1% formaldehyde for 10 min at room temperature. The formaldehyde was then quenched by addition of a 1/20 volume of 2.5 M glycine to the plates, and the cells were harvested. The chromatin was then sonicated to create DNA fragments with a length of 200–1000 base pairs. Fragmented chromatin was subjected to immunoprecipitation with/without a polyclonal anti‐histone H3 trymethyl Lys 27 antibody (Active Motif, Carlsbad, CA, USA). The co‐immunoprecipitated fragments of DNA extracted using a QIAquick PCR Purification Kit (Qiagen, GmbH, Germany) were amplified by PCR. The PCR primer sequences are listed in Table S1. The assays were performed more than twice.
Immunoblot analysis
Cells were washed once with PBS, and proteins in the nuclear fraction were extracted using ProteoExtract (Merck, Damstadt, Germany) with a protease inhibitor cocktail (Roche). The proteins (20 μg) were electrophoresed, transferred to a polyvinylidene difluoride membrane (Millipore, Billerica, MA, USA), and blotted with a polyclonal anti‐histone H3 trymethyl Lys 27 antibody (Active Motif, Carlsbad, CA, USA) or a rabbit monoclonal anti‐histone H3 antibody (clone 3H1; Cell Signaling Technology, Danvers, MA, USA).
Statistical analyses
Statistical analyses were performed using the Statview 5.0 software package (Abacus Concepts, Berkeley, CA, USA). Statistical analysis of the expression data was performed using Student's t‐test or Welch's t‐test (two‐group t‐test: unpaired); the latter was used after dispersion of the data had been calculated by F‐test and two‐group t‐test (a paired or Wilcoxon signed‐rank test was used). Pearson's correlation and Spearman's rho coefficient test were calculated to examine the correlations among the relative expressions of the various genes. The chi square test, Fisher's exact test and multivariate logistic regression analysis were used for comparing subgroups. Kaplan–Meier plots were used for calculating disease‐free survival probabilities, and the log‐rank test was used for testing statistical significance. Data are expressed as mean ± SD. All reported P‐values are two‐tailed, except for the F‐test (one‐tailed), and differences were considered significant at P < 0.05.
Results
Decreased expression of miRNA biogenesis pathway‐related genes in hepatocellular carcinoma
Using qRT‐PCR, we measured the expression of 14 mRNA related to the miRNA biogenesis pathway (Drosha, Dgcr8, p68, p72, Dicer, Xpo‐5, Ago1‐4 and Piwil1‐4) in 47 paired samples of primary HCC and corresponding non‐cancerous liver tissue and 10 samples of non‐HCC‐associated liver tissue. Seven miRNA‐biogenesis‐related (miRBir) genes (Dgcr8, p68, p72, Dicer, Ago3, Ago4 [P < 0.01] and Piwil4 [P < 0.05] , unpaired t‐test) were significantly downregulated in tumors relative to the non‐cancerous liver (Fig. 1a). Among the 14 genes, none of the seven miRBir genes were downregulated in samples of HCV‐positive HCC, and three genes (p68, Dicer and Ago3) (P < 0.05) showed decreased expression in HBV‐positive HCC (Fig. 1b). In contrast, six miRBir genes (Dgcr8, p68, p72, Dicer, Ago3 and Ago4) were significantly (P < 0.01) downregulated in samples of non‐HBV, non‐HCV (NBNC) HCC (Fig. 1b).
Figure 1.
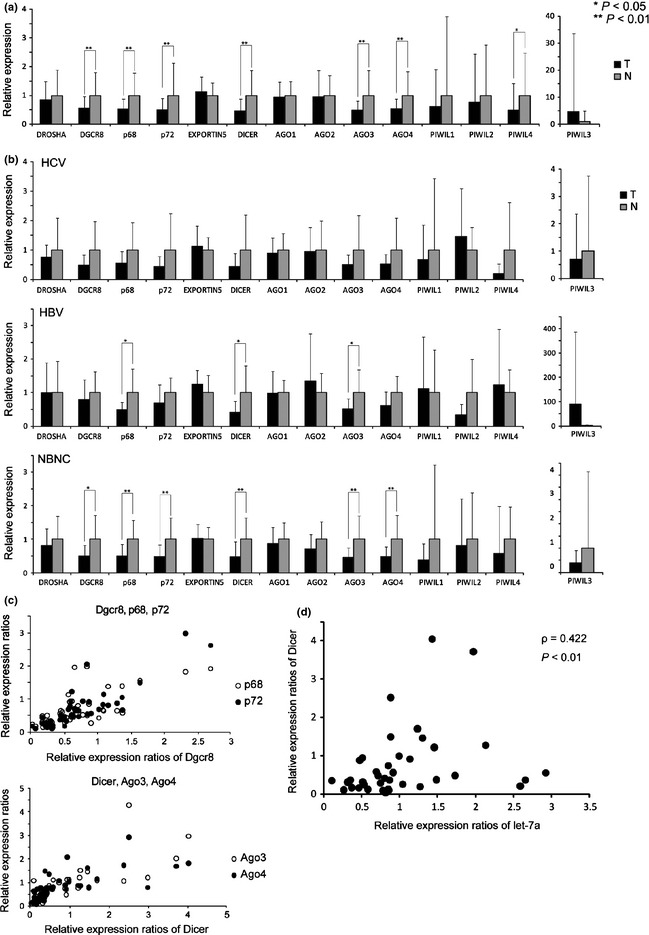
Decreased expression of miRNA‐biogenesis‐related (miRBir) genes in primary hepatocellular carcinoma (HCC). (a) Relative expression of each gene related to miRNA biogenesis was measured by quantitative RT‐PCR in tumor (T) and non‐cancerous liver (N). The adjusted expression data to that of non‐cancerous liver tissue in each gene is shown. Significant difference is indicated by asterisk (*P < 0.05, ** P < 0.01). (b) Relative expression of the miRBir genes in virus‐positive (HCV or HBV) and virus‐negative (NBNC) HCC. Significant difference is indicated by asterisk (*P < 0.05, **P < 0.01). (c) Correlations among the relative expressions ratio (T/N) of the Dgcr8, p68 and p72 genes (left), and those of the Dicer, Ago3 and Ago4 genes in HCC. Pearson's correlation coefficient >0.70, except between the Dicer and Ago4 genes (0.679) (P < 0.05). (d) Significant correlation between Dicer and let‐7a expression in HCC. Pearson's correlation coefficient was 0.422 (P < 0.01).
We also examined the expression of 14 miRBir genes in HCC cell lines. A total of eight genes (Drosha, Dgcr8, p72, Ago3, Ago4, Piwil1, Piwil2 and Piwil4) were significantly reduced in HCC cell lines, which were negative for HBV and HCV infection compared to the non‐cancerous liver tissues (Fig. S2A). Six genes (p72, Ago1, Ago3, Ago4, Piwil1 and Piwil2) also significantly decreased in two HBV‐associated HCC cell lines (Alex and HuH‐1) (Fig. S2B).
We then examined correlations among the relative expression ratios (tumor versus non‐cancerous liver) of these seven genes. Correlations among the relative expressions of the Dgcr8, p68 and p72 genes, all of which encode the Drosha complex in the nucleus, and among those of the Dicer, Ago3 and Ago4 genes, were notable (Pearson's correlation coefficient >0.70, except between the Dicer and Ago4 genes [0.679], P < 0.05; Fig. 1c and Table S2). We found that reduced Dicer expression was significantly correlated with downregulation of let‐7a in HCC (Fig. 1d), which has been reported to be decreased in HCC and negatively regulates cell proliferation.23
Hepatocellular carcinoma risk factors and multicentric tumor occurrence are associated with reduced expression of miRBir genes in non‐cancerous liver
Frequent decrease of the miRBir genes in NBNC HCC prompted us to examine whether any etiological factors other than virus infection are associated with this aberrant expression. We first examined whether there was any correlation between expression change of the miRBir genes in HCC and non‐viral etiological factors (alcohol intake, smoking and HbA1c). However, reduction of all genes in tumors was not associated with these etiological factors. (Fig. S3).
We then examined the relationship between miRBir gene expressions in non‐cancerous liver tissues and etiological factors (Fig. 2). First, we examined the relationship between background liver histology and expression of microRNA biogenesis components. Significant difference in the Ago3 gene expression was observed between normal liver and chronic hepatitis. Significantly decreased expression of the Ago3, Ago4 and Piwil4 genes was detected in precirrhosis status compared to the normal liver (Fig. S4). There was no significant association between background liver histology and other etiological factors (smoking, alcohol and diabetes) (Table S3). Finally, we examined the relationship between expression of miRBir genes and etiological factors. Notably, expression of five miRBir genes (Ago1, Ago2, Ago3 Exportin‐5 and Dgcr8) was already reduced in the non‐cancerous liver of patients who smoked. Decreased expression of Piwil 1 was found to be associated with habitual alcohol intake. Reduced expression of the Ago1 gene was also associated with an elevated level of HbA1c, a serum marker of diabetes. Multivariate analysis revealed that reduced expression of Ago1 gene was independently associated with smoking and diabetes (Tables 2 and 3 and Table S4). Therefore, aberrant expression of most miRBir genes in non‐cancerous liver is associated with non‐viral etiological factors.
Figure 2.
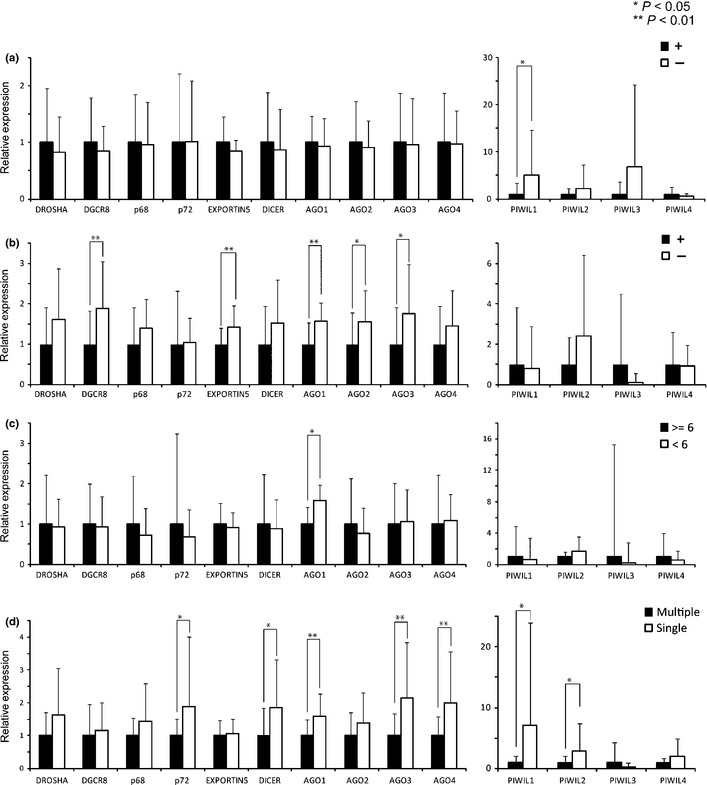
The association between relative miRBir gene expression in non‐cancerous liver and etiological factors. Relative expressions of miRBir genes in non‐cancerous liver of patients with (closed column) or without (open column) (a) alcohol intake, (b) smoking (upper middle), increased HbA1C (c) and multiplicity (d) are shown. Significant difference is indicated by asterisk (*P < 0.05, **P < 0.01).
Table 2.
Mutivriate logistic regression analysis for smoking
| Gender | Hazard ratio | 95% CI | P value |
|---|---|---|---|
| Non tumor liver | |||
| Normal | |||
| Chronic hepatitis | 0.199 | 0.154–9.888 | 0.842 |
| Precirrhosis | 0.642 | 0.170–32.960 | 0.521 |
| Cirrhosis | 0.709 | 0.189–35.200 | 0.478 |
| DGCR8 | −0.617 | 0.701–1.203 | 0.537 |
| EXPORTIN5 | −1.089 | 0.013–3.478 | 0.276 |
| AGO1 | −1.987 | 0.121–0.986 | 0.047 |
| AGO2 | 0.235 | 0.230–6.504 | 0.814 |
| AGO3 | 0.278 | 0.841–1.259 | 0.781 |
Table 3.
Mutivriate logistic regression analysis for diabate
| Gender | Hazard ratio | 95% CI | P value |
|---|---|---|---|
| Non tumor liver | |||
| Normal | |||
| Chronic hepatitis | 0.534 | 0.230–13.050 | 0.5930 |
| Precirrhosis | 1.104 | 0.344–45.800 | 0.2695 |
| Cirrhosis | 0.919 | 0.183–110.300 | 0.3580 |
| AGO1 | 2.377 | 1.287–13.818 | 0.0175 |
Previous studies have shown that etiological high‐risk factors of HCC are associated with the occurrence of multicentric tumors.1, 2 Interestingly expression of seven miRBir genes (Ago1, Ago3, Ago4, Dicer, Piwil1, Piwil2 and p72) was significantly reduced in non‐cancerous tissues with multicentric tumors (Fig. 2). There was no significant relationship between the presence of intra‐hepatic metastasis and expression of the miRBir genes in non‐cancerous liver (Fig. S5).
Prognostic significance of miRBir gene reduction in hepatocellular carcinoma
Expression of the p68 and p72 genes in tumors relative to that in the paired samples of non‐cancerous liver was significantly (P < 0.01) decreased in more poorly differentiated cases (Fig. 3a). Decreased expression of the p68 and Dicer genes but not others was significantly associated with shorter recurrence‐free survival time (p68, P = 0.0217; Dicer, P = 0.0273, by log‐rank test) (Fig. 3b).
Figure 3.
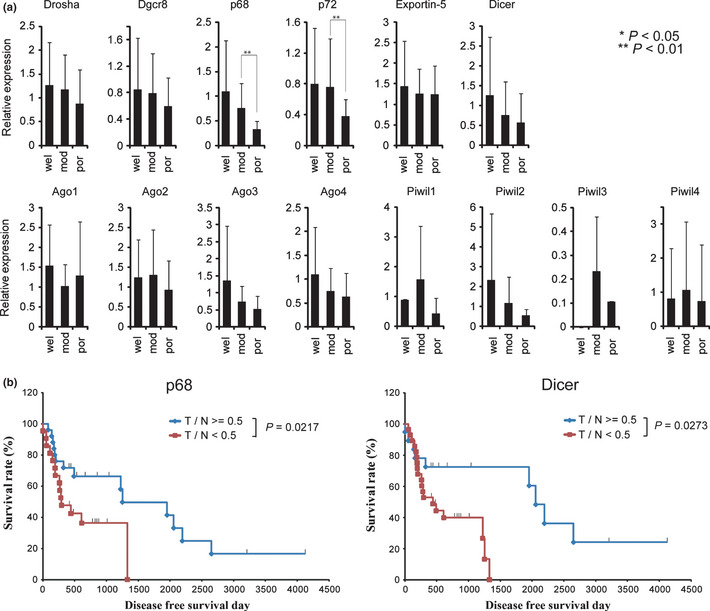
Reduction of the miRBir genes was associated with prognosis in hepatocellular carcinoma (HCC). (a) Association between expression of the p68 and p72 genes and tumor histology. Expression of the miRBir genes in tumors relative to that in the paired samples of non‐cancerous liver (T/N) in different histological category is shown. Expression of the p68 and p72 genes was significantly (P < 0.01) decreased in poorly differentiated cases (indicated by asterisk). (b) Decreased expression of the p68 and Dicer genes was associated with shorter recurrence‐free survival time. Kaplan–Meier plots of the patients segregated according to the relative (tumor versus non‐cancerous liver [T/N]) expression of the two genes are shown. Significant difference is indicated by asterisk (*P < 0.05, **P < 0.01).
H3K27me3 in promoter regions partly regulates the silencing of miRBir genes
Because reduced expression of the miRBir genes is already evident in non‐cancerous liver tissues with characteristic etiological backgrounds such as smoking, we hypothesized that epigenetic regulation may play a role in this aberrant gene expression.
To examine whether methylation of CpG islands is involved in deregulation of the miRBir genes, we chose two non‐HBV genome integrated HCC cell lines (HepG2 and KYN2 cells). Bisulfite sequencing of CpG islands in the promoter regions revealed full methylation in the p72 gene, partial methylation in the Ago4 gene and unmethylation in the Dgcr8 gene (Fig. S6) in these cells. We treated these cell lines with 5‐aza‐dC, a DNA methyltransferase inhibitor, and measured the expressions of these genes by qRT‐PCR. We validated the effect of 5‐aza‐dC treatment on the expression of the SFRP1 gene, which has been previously confirmed to be silenced by CpG island methylation in HCC (Fig. S7).24 Even in this condition, expression of the seven genes was affected little or even decreased after treatment in HepG2 and KYN2 cells (Fig. 4a).
Figure 4.
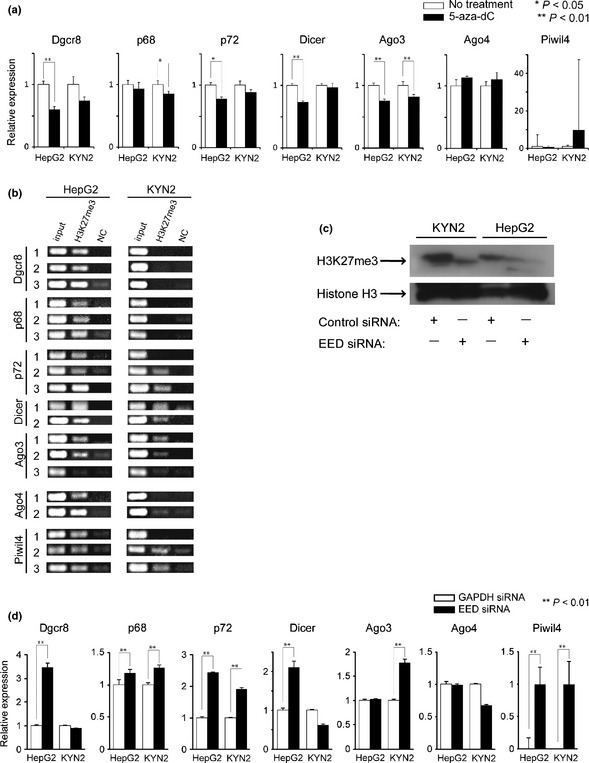
Epigenetic regulation of the miRBir genes by histone H3 lysine 27 trimethylation in hepatocellular carcinoma (HCC) cells. (a) Expression of the miRBir genes in HepG2 and KYN2 cells upon treatment with 5‐Aza‐dC. Expression of miRBir genes in drug‐treated HCC cells relative to the untreated cells is shown. (b) Detection of H3K27me3 in the promoter regions of the p72, Dicer, Ago3 and Piwil4 genes in all cell lines. H3K27me3 in the promoter regions of Dgcr8, p68 and Ago4 genes was detected in three cell lines. Chromatin immunoprecipitates obtained with anti‐H3K27me3 antibody (H3K27me3) or control IgG (NC) were amplified with primers covering the promoters of the miRBir genes and electrophoresed. (c) Decrease of H3K27me3 in HCC cells with embryonic ectoderm development (EED) knockdown. Immunoblot analysis of H3K27me3 and total histone H3 in the nuclear fraction of siRNA‐treated HepG2 and KYN2 cells. (d) Recovery of the downregulated miRBir genes in EED‐knockdown HCC cells. Relative expressions of the seven miRBir genes in the EED‐knockdown cells are shown. Significant difference is indicated by asterisk (*P < 0.05, **P < 0.01).
We next focused on trimethylated H3K27 (H3K27me3), a repressive histone modification that plays a major role in epigenetic silencing in stem cells and cancer, and is independent of, or coexists with, DNA methylation.25 We investigated the presence of H3K27me3 in the promoter regions of seven miRBir genes using ChIP‐PCR in these HCC cell lines (Fig. S8). We detected the presence of H3K27me3 modification in the promoter regions of the p72, Dicer, Ago3 and Piwil4 genes in two cell lines, while H3K27me3 in the promoter regions of Dgcr8, p68 and Ago4 genes was detected only in HepG2 cells (Fig. 4b).
To determine whether this histone modification is actively implicated in the epigenetic silencing of target genes, we then attempted to decrease H3K27me3 modification in these cells. H3K27 methylation is catalyzed by two highly‐related histone methyltransferases (HMT) in the Polycomb Repressive Complex 2 (PRC2).26 PRC2 contains multiple proteins, among which EED protein plays a pivotal role in the propagation of H3K27me3 marking.27 We knocked down EED expression using siRNA, which decreased H3K27me3 in the two cell lines (Fig. 4c). In HepG2 cells, five genes out of seven increased when EED was knocked down, and four genes increased with EED siRNA treatment in KYN2 cells (Fig. 4d).
Discussion
Our expression analysis of the miRNA biogenesis pathway revealed that seven key molecules, including the Dicer gene, were frequently and simultaneously downregulated in HCC, indicating that decreased miRNA biogenesis pathway is associated with human hepatocarcinogenesis, as has been proposed in a mouse model.17 Furthermore, we found that reduced expression of the miRNA biogenesis components occurred more frequently in HCC without hepatitis viral infection. Downregulation of five genes (Ago1, Ago2, Ago3 Exportin‐5 and Dgcr8) in non‐cancerous liver was associated with a history of smoking. Other genes (Piwi4 and Ago1) were reduced in background liver of patients with habitual alcohol intake and diabetes. In particular, reduction of Ago1 gene was independently associated with smoking and diabetes. Izzotti et al.28 report that cigarette smoke exposure caused downregulation of miRNA in the lungs of rats, which suggests that miRNA deregulation resulting from chronic exposure to non‐viral carcinogens or metabolic stress could be a more general phenomenon leading to malignancy. In addition to inducing downregulation of tumor‐suppressive miRNA, deregulation of miRNA biogenesis may have further biological significance in hepatocarcinogenesis. Wei et al. (29) and Francia et al. (30) report Dicer and Drosha to be indispensable for DNA repair and DNA damage response in normal cells. It is possible that aberrant regulation of miRNA synthesis pathway also plays an important role in genomic instability of HCC.
Reduced expression of the Dicer or Drosha gene is reportedly associated with clinical aggressiveness or poorer prognosis for tumors arising from various organs, including the lung and ovary.12, 31 Decreased Dicer expression in cancer conferred increased proliferative ability and an invasive phenotype.32, 33 Our analysis has revealed that downregulation of seven components of the miRNA‐biogenesis pathway is associated with the presence of multicentric tumors. Downregulation of the p68 and Dicer genes was also significantly associated with shorter recurrence‐free survival time. These results suggest that deregulation of miRNA biogenesis components is tightly associated with a higher risk of both liver carcinogenesis and tumor recurrence.
The molecular mechanisms underlying deregulation of the miRNA biogenesis pathway in tumorigenesis are only now becoming clearer,9, 10, 11 and recent studies have demonstrated downregulation of the Dicer gene by either induction of Dicer‐targeting miRNA (miR‐103/107)32 or suppression of its direct trans‐activator (TAp63),33 as well as recurrent mutations of the Xpo5, TARBP2 and Dicer genes in mismatch repair‐deficient cancers or other tumors.13, 14, 15, 34 A discrepancy between the downregulated genes in primary HBV‐positive HCC and in cell lines derived from HBV‐positive HCC indicated that the status of viral protein activity may be associated with expression of miRBir genes. Based on our findings in clinical samples, we hypothesized that epigenetic silencing might be responsible for downregulation of the miRNA pathway in hepatocarcinogenesis. ChIP‐PCR analysis revealed the frequent presence of H3K27me3 in the promoters of downregulated miRNA biogenesis components and a global decrease of trimethylation of lysine 27 in histone H3 (H3K27me3) by EED knockdown induced partial recovery of the expression of the target genes and let‐7a in HCC cells (Fig. S9). However, there was also a discrepancy between the expression of Dicer gene and let‐7a in HepG2 cells, suggesting that complicated molecular mechanisms exist to regulate tumor suppressive miRNA expression.35
H3K27me3 is one of the major epigenetic histone modifications in silenced chromatin, and is catalyzed by HMT (EZH1 and EZH2).26, 27 Increased expression and oncogenic activity of HMT, especially EZH2, has been reported in HCC36 and H3K27me3 modification silences tumor suppressor genes in other cancer types.37 Our results suggest that aberrant H3K27me3 modification modulates the miRNA biogenesis pathway in HCC.
In conclusion, our study has for the first time demonstrated that reduced expression of genes related to the miRNA biogenesis pathway is frequent, and especially associated with specific etiological backgrounds and poor prognosis in HCC. Additional analyses of HCC cell lines have shown that histone modification could be at least partly implicated with this deregulation. The identification of this novel molecular alteration should be of clinical significance for designing diagnostic or preventive modalities and evaluating the prognosis for liver cancers, especially the non‐viral subtype.
Disclosure Statement
The authors have no conflict of interest to declare.
Supporting information
Fig. S1. The biogenesis of miRNA in mammalian cells.
Fig. S2. The relative expressions of miRNA‐biogenesis‐related (miRBir) genes in hepatocellular carcinoma cell lines.
Fig. S3. The association between relative miRBir gene expression in hepatocellular carcinoma and etiological factors.
Fig. S4. The relationship between background liver histology and expression of miRNA biogenesis components in non‐cancerous liver.
Fig. S5. The relationship between intra‐liver metastasis and expression of the miRBir genes in non‐cancerous liver.
Fig. S6. Methylation status of CpG islands in the promoters of the three miRBir genes.
Fig. S7. Methylation specific PCR revealed intense CpG island methylation of the SFRP1 gene promoter in these cell lines.
Fig. S8. Positions of CpG island and ChIP‐PCR primer range in seven miRBir genes are presented.
Fig. S9. Decreased of let‐7a miRNA in HepG2 cell line and increased in KYN2 with EED siRNA knockdown.
Table S1. PCR primers.
Table S2. Pearson's correlation among the relative expression ratios (tumor versus non‐cancerous liver) of the seven miRBir genes.
Table S3. Statistical analysis between subgroups of patients' background (alcohol, tobacco and diabetes).
Table S4. Mutivriate logistic regression analysis for alcohol.
Acknowledgments
This work was supported in part by the Foundation for Promotion of Cancer Research (FPCR), Japan, a grant‐in‐aid for the 3rd Term Comprehensive 10‐Year‐Strategy for Cancer Control from the Ministry of Health, Labor and Welfare, Japan, and Management Expenses Grants from the Government to the National Cancer Center. NK is an awardee of Research Resident Fellowship from FPCR.
(Cancer Sci 2013; 104: 543–551)
References
- 1. Gomaa AI, Khan SA, Toledano MB, Waked I, Taylor Robinson SD. Hepatocellular carcinoma: epidemiology, risk factors and pathogenesis. World J Gastroenterol 2008; 14: 4300–308. [DOI] [PMC free article] [PubMed] [Google Scholar]
- 2. Fan JG, Farrell GC. Prevention of hepatocellular carcinoma in nonviral‐related liver diseases. J Gastroenterol Hepatol 2009; 24: 712–19. [DOI] [PubMed] [Google Scholar]
- 3. Bartel DP. MicroRNAs: genomics, biogenesis, mechanism, and function. Cell 2004; 116: 281–97. [DOI] [PubMed] [Google Scholar]
- 4. Lu J, Getz G, Miska EA et al MicroRNA expression profiles classify human cancers. Nature 2005; 435: 834–8. [DOI] [PubMed] [Google Scholar]
- 5. Fukuda T, Yamagata K, Fujiyama S et al DEAD‐box RNA helicase subunits of the Drosha complex are required for processing of rRNA and a subset of microRNAs. Nat Cell Biol 2007; 9: 604–11. [DOI] [PubMed] [Google Scholar]
- 6. Thomson JM, Newman M, Parker JS, Morin Kensicki EM, Wright T, Hammond SM. Extensive post‐transcriptional regulation of microRNAs and its implications for cancer. Genes Dev 2006; 20: 2202–7. [DOI] [PMC free article] [PubMed] [Google Scholar]
- 7. Gregory RI, Yan KP, Amuthan G et al The Microprocessor complex mediates the genesis of microRNAs. Nature 2004; 432: 235–40. [DOI] [PubMed] [Google Scholar]
- 8. Peters L, Meister G. Argonaute proteins: mediators of RNA silencing. Mol Cell 2007; 26: 611–23. [DOI] [PubMed] [Google Scholar]
- 9. Suzuki HI, Yamagata K, Sugimoto K, Iwamoto T, Kato S, Miyazono K. Modulation of microRNA processing by p53. Nature 2009; 460: 529–33. [DOI] [PubMed] [Google Scholar]
- 10. Davis BN, Hilyard AC, Nguyen PH, Lagna G, Hata A. Smad proteins bind a conserved RNA sequence to promote microRNA maturation by Drosha. Mol Cell 2010; 39: 373–84. [DOI] [PMC free article] [PubMed] [Google Scholar]
- 11. Suzuki HI, Miyazono K. Dynamics of microRNA biogenesis: crosstalk between p53 network and microRNA processing pathway. J Mol Med 2010; 88: 1085–94. [DOI] [PubMed] [Google Scholar]
- 12. Merritt WM, Lin YG, Han LY et al Dicer, Drosha, and outcomes in patients with ovarian cancer. N Engl J Med 2008; 359: 2641–50. [DOI] [PMC free article] [PubMed] [Google Scholar]
- 13. Lin RJ, Lin YC, Chen J et al MicroRNA signature and expression of Dicer and Drosha can predict prognosis and delineate risk groups in neuroblastoma. Cancer Res 2010; 70: 7841–50. [DOI] [PMC free article] [PubMed] [Google Scholar]
- 14. Hill DA, Ivanovich J, Priest JR et al DICER1 mutations in familial pleuropulmonary blastoma. Science 2009; 325: 965. [DOI] [PMC free article] [PubMed] [Google Scholar]
- 15. Heravi‐Moussavi A, Anglesio MS, Cheng SW et al Recurrent somatic DICER1 mutations in nonepithelial ovarian cancers. N Engl J Med 2012; 366: 234–42. [DOI] [PubMed] [Google Scholar]
- 16. Melo SA, Moutinho C, Ropero S et al A genetic defect in exportin‐5 traps precursor microRNAs in the nucleus of cancer cells. Cancer Cell 2010; 18: 303–15. [DOI] [PubMed] [Google Scholar]
- 17. Sekine S, Ogawa R, Ito R et al Disruption of Dicer1 induces dysregulated fetal gene expression and promotes hepatocarcinogenesis. Gastroenterology 2009; 136: 2304–315. [DOI] [PMC free article] [PubMed] [Google Scholar]
- 18. Kumar MS, Lu J, Mercer KL, Golub TR, Jacks T. Impaired microRNA processing enhances cellular transformation and tumorigenesis. Nat Genet 2007; 39: 673–7. [DOI] [PubMed] [Google Scholar]
- 19. Yano H, Maruiwa M, Murakami T et al A new human pleomorphic hepatocellular carcinoma cell line, KYN‐2. Acta Pathol Jpn 1988; 38: 953–66. [DOI] [PubMed] [Google Scholar]
- 20. MacNab GM, Alexander JJ, Lecatsas G, Bey EM, Urbanowicz JM. Hepatitis B surface antigen produced by a human hepatoma cell line. Br J Cancer 1976; 34: 509–15. [DOI] [PMC free article] [PubMed] [Google Scholar]
- 21. Huh N, Utakoji T. Production of HBs‐antigen by two new human hepatoma cell lines and its enhancement by dexamethasone. Gann 1981; 72: 178–9. [PubMed] [Google Scholar]
- 22. Lin X, Asgari K, Putzi MJ et al Reversal of GSTP1 CpG island hypermethylation and reactivation of pi‐class glutathione S‐transferase (GSTP1) expression in human prostate cancer cells by treatment with procainamide. Cancer Res 2001; 61: 8611–16. [PubMed] [Google Scholar]
- 23. Wang Y, Lu Y, Toh ST et al Lethal‐7 is down‐regulated by the hepatitis B virus x protein and targets signal transducer and activator of transcription 3. J Hepatol 2010; 53: 57–66. [DOI] [PubMed] [Google Scholar]
- 24. Takagi H, Sasaki S, Suzuki H et al Frequent epigenetic inactivation of SFRP genes in hepatocellular carcinoma. J Gastroenterol 2008; 43: 378–89. [DOI] [PubMed] [Google Scholar]
- 25. Ohm JE, McGarvey KM, Yu X et al A stem cell‐like chromatin pattern may predispose tumor suppressor genes to DNA hypermethylation and heritable silencing. Nat Genet 2007; 39: 237–42. [DOI] [PMC free article] [PubMed] [Google Scholar]
- 26. Shen X, Liu Y, Hsu YJ et al EZH1 mediates methylation on histone H3 lysine 27 and complements EZH2 in maintaining stem cell identity and executing pluripotency. Mol Cell 2008; 32: 491–502. [DOI] [PMC free article] [PubMed] [Google Scholar]
- 27. Montgomery ND, Yee D, Chen A et al The murine polycomb group protein Eed is required for global histone H3 lysine‐27 methylation. Curr Biol 2005; 15: 942–7. [DOI] [PubMed] [Google Scholar]
- 28. Izzotti A, Calin GA, Arrigo P, Steele VE, Croce CM, De FS. Downregulation of microRNA expression in the lungs of rats exposed to cigarette smoke. FASEB J 2009; 23: 806–12. [DOI] [PMC free article] [PubMed] [Google Scholar]
- 29. Wei W, Ba Z, Gao M et al A role for small RNAs in DNA double‐strand break repair. Cell 2012; 149: 101–12. [DOI] [PubMed] [Google Scholar]
- 30. Francia S, Michelini F, Saxena A et al Site‐specific DICER and DROSHA RNA products control the DNA‐damage response. Nature 2012; 488: 231–5. [DOI] [PMC free article] [PubMed] [Google Scholar]
- 31. Karube Y, Tanaka H, Osada H et al Reduced expression of Dicer associated with poor prognosis in lung cancer patients. Cancer Sci 2005; 96: 111–15. [DOI] [PMC free article] [PubMed] [Google Scholar]
- 32. Martello G, Rosato A, Ferrari F et al A microRNA targeting dicer for metastasis control. Cell 2010; 141: 1195–207. [DOI] [PubMed] [Google Scholar]
- 33. Su X, Chakravarti D, Cho MS et al TAp63 suppresses metastasis through coordinate regulation of Dicer and miRNAs. Nature 2010; 467: 986–90. [DOI] [PMC free article] [PubMed] [Google Scholar]
- 34. Melo SA, Ropero S, Moutinho C et al A TARBP2 mutation in human cancer impairs microRNA processing and DICER1 function. Nat Genet 2009; 41: 365–70. [DOI] [PMC free article] [PubMed] [Google Scholar] [Retracted]
- 35. Cairo S, Wang Y, de Reyniès A et al Stem cell‐like micro‐RNA signature driven by Myc in aggressive liver cancer. Proc Natl Acad Sci U S A 2010; 107: 20471–6. [DOI] [PMC free article] [PubMed] [Google Scholar]
- 36. Sudo T, Utsunomiya T, Mimori K et al Clinicopathological significance of EZH2 mRNA expression in patients with hepatocellular carcinoma. Br J Cancer 2005; 92: 1754–8. [DOI] [PMC free article] [PubMed] [Google Scholar]
- 37. Wang C, Liu Z, Woo CW et al EZH2 Mediates epigenetic silencing of neuroblastoma suppressor genes CASZ1, CLU, RUNX3, and NGFR. Cancer Res 2012; 72: 315–24. [DOI] [PMC free article] [PubMed] [Google Scholar]
Associated Data
This section collects any data citations, data availability statements, or supplementary materials included in this article.
Supplementary Materials
Fig. S1. The biogenesis of miRNA in mammalian cells.
Fig. S2. The relative expressions of miRNA‐biogenesis‐related (miRBir) genes in hepatocellular carcinoma cell lines.
Fig. S3. The association between relative miRBir gene expression in hepatocellular carcinoma and etiological factors.
Fig. S4. The relationship between background liver histology and expression of miRNA biogenesis components in non‐cancerous liver.
Fig. S5. The relationship between intra‐liver metastasis and expression of the miRBir genes in non‐cancerous liver.
Fig. S6. Methylation status of CpG islands in the promoters of the three miRBir genes.
Fig. S7. Methylation specific PCR revealed intense CpG island methylation of the SFRP1 gene promoter in these cell lines.
Fig. S8. Positions of CpG island and ChIP‐PCR primer range in seven miRBir genes are presented.
Fig. S9. Decreased of let‐7a miRNA in HepG2 cell line and increased in KYN2 with EED siRNA knockdown.
Table S1. PCR primers.
Table S2. Pearson's correlation among the relative expression ratios (tumor versus non‐cancerous liver) of the seven miRBir genes.
Table S3. Statistical analysis between subgroups of patients' background (alcohol, tobacco and diabetes).
Table S4. Mutivriate logistic regression analysis for alcohol.