

Abstract
Control of liver metastasis is an important issue in the treatment of colorectal cancer (CRC). MicroRNAs have been shown to be involved in the development of many cancers, but little is known about their role in the process of colorectal liver metastasis. We compared miRNA expression between primary colorectal tumors and liver metastasis to identify those involved in the process of metastasis. Cancer cells were isolated from formalin‐fixed paraffin‐embedded primary CRC samples and their corresponding metastatic liver tumors in six patients using laser capture microdissection, and miRNA expression was analyzed using TaqMan miRNA arrays. The most abundant miRNA in liver metastasis compared with primary tumors was miR‐122. Immunohistochemical analysis revealed that the expression levels of cationic amino acid transporter 1 (CAT1), a negative target gene of miR‐122, were lower in liver metastases than primary tumors (P < 0.001). Expression levels of CAT1 in 132 primary tumors were negatively correlated with the existence of synchronous liver metastasis (P = 0.0333) and tumor stage (P < 0.0001). In an analysis of 121 colon cancer patients without synchronous liver metastasis, patients with CAT1‐low colon cancer had significantly shorter liver metastasis‐free survival (P = 0.0258) but not overall survival or disease‐free survival. Overexpression of miR‐122 and concomitant suppression of CAT1 in the primary tumor appears to play important roles in the development of colorectal liver metastasis. Expression of CAT1 in the primary CRC has the potential to be a novel biomarker to predict the risk of postoperative liver metastasis of CRC patients.
Colorectal cancer (CRC) is a major cause of cancer death worldwide. Compared to Western Europe and the USA, CRC is less common in Japan, however, the incidence rate is increasing and over 100 000 new cases arise per year.1 Liver metastasis, which is the most common site for metastatic spread of CRC, is observed in 20–25% of patients at initial diagnosis, and eventually develops after resection of the primary CRC in a further 40–50% of patients.2 Although the prognosis of patients with colorectal liver metastasis has been improved by recent advances in multidisciplinary treatments, liver metastasis is still one of the major determinants of survival.3 To control this metastatic disease, and thereby improve patient survival, the mechanisms of colorectal liver metastasis require elucidation.
Recently, it was reported that miRNAs are involved in cancer development. As small non‐coding single‐stranded lengths of RNA consisting of 21–25 nucleotides, miRNAs can associate with the RNA‐induced silencing complex (RISC).4 The miRNA–RISC complex binds to complementary sequences located mainly in the 3′‐UTR of target mRNAs and causes the translational repression or cleavage of these mRNA sequences.4, 5 This post‐transcriptional regulation of gene expression has been found in a wide variety of human cancers, and miRNAs are thought to play important roles by regulating the expression of various oncogenes and tumor suppressor genes.4, 5 Although a number of studies have shown that miRNAs are involved in human CRC development,6, 7, 8, 9 only a few have investigated the roles of miRNAs in the process of colorectal liver metastasis.10, 11, 12, 13
Most of the previous studies on miRNA expression profiling in cancer tissue have used fresh frozen (FF) samples, in which RNA is thought to be well preserved.14, 15 However, many studies have shown that stromal cells, including fibroblasts and inflammatory cells, are present in the vast majority of tumor tissues (up to 90%).16 Thus, microdissection methods are necessary to analyze gene expression in tumor cells without contamination by stromal cells.
In this study, we extracted total RNA from cancer cells isolated from formalin‐fixed paraffin‐embedded (FFPE) samples using laser capture microdissection (LCM). We compared miRNA expression between primary CRCs and their corresponding liver metastasis to identify miRNAs involved in colorectal liver metastasis and to detect novel molecular markers for prediction of the postoperative prognosis of CRC patients.
Materials and Methods
Patients and tumors
The FFPE specimens of primary CRCs and their corresponding metastatic liver tumors from six patients who underwent primary resection and hepatectomy at the Hamamatsu University Hospital (Hamamatsu, Japan) were used for miRNA array analysis. None of the patients had received any treatment prior to surgery. The FFPE tissues of 132 primary CRCs and 22 colorectal liver metastases were included for immunohistochemical investigation. One hundred and thirty‐two CRC patients had undergone surgery at Hamamatsu University School of Medicine (Hamamatsu, Japan) between January 2004 and December 2006, and 22 patients with liver metastasis had undergone hepatectomy between May 1996 and October 2007.
Laser capture microdissection
To extract RNA from FFPE samples, the paraffin blocks were cut into 16‐μm‐thick sections and placed onto Leica RNasefree PEN slides (Leica, Bannockburn, IL, USA). The FFPE slides were deparaffinized in xylene before hydration with a graded series of ethanol, then were lightly stained with 0.1% cresyl violet using an LCM staining kit (Ambion, Austin, TX, USA). Slides were then immediately microdissected. The LCM collection was carried out on the Leica LMD‐6000, and at least 30 mm2 of cancer cells was collected from each sample. The tissue was collected into Eppendorf caps containing 50 μL digestion buffer (from a RecoverAll kit; Applied Biosystems, Foster City, CA, USA) and total RNA was isolated from the microdissected tissue.
RNA extraction
Total RNA was extracted from the tissue with a RecoverAll kit (Applied Biosystems) or from cultured colon cancer cells with an Isogen kit (Wako, Osaka, Japan) according to the manufacturer's protocol. The quality and quantity of total RNA was assessed with a Nanodrop ND‐1000 spectrophotometer (Nanodrop Technologies, Wilmington, DE, USA).
MicroRNA array analysis
Thirty nanograms of miRNA was used as starting material for RT. The RT reaction was carried out using a miRNA RT kit with human miRNA Megaplex RT primers (Applied Biosystems). Prior to real‐time PCR, miRNA was subjected to preamplification in a Megaplex PreAmp reaction (Applied Biosystems) using one‐third of the miRNA RT products as starting material. Preamplified miRNA was then used for RT‐PCR in TaqMan Array Human MicroRNA version 3.0 (Applied Biosystems) consisting of 384 wells to measure 378 distinct miRNAs and housekeeping small nucleolar RNAs. The arrays were run on a 7900HT thermocycler (Applied Biosystems) according to the manufacturer's protocol. Quantitative RT‐PCR data were analyzed on an RQ Manager 1.2 and DataAssist version 2.0 software using standard procedures (Applied Biosystems). All miRNAs with C t values of >40 were included in the analysis as “undetected” and a C t value of 40 was assigned as a dummy number.17 Expression levels of individual miRNA were determined by the −ΔC t approach relative to the average C t value of three normalization controls (U6, RNU44, and RNU48). Expression changes of paired samples were determined by the ΔΔC t approach.
Immunohistochemical analysis
To determine protein expression levels, we carried out immunohistochemical staining on 4‐μm‐thick sections of FFPE tissues obtained from surgical specimens. Tumor sections were deparaffinized with successive xylene and ethanol treatments, as well as rehydration. Antigen retrieval was carried out by heating the samples at 125°C for 5 min in 10 mM sodium citrate (pH 6.0). Endogenous peroxidase was blocked by incubation in 3% hydrogen peroxide for 30 min. Sections were washed in PBS then incubated with rabbit polyclonal antibodies against human cationic amino acid transporter 1 (CAT1; 1:500 dilution; MBL, Nagoya, Japan) at 4°C overnight. Sections were incubated with peroxidase‐labeled polymer Histofine Simple Stain MAX PO (Nichirei, Tokyo, Japan) for 30 min. Staining signals were developed using 3,3′‐diaminobenzidine (Nichirei) and counterstained with hematoxylin for 1 min. Dehydration was carried out following a standard procedure. To rule out non‐specific immunoreactions, sections were incubated with secondary antibodies without primary antibodies. We measured the CAT1‐positive dimensions in five randomly selected ×200 magnification high power fields (HPF). Three pathologists with no knowledge of the clinical data evaluated CAT1 immunoreactivity independently. The staining intensity of CAT1 was scored as: 0, none; 1+, weak; 2+, moderate; or 3+, strong. When the staining intensity of CAT1 was heterogeneous, the staining level was defined according to the lowest score in five random HPF (×200 magnification).
Statistical analysis
Correlation between CAT1 expression and risk grade was analyzed by the Mann–Whitney U‐test and Kruskal–Wallis test, and P‐values of <0.05 were considered statistically significant. Patients' disease‐free survival (DFS) rates, overall survival rate (OS), and liver metastasis‐free survival (LMFS) rates were calculated using the Kaplan–Meier method, and statistically significant differences in DFS, OS and LMFS were identified using the log–rank test. Further information can be found in Document S1.
Results
MicroRNA array analysis of primary CRCs and colorectal liver metastases
To identify up‐ and downregulated miRNAs in colorectal liver metastasis, miRNA array analyses were carried out using extracts from six primary CRCs and their corresponding liver metastases, which consisted of three synchronous and three metachronous metastases. Patient profiles are shown in Table 1. Of 378 miRNAs analyzed, the top 20 miRNAs with the highest and lowest expressions in liver metastasis compared with primary tumors are shown in Table 2. Because the variation of the numerical value was large in clinical samples, and only a few miRNAs significantly differed between primary and metastatic tumors, we valued the gross fold‐change of each miRNA rather than its P‐value. Among them, miR‐122 was the most upregulated in liver metastasis compared with primary tumors. In addition, miR‐122 was highly expressed in five of six metastatic liver tumors, but was undetectable in any of the primary tumors. Of note, miR‐122 was most upregulated in liver metastasis, even when analyzed in a cohort of just three patients with metachronous metastases (Table S1). These data suggest that upregulation of miR‐122 may be involved in colorectal liver metastasis.
Table 1.
Clinicopathological data of six colorectal cancer patients with synchronous or metachronous liver metastasis used in microRNA arrays
| Case no. | 1 | 2 | 3 | 4 | 5 | 6 |
| Age, years (at primary surgery) | 62 | 66 | 66 | 58 | 81 | 52 |
| Sex | M | M | F | M | M | M |
| Location | S | D | T | S | S | RS |
| Depth | MP | SS | SE | SS | SS | SE |
| Histological type | tub1 | tub2 | tub2 | tub1 | tub1 | tub2 |
| Lymph node metastasis | − | + | + | − | + | + |
| Liver metastasis | Metachronous | Synchronous | Synchronous | Metachronous | Metachronous | Synchronous |
| Time to liver surgery (months) | 8 | 2 | 2 | 12 | 24 | 2 |
+, With; −, without; D, descending colon; F, female; M, male; MP, muscularis propria; RS, rectosigmoid; S, sigmoid colon; SE, serosa exposed; SS, subserosa; T, transverse colon; tub1, well differentiated adenocarcinoma; tub2, moderately differentiated adenocarcinoma.
Table 2.
Top 20 miRNAs upregulated and downregulated in liver metastasis compared with primary colorectal tumors as assessed by miRNA arrays
| Upregulated | Downregulated | ||||
|---|---|---|---|---|---|
| MicroRNA | Fold change | P‐value | MicroRNA | Fold change | P‐value |
| miR‐122 | 1470.1004 | 0.1130 | miR‐296‐3p | 0.0188 | 0.3390 |
| miR‐885‐5p | 42.3151 | 0.0822 | miR‐302c | 0.0236 | 0.1893 |
| miR‐873 | 22.3945 | 0.1839 | miR‐198 | 0.0397 | 0.0867 |
| miR‐205 | 15.9376 | 0.3642 | miR‐369‐3p | 0.0401 | 0.3598 |
| miR‐376b | 12.9373 | 0.3671 | miR‐517b | 0.0634 | 0.3618 |
| miR‐146b‐3p | 10.8580 | 0.0990 | miR‐517c | 0.1148 | 0.0989 |
| miR‐548c‐3p | 9.3014 | 0.1136 | miR‐33b | 0.1219 | 0.3591 |
| miR‐653 | 7.9828 | 0.3940 | miR‐516b | 0.1399 | 0.3508 |
| miR‐512‐3p | 7.3594 | 0.0904 | miR‐184 | 0.1456 | 0.3295 |
| miR‐493 | 7.0727 | 0.0713 | miR‐383 | 0.2067 | 0.4084 |
| miR‐18b | 6.5848 | 0.4117 | miR‐499‐3p | 0.2148 | 0.3815 |
| miR‐329 | 6.0669 | 0.2116 | miR‐488 | 0.2447 | 0.3394 |
| miR‐522 | 5.3881 | 0.3861 | miR‐570 | 0.2950 | 0.3310 |
| miR‐153 | 5.0367 | 0.2255 | miR‐708 | 0.3008 | 0.0453a |
| miR‐503 | 4.8810 | 0.3109 | miR‐519e | 0.3101 | 0.3311 |
| miR‐520a‐3p | 4.0945 | 0.3827 | miR‐217 | 0.3148 | 0.3305 |
| miR‐139‐5p | 4.0534 | 0.0451a | miR‐582‐3p | 0.3279 | 0.4850 |
| miR‐451 | 4.0196 | 0.1224 | miR‐302b | 0.3412 | 0.5418 |
| miR‐337‐5p | 3.4444 | 0.3371 | miR‐515‐5p | 0.3608 | 0.3193 |
| miR‐542‐3p | 3.3629 | 0.3821 | miR‐96 | 0.3848 | 0.3061 |
P < 0.05.
Immunohistochemical analysis of primary CRCs and colorectal liver metastases
As it is difficult to analyze miRNA expression in a large number of CRC specimens using microdissection, we decided to further focus on a target gene of miR‐122 instead of a specific miRNA. Known as a liver‐specific miRNA, miR‐122 is reported as the most frequently isolated miRNA in the adult liver, consisting of approximately 70% of all cloned miRNAs.18, 19, 20 In contrast, the cationic amino acid transporter CAT1, a negative target gene of miR‐122, is ubiquitously expressed in many organs apart from the adult liver.21
Cationic amino acid transporter 1 protein was stained immunohistochemically in six primary colorectal cancers and their corresponding colorectal liver metastases. In each case, immunoreactivity of CAT1 was lower in the liver metastasis than its corresponding primary tumor, suggesting consistent suppression of this miR‐122 target gene (Fig. 1). Next, we immunohistochemically analyzed the expression levels of CAT1 protein in 132 primary colorectal cancers and 22 liver metastases. Expression levels of CAT1 were evaluated in five random HPF (×200 magnification) and classified into four groups as: 0, none; 1+, weak; 2+, moderate; or 3+, strong (Fig. 2a). The expression levels of CAT1 protein were significantly lower in liver metastases than in primary tumors (P < 0.0001, Fig. 2b). These data suggest that overexpressed miR‐122 in cancer cells may negatively affect the expression of CAT1 protein in the process of colorectal liver metastasis.
Figure 1.
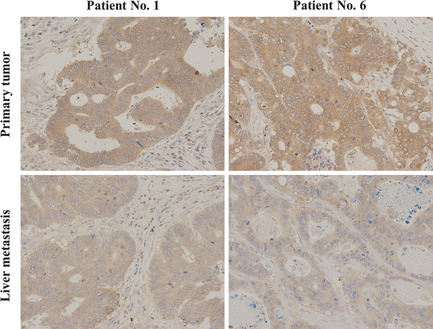
Representative immunohistochemical staining for cationic amino acid transporter 1 (CAT1) in primary colorectal cancers and corresponding liver metastases of Patients no. 1 and 6. Immunoreactivity of cationic amino acid transporter 1 was lower in the metastatic tumor than the primary tumor in each case.
Figure 2.
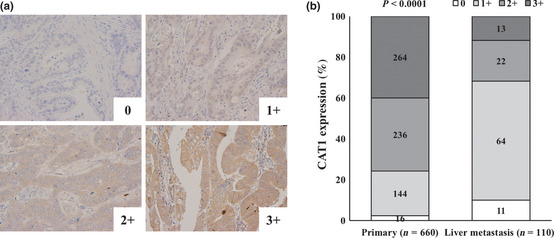
Immunohistochemistry for cationic amino acid transporter 1 (CAT1) in 132 primary colorectal cancers and 22 liver metastases. (a) Representative immunohistochemical staining for CAT1. Expression levels of CAT1 were classified into four groups: 0, none; 1+, weak; 2+, moderate; and 3+, strong. (b) Distribution of CAT1 staining intensity in primary tumors and colorectal liver metastases. Expression levels of CAT1 were evaluated in five random high power fields in 132 primary colorectal cancers and 22 liver metastases. Magnification, ×200. Levels of CAT1 protein were significantly lower in liver metastasis than primary tumors (P < 0.0001).
Expression of miR‐122 and CAT1 in normal mucosae, primary CRCs, and colorectal liver metastases
MicroRNA array and immunohistochemical analysis revealed that expression levels of mi‐122 and CAT1 protein were higher and lower, respectively, in colorectal liver metastases compared with their primary CRCs. We next compared the expression levels of miR‐122 in normal colon mucosae, primary CRCs, and colorectal liver metastases of the same six patients by quantitative RT‐PCR (qRT‐PCR). As shown in Figure S1, miR‐122 was highly expressed in all cases of colorectal liver metastases examined except for one patient, but it was undetectable in primary CRCs or normal mucosae of any patient. These findings suggest that miR‐122 in colon cancer cells could be upregulated in the process of liver metastasis rather than during carcinogenesis.
We next examined the correlation between the expression levels of miR‐122 and CAT1 protein in colorectal liver metastases. Six colorectal liver metastases were classified into two groups according to high and low CAT1 intensities, and expression levels of miR‐122 were compared. As shown in Figure S2, CAT1‐low tumors expressed significantly higher levels of miR‐122 (P = 0.0492), suggesting negative correlation between miR‐122 expression and CAT1 protein levels in metastatic liver tumors.
To further elucidate the negative correlation between miR‐122 and CAT1, their expression levels in colon cancer cell lines were analyzed by qRT‐PCR. Consistent with the absence of miR‐122 in clinical primary CRCs, none of three colon cancer cell lines, DLD‐1, SW480, and HCT116, expressed detectable miR‐122 (Fig. S3). In contrast, CAT1 mRNA was efficiently detected by qRT‐PCR in all three cell lines (Fig. S3). These data support the low expression levels of miR‐122 in primary CRCs and the negative correlation between miR‐122 and CAT1 levels observed in the clinical samples.
Correlation between CAT1 expression in primary CRCs and clinicopathological features
Lower expression of CAT1 protein in the process of colorectal liver metastasis may occur not only in the primary tumor but also may be acquired under the influence of the tumor microenvironment in the liver. To address the effect of CAT1 expression in tumor cells at the primary site, correlation between CAT1 expression in 132 primary tumors and their clinicopathological features was analyzed. We classified the staining intensity of CAT1 in primary CRCs into four groups: 0, none (n = 12); 1+, weak; (n = 59); 2+, moderate (n = 39); and 3+, strong (n = 22). Immunohistochemical analysis revealed that the expression level of CAT1 protein in the primary tumors was negatively associated with the existence of synchronous liver metastasis (P = 0.0333) and tumor stage (P < 0.0001; Table 3). These data suggest that loss of CAT1 protein in primary tumors may be involved in the formation of liver metastasis and thus correlated with tumor stage.
Table 3.
Relationship between clinicopathological factors and cationic amino acid transporter 1 (CAT1) expression levels in 132 patients with primary colorectal cancer
| Patient characteristics | CAT1 | P‐value | |||
|---|---|---|---|---|---|
| 0 | 1+ | 2+ | 3+ | ||
| Age (years) | |||||
| ≤67 | 8 | 28 | 20 | 10 | 0.5409 |
| >67 | 4 | 31 | 19 | 12 | |
| Sex | |||||
| Male | 7 | 36 | 22 | 13 | 0.8128 |
| Female | 5 | 23 | 17 | 9 | |
| Lesion | |||||
| C‐T | 3 | 18 | 12 | 7 | 0.9326 |
| D‐S | 6 | 20 | 14 | 8 | |
| Rectum | 3 | 21 | 13 | 7 | |
| Differentiation | |||||
| tub1 | 6 | 40 | 21 | 15 | 0.9926 |
| tub2 | 4 | 18 | 17 | 5 | |
| muc, por | 2 | 1 | 1 | 2 | |
| Depth | |||||
| SM | 0 | 2 | 1 | 1 | 0.6293 |
| MP | 3 | 12 | 5 | 4 | |
| SS, A1 | 4 | 30 | 27 | 11 | |
| SE, A2 | 5 | 11 | 5 | 5 | |
| SI | 0 | 4 | 1 | 1 | |
| Lymph node metastasis | |||||
| − | 6 | 33 | 21 | 12 | 0.9767 |
| + | 6 | 26 | 18 | 10 | |
| Liver metastasis | |||||
| − | 10 | 52 | 37 | 22 | 0.0333* |
| + | 2 | 7 | 2 | 0 | |
| Ly | |||||
| − | 5 | 21 | 9 | 5 | 0.0921 |
| + | 7 | 38 | 30 | 17 | |
| V | |||||
| − | 3 | 29 | 16 | 13 | 0.2920 |
| + | 9 | 30 | 23 | 9 | |
| Stage | |||||
| I | 3 | 11 | 4 | 4 | <0.0001** |
| II | 3 | 19 | 17 | 8 | |
| III | 4 | 19 | 16 | 10 | |
| IV | 2 | 10 | 2 | 0 | |
*P < 0.05; **P < 0.0001. Cationic amino acid transporter 1 expression was scored as: 0, none; 1+, weak; 2+, moderate; or 3+, strong. +, With; −, without; A1, subadventitia; A2, adventitia; C‐T, cecum to transverse colon; D‐S, descending colon to sigmoid colon; Ly, lymphatic invasion; MP, muscularis propria; muc, mucinous adenocarcinoma; por, poorly differentiated adenocarcinoma; SE, serosa exposed; SI, serosa infiltrating; SM, submucosa; SS, subserosa; tub1, well diffentiated adenocarcinoma; tub 2, moderately differentiated adenocarcinoma; V, venous invasion.
Expression of CAT1 in primary CRC and LMFS
To address whether loss of CAT1 protein in the primary tumor affects the postoperative prognosis of CRC patients, we analyzed the correlation between the levels of CAT1 staining in the primary CRCs of 121 patients without synchronous liver metastasis and their prognosis after surgery. We classified the staining intensity of CAT1 into three groups: 0 (n = 10); 1+ or 2+ (n = 89); and 3+ (n = 22). Whereas neither DFS nor OS was significantly associated with CAT1 expression, patients with CAT1‐low CRC had significantly shorter LMFS after surgery (P = 0.0258; Fig. 3). Of note, none of the patients with strong CAT1 expression in the primary tumor had recurrence in the liver. Analysis of 46 patients who had received adjuvant chemotherapy after surgery for stage II or III CRC revealed a correlation between a low CAT1 expression and a shorter LMFS, although this trend was not statistically significant (P = 0.1587; Fig. S4).
Figure 3.
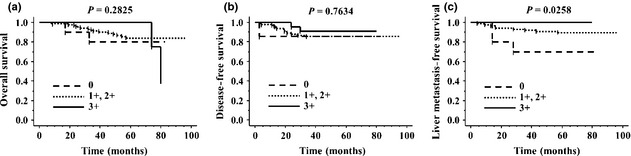
Survival probability of 121 colorectal cancer (CRC) patients without synchronous liver metastasis. We classified 121 primary CRC into three groups according to the staining intensity of cationic amino acid transporter 1 (CAT1): 0 (n = 10); 1+ and 2+ (n = 89); or 3+ (n = 22). (a) Overall survival by CAT1 positivity in primary CRC. (b) Disease‐free survival by CAT1 positivity in primary CRC. (c) Liver metastasis‐free survival by CAT1 positivity in primary CRC. Patients with CAT1‐low CRC had significantly shorter liver metastasis‐free survival (P = 0.0258).
To clarify the risk factors of metachronous colorectal liver metastasis after primary resection, the relationships between the clinicopathological features and LMFS were evaluated using univariate analysis. The 5‐year LMFS rate was negatively correlated with the existence of lymph node metastasis, consistent with a previous report,22 and was positively correlated with the expression levels of CAT1 protein in the primary tumors (Table 4). These findings suggest that loss of CAT1 protein expression in primary tumors may play important roles in the process of colorectal liver metastasis and thereby affect the incidence of liver metastasis after surgery.
Table 4.
Relationship between clinicopathological factors and postoperative liver metastasis‐free survival (LMFS) in 121 patients with primary colorectal cancer
| Factor | n | 5‐year LMFS rate (%) | P‐value |
|---|---|---|---|
| Age (years) | |||
| ≤67 | 59 | 87.9 | 0.4626 |
| >67 | 62 | 91.4 | |
| Sex | |||
| Male | 72 | 90.9 | 0.4622 |
| Female | 49 | 87.7 | |
| Lesion | |||
| C‐T | 35 | 97.0 | 0.1968 |
| D‐S | 46 | 89.0 | |
| Rectum | 40 | 83.6 | |
| Differentiation | |||
| tub1 | 36 | 79.3 | 0.0508 |
| tub2 | 79 | 94.8 | |
| muc, por | 6 | 83.3 | |
| Depth | |||
| SM, MP | 28 | 100.0 | 0.0522 |
| SS, A1 | 66 | 88.9 | |
| SE, SI, A2 | 27 | 79.4 | |
| Lymph node metastasis | |||
| − | 70 | 95.7 | 0.0134a |
| + | 51 | 81.0 | |
| Ly | |||
| − | 39 | 94.8 | 0.2178 |
| + | 82 | 87.1 | |
| V | |||
| − | 60 | 93.3 | 0.2106 |
| + | 61 | 85.8 | |
| Stage | |||
| I | 22 | 100.0 | 0.0635 |
| II | 47 | 93.6 | |
| III | 48 | 82.4 | |
| IV | 4 | 50.0 | |
| CAT1 | |||
| 0 | 10 | 70.0 | 0.0258a |
| 1+, 2+ | 89 | 89.3 | |
| 3+ | 22 | 100.0 | |
P < 0.05. Cationic amino acid transporter 1 (CAT1) expression was scored as: 0, none; 1+, weak; 2+, moderate; or 3+, strong. +, With; −, without; A1, subadventitia; A2, adventitia; C‐T, cecum to transverse colon; D‐S, descending colon to sigmoid colon; Ly, lymphatic invasion; MP, muscularis propria; muc, mucinous adenocarcinoma; por, poorly differentiated adenocarcinoma; SE, serosa exposed; SI, serosa infiltrating; SM, submucosa; SS, subserosa; tub1, well diffentiated adenocarcinoma; tub 2, moderately differentiated adenocarcinoma; V, venous invasion.
Discussion
The control of liver metastasis is an important issue in the treatment of CRC. Although hepatectomy is still a powerful tool in the treatment of colorectal liver metastasis, most patients are treated with preoperative chemotherapy with or without molecular‐targeting therapy. Therefore, it is becoming more difficult to prospectively collect clinical samples of colorectal liver metastases without the effect of preoperative chemotherapy. To compare miRNA expression between primary and metastatic liver tumors in the same patient, FFPE samples, which enable us to retrospectively analyze molecular events with clinical data, have attracted researchers in this era of multidisciplinary treatment. The isolation of mRNA from FFPE material has been thought to be less effective, because formalin fixation causes cross‐links between RNA molecules and proteins23 and results in isolation of degraded RNA fragments during recovery. In addition, formalin causes chemical modifications that result in low efficiency of qPCRs.24 In contrast, extraction of miRNA from FFPE samples is possible, because miRNA is relatively stable because of its small size compared with mRNA, even during fixation and isolation processes. A recent study reported that the efficiency of miRNA detection did not differ between FFPE and FF samples.25, 26 This fact was one of the reasons we focused on the alteration of miRNA, but not that of mRNA, in the present study.
In many of the previous studies regarding gene expression changes or alterations of miRNA in cancer development, total RNAs were extracted from FF or FFPE samples without the use of microdissection methods.14, 15 In such analyses using whole tissues, the results are thought to be affected by the effects of contaminating stromal cells. Moreover, it would be meaningless to compare miRNA levels between primary tumor and liver metastasis without microdissection methods, because the contents of tumor‐surrounding tissues are completely different between the two sites. Thus, in this study, we used microdissection to obtain tumor cells from FFPE samples without contamination by stromal cells or any other components of the tumor‐surrounding tissues. However, alteration of miRNAs in pure cancer cells isolated using microdissection could also be affected by tumor stromal cells or other aspects of the tumor microenvironment, because tumor stromal cells have been reported to play important roles in the development of primary tumors as well as metastatic spread.27 To address the pure effect of miRNA expression on tumor development or formation of liver metastasis, further in vivo experiments may therefore be needed. Furthermore, it would be interesting to analyze miRNA expression in the stromal cells of CRC specimens and their metastatic lesions.
The relationship between colorectal liver metastasis and miRNA has been reported. Chen et al.10 reported that high expression of miR‐103 and miR‐107 was associated with the liver metastasis potential of CRC cell lines and poor prognosis in patients with CRC. Hur et al.11 showed that miR‐200c plays an important role in mediating epithelial–mesenchymal transition and metastatic behavior from CRC to liver. In addition, it was reported in the analysis of clinical samples using quantitative real‐time RT‐PCR that miR‐21, ‐22, and ‐143 participate in colorectal liver metastasis.12, 13 Although other studies carried out miRNA array analyses to address the mechanisms of colorectal liver metastasis, FF clinical samples were used without microdissection.14, 15 To date, the role of miR‐122 in regulating colorectal liver metastasis has not been revealed. In the present study, we screened alterations of miRNA by comparing expression levels between six primary CRCs and their corresponding liver metastases, and found that miR‐122 was the most highly expressed in metastatic liver tumors compared with primary tumors. Although the effect of loss of CAT1 protein in primary tumors on LMFS was shown in this study, the direct role of miR‐122 in the development of colorectal liver metastasis remains to be clarified by analyzing miR‐122 expression in a large number of clinical samples or otherwise by future in vivo experiments.
There is still no report showing that CAT1 participates in metastasis, and there are only a few reports about the role of CAT1 in cancer.28 In the present study, mechanisms by which loss of CAT1 in the primary tumor is involved in the development of colorectal liver metastasis have not yet been identified. Cationic amino acid transporter 1 is known as a constructive cell transporter that facilitates uptake of l‐arginine, which is a precursor of nitric oxide (NO), and plays an important role in NO production.29 The roles of NO in the development of cancers have been recently reported.30, 31 Although further investigations are required, alteration of NO in cancer tissue following the loss of CAT1 expression might be involved in the process of metastasis. Because CAT1 plays important roles in supplying cells with extracellular arginine, lysine, and ornithine,21, 28, 32 it may function in multiple events in the formation of colorectal liver metastasis.
In liver cancer, miR‐122 is known as a tumor suppressor miRNA, and it has been reported that loss of miR‐122 expression correlates with gain of metastasis properties, which may be because miR‐122 downregulation suppresses the hepatic phenotype.33 In our study, miR‐122 was more abundant in metastatic tumors than primary tumors. This contradiction might be explained by the seed and soil theory proposed by Paget.34 One plausible explanation is that in the formation of colorectal liver metastasis, cancer cells seek to adapt to a new environment by expressing miR‐122, a liver‐specific miRNA, whereas liver cancer cells prepare to metastasize out of liver by losing miR‐122. Moreover, the roles of miR‐122 in the development of cancers may depend on the primary site. MicroRNA‐122 is required for hepatitis C virus replication and mediates this regulation by a direct interaction with binding sites in the 5′‐UTR of hepatitis C virus RNA.35 Recently, a clinical trial targeting miR‐122 with miravirsen (Santaris Pharma, San Diego, CA, USA) was initiated for the treatment of hepatitis C.36 MicroRNA‐122 could be a novel therapeutic target to prevent postoperative liver metastasis in patients with CRC.
In the analysis of CAT1 expression in 121 primary CRCs with patient prognosis, patients with CAT1‐low CRC had significantly shorter LMFS, but neither DFS nor OS was significantly associated with CAT1 expression. These findings suggest that CAT1, which is known to be absent in the adult liver, might be involved specifically in the development of liver metastasis. However, postoperative chemotherapy could affect patient prognosis including LMFS. In the analysis of 46 patients who had received adjuvant chemotherapy after surgery for stage II or III CRC, there was a trend toward a correlation between a low CAT1 expression and a shorter LMFS. Although this trend was not statistically significant, perhaps due to the small number of patients, it seems still important that none of this cohort of patients with strong CAT1 expression in the primary tumor had recurrence in the liver.
In this study, it was shown that miR‐122 was elevated in the metastatic tumors compared with the primary site, and concomitant suppression of CAT1 was observed in the metastatic sites as well as in the primary tumors of patients with shorter LMFS. These findings suggest that loss of CAT1 expression appears to occur at the primary site early in the process of liver metastasis, at least in part, in a miR‐122‐dependent manner, leading to the formation of colorectal liver metastasis. Here we propose a model of colorectal liver metastasis through alteration of miRNA. First, miR‐122 high‐clones arise in primary tumors and lose CAT1 expression. Next, cancer cells travel to the liver with acquired malignant potential as a result of multiple events, regardless of miR‐122 or CAT1 expression levels. Finally, cancer cells with high miR‐122 and low CAT1 expression selectively survive in the liver by adapting to the microenvironment of the metastatic site to form liver metastasis.
In conclusion, this study provides important clues for the resolution of the mechanisms of colorectal liver metastasis. Overexpression of miR‐122 and concomitant suppression of CAT1 in primary tumors appears to play important roles in the development of colorectal liver metastasis. Expression of CAT1 in primary CRC has the potential to be a novel biomarker with which to predict the risk of postoperative liver metastasis in patients with CRC.
Disclosure Statement
The authors have no conflicts of interest.
Supporting information
Fig. S1. Expression levels of miR‐122 in normal colon mucosae, primary colorectal cancers, and colorectal liver metastases of the same six patients by quantitative RT‐PCR.
Fig. S2. Correlation between the expression levels of miR‐122 and cationic amino acid transporter 1 (CAT1) protein in six colorectal liver metastases.
Fig. S3. Expression levels of cationic amino acid transporter 1 (CAT1) and miR‐122 by quantitative RT‐PCR in colorectal adenocarcinoma cell lines DLD‐1, SW480, and HCT116.
Fig. S4. Liver metastasis‐free survival by cationic amino acid transporter 1 (CAT1) positivity in 46 primary colorectal cancers of patients who received adjuvant chemotherapy after surgery for stage II or III colorectal cancer.
Doc. S1. Materials and methods.
Table S1. Top 20 miRNAs up‐ and downregulated in metachronous liver metastasis compared with primary tumors as assessed by microRNA arrays.
Acknowledgments
This work was supported in part by the Ministry of Education, Culture, Sports, Science, and Technology of Japan grants‐in‐aid 22791270 (H. Kikuchi), 20670004 (M. Setou), and 21390376 (H. Konno), and Development of System and Technology for Advanced Measurement and Analysis (M. Setou).
(Cancer Sci 2013; 104: 624–630)
References
- 1. Cancer statistics in Japan, 2010. [Cited 28 Jul 2012.] Available from URL: http://www.fpcr.or.jp/publication/statistics.html.
- 2. Garden OJ, Rees M, Poston GJ et al Guidelines for resection of colorectal cancer liver metastases. Gut 2006; 55(Suppl 3): iii1–8. [DOI] [PMC free article] [PubMed] [Google Scholar]
- 3. Gallagher DJ, Kemeny N. Metastatic colorectal cancer: from improved survival to potential cure. Oncology 2010; 78: 237–48. [DOI] [PubMed] [Google Scholar]
- 4. Lee YS, Dutta A. MicroRNAs in cancer. Annu Rev Pathol 2009; 4: 199–227. [DOI] [PMC free article] [PubMed] [Google Scholar]
- 5. Caldas C, Brenton JD. Sizing up miRNAs as cancer genes. Nat Med 2005; 11: 712–4. [DOI] [PubMed] [Google Scholar]
- 6. Bommer GT, Gerin I, Feng Y et al p53‐mediated activation of miRNA34 candidate tumor‐suppressor genes. Curr Biol 2007; 17: 1298–307. [DOI] [PubMed] [Google Scholar]
- 7. Chen X, Guo X, Zhang H et al Role of miR‐143 targeting KRAS in colorectal tumorigenesis. Oncogene 2009; 28: 1385–92. [DOI] [PubMed] [Google Scholar]
- 8. Nagel R, le Sage C, Diosdado B et al Regulation of the adenomatous polyposis coli gene by the miR‐135 family in colorectal cancer. Cancer Res 2008; 68: 5795–802. [DOI] [PubMed] [Google Scholar]
- 9. Yamakuchi M, Ferlito M, Lowenstein CJ. miR‐34a repression of SIRT1 regulates apoptosis. Proc Natl Acad Sci USA 2008; 105: 13421–6. [DOI] [PMC free article] [PubMed] [Google Scholar]
- 10. Chen HY, Lin YM, Chung HC et al miR‐103/107 promote metastasis of colorectal cancer by targeting the metastasis suppressors DAPK and KLF4. Cancer Res 2012; 72: 3631–41. [DOI] [PubMed] [Google Scholar]
- 11. Hur K, Toiyama Y, Takahashi M et al MicroRNA‐200c modulates epithelial‐to‐mesenchymal transition (EMT) in human colorectal cancer metastasis. Gut 2012; doi: 10.1136/gutjnl-2011-301846. [DOI] [PMC free article] [PubMed] [Google Scholar]
- 12. Kulda V, Pesta M, Topolcan O et al Relevance of miR‐21 and miR‐143 expression in tissue samples of colorectal carcinoma and its liver metastases. Cancer Genet Cytogenet 2010; 200: 154–60. [DOI] [PubMed] [Google Scholar]
- 13. Zhang G, Xia S, Tian H, Liu Z, Zhou T. Clinical significance of miR‐22 expression in patients with colorectal cancer. Med Oncol 2012; 29: 3108–12. [DOI] [PubMed] [Google Scholar]
- 14. Lin M, Chen W, Huang J et al MicroRNA expression profiles in human colorectal cancers with liver metastases. Oncol Rep 2011; 25: 739–47. [DOI] [PubMed] [Google Scholar]
- 15. Zhang Y, He X, Liu Y et al microRNA‐320a inhibits tumor invasion by targeting neuropilin 1 and is associated with liver metastasis in colorectal cancer. Oncol Rep 2012; 27: 685–94. [DOI] [PubMed] [Google Scholar]
- 16. Dvorak HF. Tumors: wounds that do not heal. Similarities between tumor stroma generation and wound healing. N Engl J Med 1986; 315: 1650–9. [DOI] [PubMed] [Google Scholar]
- 17. Flamant S, Ritchie W, Guilhot J et al Micro‐RNA response to imatinib mesylate in patients with chronic myeloid leukemia. Haematologica 2010; 95: 1325–33. [DOI] [PMC free article] [PubMed] [Google Scholar]
- 18. Chang J, Nicolas E, Marks D et al miR‐122, a mammalian liver‐specific microRNA, is processed from hcr mRNA and may downregulate the high affinity cationic amino acid transporter CAT‐1. RNA Biol 2004; 1: 106–13. [DOI] [PubMed] [Google Scholar]
- 19. Girard M, Jacquemin E, Munnich A, Lyonnet S, Henrion‐Caude A. miR‐122, a paradigm for the role of microRNAs in the liver. J Hepatol 2008; 48: 648–56. [DOI] [PubMed] [Google Scholar]
- 20. Jopling C. Liver‐specific microRNA‐122: biogenesis and function. RNA Biol 2012; 9: 137–42. [DOI] [PMC free article] [PubMed] [Google Scholar]
- 21. Ito K, Groudine M. A new member of the cationic amino acid transporter family is preferentially expressed in adult mouse brain. J Biol Chem 1997; 272: 26780–6. [DOI] [PubMed] [Google Scholar]
- 22. Chuang SC, Su YC, Lu CY et al Risk factors for the development of metachronous liver metastasis in colorectal cancer patients after curative resection. World J Surg 2011; 35: 424–9. [DOI] [PubMed] [Google Scholar]
- 23. Li J, Smyth P, Flavin R et al Comparison of miRNA expression patterns using total RNA extracted from matched samples of formalin‐fixed paraffin‐embedded (FFPE) cells and snap frozen cells. BMC Biotechnol 2007; 7: 36. [DOI] [PMC free article] [PubMed] [Google Scholar]
- 24. Masuda N, Ohnishi T, Kawamoto S, Monden M, Okubo K. Analysis of chemical modification of RNA from formalin‐fixed samples and optimization of molecular biology applications for such samples. Nucleic Acids Res 1999; 27: 4436–43. [DOI] [PMC free article] [PubMed] [Google Scholar]
- 25. Szafranska AE, Davison TS, Shingara J et al Accurate molecular characterization of formalin‐fixed, paraffin‐embedded tissues by microRNA expression profiling. J Mol Diagn 2008; 10: 415–23. [DOI] [PMC free article] [PubMed] [Google Scholar]
- 26. Xi Y, Nakajima G, Gavin E et al Systematic analysis of microRNA expression of RNA extracted from fresh frozen and formalin‐fixed paraffin‐embedded samples. RNA 2007; 13: 1668–74. [DOI] [PMC free article] [PubMed] [Google Scholar]
- 27. Kalluri R, Zeisberg M. Fibroblasts in cancer. Nat Rev Cancer 2006; 6: 392–401. [DOI] [PubMed] [Google Scholar]
- 28. Rotmann A, Strand D, Martine U, Closs EI. Protein kinase C activation promotes the internalization of the human cationic amino acid transporter hCAT‐1. A new regulatory mechanism for hCAT‐1 activity. J Biol Chem 2004; 279: 54185–92. [DOI] [PubMed] [Google Scholar]
- 29. Ookawauchi K, Saibara T, Yoshikawa T et al Characterization of cationic amino acid transporter and its gene expression in rat hepatic stellate cells in relation to nitric oxide production. J Hepatol 1998; 29: 923–32. [DOI] [PubMed] [Google Scholar]
- 30. Radomski MW, Jenkins DC, Holmes L, Moncada S. Human colorectal adenocarcinoma cells: differential nitric oxide synthesis determines their ability to aggregate platelets. Cancer Res 1991; 51: 6073–8. [PubMed] [Google Scholar]
- 31. Decker NK, Abdelmoneim SS, Yaqoob U et al Nitric oxide regulates tumor cell cross‐talk with stromal cells in the tumor microenvironment of the liver. Am J Pathol 2008; 173: 1002–12. [DOI] [PMC free article] [PubMed] [Google Scholar]
- 32. Closs EI, Boissel JP, Habermeier A, Rotmann A. Structure and function of cationic amino acid transporters (CATs). J Membr Biol 2006; 213: 67–77. [DOI] [PubMed] [Google Scholar]
- 33. Coulouarn C, Factor VM, Andersen JB, Durkin ME, Thorgeirsson SS. Loss of miR‐122 expression in liver cancer correlates with suppression of the hepatic phenotype and gain of metastatic properties. Oncogene 2009; 28: 3526–36. [DOI] [PMC free article] [PubMed] [Google Scholar]
- 34. Paget S. The distribution of secondary growths in cancer of the breast. Lancet 1889; 133: 571–3. [PubMed] [Google Scholar]
- 35. Jopling CL, Yi M, Lancaster AM, Lemon SM, Sarnow P. Modulation of hepatitis C virus RNA abundance by a liver‐specific microRNA. Science 2005; 309: 1577–81. [DOI] [PubMed] [Google Scholar]
- 36. Hu J, Xu Y, Hao J, Wang S, Li C, Meng S. MiR‐122 in hepatic function and liver diseases. Protein Cell 2012; 3: 364–71. [DOI] [PMC free article] [PubMed] [Google Scholar]
Associated Data
This section collects any data citations, data availability statements, or supplementary materials included in this article.
Supplementary Materials
Fig. S1. Expression levels of miR‐122 in normal colon mucosae, primary colorectal cancers, and colorectal liver metastases of the same six patients by quantitative RT‐PCR.
Fig. S2. Correlation between the expression levels of miR‐122 and cationic amino acid transporter 1 (CAT1) protein in six colorectal liver metastases.
Fig. S3. Expression levels of cationic amino acid transporter 1 (CAT1) and miR‐122 by quantitative RT‐PCR in colorectal adenocarcinoma cell lines DLD‐1, SW480, and HCT116.
Fig. S4. Liver metastasis‐free survival by cationic amino acid transporter 1 (CAT1) positivity in 46 primary colorectal cancers of patients who received adjuvant chemotherapy after surgery for stage II or III colorectal cancer.
Doc. S1. Materials and methods.
Table S1. Top 20 miRNAs up‐ and downregulated in metachronous liver metastasis compared with primary tumors as assessed by microRNA arrays.