

Abstract
In several malignant tumors including lymphoma, macrophages that infiltrate tumor tissues are called tumor‐associated macrophages (TAMs). We discovered that TAMs, especially the CD163+ alternatively activated phenotype (M2), were closely involved with progression of adult T‐cell leukemia/lymphoma (ATLL). We used CD68 (a pan‐macrophage marker) and CD163 (an M2 marker) to immunostain 58 ATLL samples. Statistical analyses showed that a high number of CD68+ TAMs and an increased percentage of CD163+ cells among the TAMs were associated with a worse clinical prognosis; multivariate analysis indicated that the percentage of CD163+ cells was an independent prognostic factor. We also carried out in vitro coculture experiments with ATLL cell lines (ATN‐1 and TL‐Mor) and monocyte‐derived macrophages and found that direct coculture with M2 macrophages significantly increased BrdU incorporation into ATLL cell lines. A cytokine array analysis showed that macrophage‐derived soluble factors including C5a, tumor necrosis factor‐α, growth‐related oncogene‐α, CCL1/I‐309, and interleukin‐6 stimulated ATLL cell lines. CD163 expression in macrophages was strongly induced by direct contact with ATN‐1 cells, and downregulation of CD163 in macrophages significantly suppressed growth of cocultured ATN‐1 cells. These results suggest that interaction between M2 macrophages and lymphoma cells may be an appropriate target in treatment of patients with ATLL.
Macrophages that infiltrate tumor tissues are referred to as tumor‐associated macrophages (TAMs) and are closely involved in tumorigenesis by inducing angiogenesis, immunosuppression, and invasion.1, 2 Many studies of TAMs in human malignant tumors have been published since 2000, and they showed an association of TAMs with histological grade and clinical prognosis in many kinds of tumors including hematological malignancies.1, 2
The heterogeneity of macrophage phenotypes has also been a focus of study in recent years.3, 4 The functions and gene expression profiles of classically activated macrophages induced by γ‐interferon and alternatively activated macrophages induced by anti‐inflammatory cytokines such as interleukin (IL)‐10, macrophage colony‐stimulating factor (M‐CSF), IL‐4, and IL‐13 were found to be different, and these two types of activated macrophages were named M1 and M2, respectively.3, 4 The M2 phenotype preferentially produces angiogenic factors and immunosuppressive molecules and is associated with tissue remodeling, neovascularization, and tumor progression.3, 4 In tumor microenvironments, some kinds of tumor cells secrete many anti‐inflammatory cytokines, which seem to induce differentiation of TAMs to the M2 phenotype.5, 6, 7
Adult T‐cell leukemia/lymphoma (ATLL) is known to develop in people infected with human T‐cell leukemia virus type 1.8, 9 The disease is classified into four categories: acute (60%); lymphomatous (20%); chronic (15%); and smoldering (5%).10, 11, 12, 13 Acute and lymphomatous ATLLs are aggressive diseases, with a reported median survival time of <1 year.10, 11, 12, 13
Although recent studies have focused on TAMs in malignant lymphomas such as Hodgkin's lymphoma, angioimmunoblastic T‐cell lymphoma, follicular lymphoma, and diffuse large B‐cell lymphoma, a few in vitro studies investigated details of the molecular mechanisms of TAMs in the tumor microenvironment.14, 15, 16, 17, 18 In addition, the significance of TAMs or CD163+ M2 TAMs in ATLL has never been investigated. We therefore investigated the significance of TAM or M2 TAMs in ATLL by means of in vivo immunohistochemical analysis of human ATLL specimens and in vitro coculture experiments.
Materials and Methods
Tissue samples
Paraffin‐embedded tumor samples were from lymph nodes obtained from 58 patients with acute or lymphomatous ATLL who had been enrolled in our previous study.19, 20 All samples were obtained with informed consent from patients and with the approval of doctors in the participating hospitals. Serological tests had proved that the peripheral blood of all patients was positive for anti‐ATLL‐associated antigen.
Immunohistochemistry
Paraffin‐embedded tumor tissue samples were used to analyze macrophage infiltration. CD163 was used as a marker for M2 macrophages. Two mouse mAbs were used, CD68 (PG‐M1; Dako, Glostrup, Denmark) and CD163 (10D6; Novocastra, Newcastle, UK). Two pathologists who were blinded to any information about the samples evaluated infiltration of CD68+ and CD163+ cells and the results were averaged as described previously.21, 22 For double‐immunostaining, sections were at first reacted with anti‐CD68 antibody and visualized by the DAB system (Nichirei, Tokyo, Japan). The following antibodies were washed in glycine buffer (pH 2.2), sections were reacted with anti‐CD163 antibody, and visualized by HistoGreen solution (Linaris Biologische Produkte, Wertheim‐Bettingen, Germany).
Cell lines
The human ATLL cell lines ATN‐1 and TL‐Mor were purchased from Riken Cell Bank (Wako, Japan) and were maintained in RPMI supplemented with 10% FBS. The mycoplasma test was carried out using a PCR detection kit (Takara Bio, Otsu, Japan).
Macrophage culture
Peripheral blood mononuclear cells were obtained from four healthy volunteer donors, and all donors supplied written informed consent for experimental use of these cells. CD14+ monocytes were isolated by using CD14‐microbeads (Miltenyi Biotec, Bergisch Gladbach, Germany). These monocytes were plated in 24‐well plates (5 × 10⁴/well) and were cultured with granulocyte macrophage‐colony stimulating factor (GM‐CSF, 2 ng/mL; Wako, Tokyo, Japan) for 5 days, with γ‐interferon (1 ng/mL; PeproTech, Rocky Hill, NJ, USA) being added for last 24 h to induce M1 macrophages. To induce M2 macrophages, CD14+ monocytes were cultured with macrophage‐colony stimulating factor (M‐CSF; 100 ng/mL; Wako), with IL‐10 (10 ng/mL; PeproTech) being added for the last 24 h.
Incorporation of BrdU and immunostaining
Incorporation of BrdU and immunostaining were carried out by using the BrdU ELISA Kit (Roche Applied Science, Penzberg, Bavaria, Germany) according to the manufacturer's protocol with minor modifications. Briefly, after cells were cultured with BrdU for 90 min, they were attached to glass slides using Cytospin (ThermoFisher, Waltham, MA, USA), and were fixed with acetone. In this assay, CD204 (clone SRA‐E5; Transgenic, Kumamoto, Japan) served as a macrophage marker and was visualized by using the diaminobenzidine substrate system (Nichirei). The staining intensity of CD204 in GM‐CSF‐primed macrophages and M‐CSF‐primed macrophages did not differ (data not shown). After washes in glycine buffer (pH 2.2), cells were stained with anti‐BrdU antibody and were visualized using HistoGreen solution (Linaris Biologische Produkte). The secondary antibody was HRP‐labeled goat anti‐mouse immunoglobulin (GE Healthcare, Tokyo, Japan).
Cell proliferation assay
ATN‐1 and TL‐Mor cells (5000 cells per well in 96‐well culture plates) were stimulated with C5a (1 pg/mL), tumor necrosis factor (TNF)‐α (5 ng/mL), growth‐related oncogene (GRO)‐α (1 ng/mL), CCL1/I‐309 (1 pg/mL), or IL‐6 (1 pg/mL) for 2 days, then total cell numbers were evaluated by using the WST assay kit (Dojindo, Kumamoto, Japan).
Reverse transcription−PCR and real‐time PCR
Total RNA was isolated by using RNAiso Plus (Takara Bio); RNA was reverse‐transcribed by means of a PrimeScript RT reagent kit (Takara Bio). The cDNA product was amplified by PCR. In RT‐PCR, PCR products were run on 2.0% agarose gels and stained with SYBR Safe DNA Gel Stain (Invitrogen, Carlsbad, CA, USA). Quantitative real‐time PCR was carried out using TaqMan polymerase with Sybr Green fluorescence (Takara Bio) with an ABI PRISM 7300 Sequence Detector (Applied Biosystems, Foster City, CA, USA). The primers are detailed in Table S1.
Small interfering RNA in human macrophages
Human macrophages were transfected with siRNA to human CD163 (Santa Cruz Biotechnology, Santa Cruz, CA, USA) by using Lipofectamine RNAi MAX (Invitrogen). Control siRNA (Santa Cruz Biotechnology) was used as a negative control.
Western blot analysis
In some experiments, CD163 expression was determined by Western blot analysis. The protein (10 μg) was run on a 10% SDS‐polyacrylamide gel and transferred to a PVDF transfer membrane (Millipore, Bedford, MA, USA). The membranes were exposed to an anti‐human CD163 antibody (PM‐2K; Transgenic) and visualized by HRP‐conjugated anti‐mouse IgG antibody with ECL Western blotting detection reagent. These membranes were reblotted with an anti‐β‐actin antibody as an internal calibration control.
Enzyme‐linked immunosorbent assay
We used ELISA to examine the concentrations of C5a, TNF‐α, GRO‐α, I‐309, and IL‐6 in culture supernatants. The ELISA kits were purchased from PeproTech and BD Biosciences (San Jose, CA, USA).
Statistics
Statistical analysis of in vitro and in vivo data was carried out using jmp10 (SAS Institute, Chicago, IL, USA). All values from in vitro studies represent results of two or three independent experiments. Data are expressed as means ± SD. Student's t‐test was used for two‐group comparisons in in vitro studies. A value of P < 0.05 was considered statistically significant.
Results
Relation of higher proportion of CD163+ TAMs to poor clinical prognosis in patients with ATLL
We used CD68 and CD163 immunostaining of 58 ATLL tissue specimens. Many CD68+ and CD163+ cells infiltrated tumor tissues, and double‐immunostaining showed that CD163+ cells were in fact CD68+ TAMs (Fig. 1a,b). These cell numbers and the percentage of CD163+ cells in CD68+ cells were not associated with age and sex; however, the increased number and higher percentage of CD163+ cells were closely related to clinical stage (Table 1). In univariate analysis, higher clinical stage, increased number of CD68+ cells, and higher percentage of CD163+ cells were significantly associated with worse clinical prognosis (Table 2; Fig. 1c). However, only the percentage of CD163+ cells was correlated with clinical prognosis in multivariate analysis (Table 2).
Figure 1.

Immunostaining of CD68 and CD163 in adult T‐cell leukemia/lymphoma samples and survival analysis. (a) Results of CD68 and CD163 immunostaining for two patients (Pt.). (b) Double‐immunostaining of CD68 (brown) and CD163 (green). (c) Kaplan–Meier survival analysis of patients with a high or low number of CD68+ cells (left panel) and patients with high or low percentage of CD163+ cells among the CD68+ cells (right panel).
Table 1.
Clinicopathological correlation of CD68+ and CD163+ tumor‐associated macrophages in patients with adult T‐cell leukemia/lymphoma (n = 68)
| n | CD68+ cells/mm2 | CD163+ cells/mm2 | % of CD163+ cells | ||||
|---|---|---|---|---|---|---|---|
| Mean | P‐value | Mean | P‐value | Mean | P‐value | ||
| Gender | |||||||
| Male | 34 | 368 | 0.98 | 260 | 0.950 | 72.3 | 0.420 |
| Female | 24 | 369 | 263 | 82.3 | |||
| Age | |||||||
| ≥65 years | 29 | 373 | 0.84 | 249 | 0.510 | 70.6 | 0.340 |
| <65 years | 29 | 362 | 281 | 82.2 | |||
| Stage | |||||||
| I, II, III | 24 | 340 | 0.34 | 203 | 0.011* | 62.6 | 0.026* |
| IV | 30 | 393 | 322 | 89.4 | |||
Data were statistically analyzed by the Mann–Whitney U‐test. *Statistically significant.
Table 2.
Univariate and multivariate Cox regression analyses of CD68+ and CD163+ tumor‐associated macrophages in progression of adult T‐cell leukemia/lymphoma
| n | Median survival (months) | Univariate analysis | Multivariate analysis | ||||
|---|---|---|---|---|---|---|---|
| P‐value (log–rank) | P‐value (Wilcoxon) | HR | 95% CI | P‐value | |||
| Gender | |||||||
| Male | 34 | 17.8 | 0.160 | 0.380 | |||
| Female | 24 | 26.9 | |||||
| Age | |||||||
| ≥65 years | 29 | 19.3 | 0.320 | 0.420 | 1.56 | 0.79–2.85 | 0.210 |
| <65 years | 29 | 22.5 | |||||
| Stage | |||||||
| I, II, III | 24 | 29 | 0.029* | 0.130 | 1.67 | 0.86–3.34 | 0.130 |
| IV | 30 | 17.1 | |||||
| CD68+ cells | |||||||
| High (≥300/mm2) | 32 | 13.7 | 0.114 | 0.031* | 1.68 | 0.87–3.34 | 0.110 |
| Low (<300/mm2) | 26 | 26.8 | |||||
| CD163+ cells | |||||||
| High (≥250/mm2) | 30 | 17.3 | 0.098 | 0.185 | |||
| Low (<250/mm2) | 28 | 26.1 | |||||
| CD163(%) | |||||||
| High (≥75%) | 28 | 16.2 | 0.046* | 0.138 | 2.03 | 1.06–3.99 | 0.032* |
| Low (<75%) | 30 | 26.5 | |||||
The mean numbers of the CD68 high group and low group were 224.7/mm2 and 484.5/mm2 respectively. The mean numbers of the CD163 high group and low group were 113.9/mm2 and 406.2/mm2, respectively. The mean percentage of the CD163 (%) high group and low group were 37.5% and 111.2%, respectively. HR, hazard ratio; CI, confidence interval. *Statistically significant.
Significant activation of ATLL cells by direct coculture with M2 macrophages
We then carried out coculture experiments with ATLL cell lines and human macrophages and investigated the functional effects of macrophages on tumor cell activation. After human monocytes were differentiated into the M1 or M2 phenotype, ATN‐1 cells were directly added to cultured macrophages. After 2 days of coculture, the BrdU incorporation assay was performed. Because two different cell types were mixed in direct coculture, we carried out macrophage and BrdU double‐immunostaining and determined the percentage of BrdU+ cells among tumor cells that were negative for macrophage marker. Coculture with macrophages significantly increased BrdU incorporation into ATN‐1 cells, with M2, rather than M1, cells inducing a notable increase of BrdU incorporation into ATN‐1 cells (Fig. 2a,b). Similar results were obtained when macrophages from all donors were used in coculture experiments (Fig. 2b). Interestingly, BrdU incorporation was also detected in a small number of macrophages (<1%) (Fig. 2a, right panel). Similar experiments were carried out with other cell lines. BrdU incorporation into the cell line TL‐Mor was, as expected, upregulated by coculture with M2 cells, but it was not changed by coculture with M1 cells (Fig. 2c). We also compared indirect coculture by using Transwell culture dishes and direct coculture to analyze the significance of direct contact in macrophage and lymphoma cell interaction. Results showed that, in contrast to indirect coculture conditions, direct cell–cell contact caused significantly stronger BrdU incorporation in both lymphoma cell lines (Fig. 2d).
Figure 2.

In vitro coculture assay of lymphoma cell lines and human macrophages. (a) To analyze BrdU incorporation into cells, double‐immunostaining of BrdU (green) and CD204 (brown, a macrophage marker) was carried out. (b) ATN‐1 cells were cocultured with M1 or M2 macrophages derived from four healthy donors, and BrdU incorporation was analyzed. *Statistically significant (P < 0.05). (c) TL‐Mor cells were cocultured with M1 or M2 macrophages derived from four healthy donors, and BrdU incorporation was analyzed. (d) Lymphoma cell lines and M2 macrophages were directly cocultured with or without use of Transwell culture dishes, and BrdU incorporation was analyzed. Data were analyzed using Student's t‐test (n = 3–4).
Involvement of macrophage‐derived soluble factors including C5a, TNF‐α, GRO‐α, I‐309, and IL‐6 in lymphoma cell activation
To investigate what kinds of soluble factors are involved in cell–cell interaction between M2 macrophages and lymphoma cells, 36 molecules in culture supernatant were tested by using a cytokine array kit (Fig. S1). Of these 36, we focused on C5a, TNF‐α, GRO‐α, I‐309, and IL‐6 because they were detected in macrophage supernatant and coculture supernatant but not in ATN‐1 supernatant (Fig. 3a). The RT‐PCR analysis showed that ATN‐1 and TL‐Mor cells expressed receptors for these molecules (Fig. 3b). Then, to test whether these soluble factors would influence the proliferation of lymphoma cells, ATN‐1 and TL‐Mor cells were cultured with these molecules and cell proliferation was evaluated. As Figure 3(c) shows, C5a, TNF‐α, GRO‐α, I‐309, and IL‐6 significantly promoted the proliferation of these lymphoma cell lines.
Figure 3.

Soluble factors related to cell–cell interaction. (a) Culture supernatants of M2 macrophages (Mac), ATN‐1 cells, and coculture cells were tested using a cytokine array, which revealed spots for C5a, tumor necrosis factor (TNF)‐α, growth‐related oncogene (GRO)‐α, I‐309, and interleukin (IL)‐6. (b) RT‐PCR analysis was carried out to evaluate mRNA expression of CD88 (C5a receptor), TNFR1/2 (TNF‐α receptors), CXCR2 (GRO‐α receptor), CCR8 (I‐309 receptor), and GP130/IL‐6R (IL‐6 receptors) in M2 macrophages and two lymphoma cell lines. (c) ATN‐1 and TL‐Mor cells were stimulated by C5a, TNF‐α, GRO‐α, I‐309, and IL‐6 plus sIL‐6R for 2 days. Cell numbers were evaluated with the WST assay. Data were analyzed by using Student's t‐test (n = 4).
Induction of higher expression in macrophages of CD163 by direct macrophage–lymphoma cell contact
Because soluble macrophage‐derived factors from certain kinds of tumor cells induced CD163 upregulation in macrophages, we studied whether tumor cell supernatant (TCS) of ATN‐1 and TL‐Mor cells would change CD163 expression. Western blot analysis showed that TCS from ATN‐1 cells did not influence the CD163 expression and that TCS from TL‐Mor cells downregulated CD163 expression (Fig. 4a). The GM‐CSF‐primed macrophages showed no CD163 expression (Fig. 4a). CD163 expression in macrophages was not significantly changed by indirect coculture with ATN‐1 cells, but direct coculture with ATN‐1 cells induced notable upregulation of CD163 expression (Fig. 4b). Similar results were observed when CD163 expression was examined using cell‐ELISA methods (Fig. 4c).
Figure 4.

Increased CD163 expression in macrophages as a result of direct cell−cell interaction. (a) Macrophage colony‐stimulating factor (M‐CSF)‐primed macrophages or granulocyte macrophage‐colony stimulating factor (GM‐CSF)‐primed macrophages were stimulated with interleukin (IL)‐4, IL‐10, tumor cell supernatant (TCS) of ATN‐1, and TCS of TL‐Mor for 2 days. CD163 expression was examined using Western blot analysis. IFN, interferon. (b) After M‐CSF‐primed macrophages (Mac) or GM‐CSF‐primed macrophages were cocultured with ATN‐1 cells indirectly or directly for 2 days, CD163 expression was examined using Western blotting. (c) CD163 expression in macrophages stimulated with TCS of ATN‐1 or cultured directly with ATN‐1 cells was evaluated using cell‐ELISA methods. Data were analyzed using Student's t‐test (n = 4).
Close association of CD163‐mediated macrophage activation with tumor cell activation in direct coculture
On the basis of these results, we suspected that CD163 would play an important role in cell–cell interaction between ATN‐1 cells and M2 macrophages. To confirm this hypothesis, we carried out a coculture experiment after CD163 protein was silenced by siRNA (Fig. 5a,b). The BrdU incorporation into ATN‐1 cells was significantly suppressed when cells were cocultured with macrophages in which CD163 was downregulated (Fig. 5c). The total number of ATN‐1 cells was calculated as described in “Materials and Methods.” Coculture with M2 macrophages induced proliferation of ATN‐1 cells, but such proliferation was not induced when cells were cocultured with CD163‐silenced M2 macrophages (Fig. 5d). Finally, we attempted to determine which cytokines related to the growth of ATN‐1 cells were regulated by CD163 activation. We analyzed mRNA expression of TNF‐α, GRO‐α, I‐309, and IL‐6 in macrophages, but no significant changes in these mRNAs were induced by CD163 downregulation (data not shown). We also carried out ELISA to evaluate the production of these molecules in culture supernatant. The concentrations of GRO‐α and IL‐6 tended to be lower, but not significantly, after CD163 downregulation (Fig. 5e). The ELISA did not detect C5a or TNF‐α production (data not shown).
Figure 5.

Involvement of CD163 in direct cell–cell interaction between ATN‐1 cells and M2 macrophages. (a) Schedule of this coculture experiment. (b) Downregulation of CD163 was confirmed by Western blotting. After CD163 in macrophages was silenced by siRNA, the coculture experiment was carried out, in which the number of ATN‐1 cells was counted (c), and the BrdU incorporation was analyzed (d). ELISA data of growth‐related oncogene (GRO)‐α and interleukin (IL)‐6 in culture supernatant are shown (e). ND, not detected; NS, not significant.
Discussion
Certain clinicopathological studies recently indicated the significance of CD163‐expressing M2 TAMs in the growth of tumor cells, and a high number of M2 TAMs is reportedly associated with a worse prognosis in many malignant tumors including lymphomas.14, 15, 16, 17, 18, 21, 23, 24, 25 However, the present study is the first report describing the involvement of TAMs in ATLL. The number of CD68+ TAMs, the percentage of CD163+ TAMs, and clinical stages were prognostic factors in univariate analysis. Although the number of CD163+ TAMs increased in patients with a higher clinical stage of disease, the statistical finding from multivariate analysis that only the percentage of CD163+ TAMs was associated with clinical prognosis indicated that the percentage of CD163+ TAMs was an independent prognostic factor. This may indicate that the combination of the number of CD68+ and CD163+ TAMs is more important for lymphoma progression. The fact that the number of ATLL cases in this study is not large (<100 cases) might have influenced this discrepancy. Although TAMs are believed to be associated with angiogenesis and immune suppression, our preliminary result indicated that the numbers of vessels and of infiltrating CD8+ lymphocytes were not associated with TAMs in ATLL. We therefore focused on the mechanisms of cell–cell interaction between TAMs and lymphoma cells to clarify the significance of CD163+ TAMs in the progression of ATLL (summarized in Fig. 6).
Figure 6.
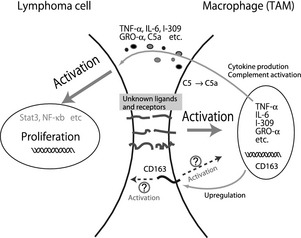
Scheme of cell–cell interaction between ATN‐1 cells and M2 macrophages. Tumor‐association macrophages (TAMs) are activated by direct contact with adult T‐cell leukemia/lymphoma (ATLL) cells through unknown molecules, growth factors secreted by TAMs stimulate ATLL cells and induce disease progression. CD163 protein on TAMs is also upregulated by direct contact with ATLL cells. Although the detailed functions of CD163 in direct cell–cell interaction between ATLL cells and TAMs is unclear, the fact that ATLL cells were deactivated by CD163 siRNA indicates the significant role of CD163‐related signals. GRO‐α, growth‐related oncogene‐α; IL‐6, interleukin‐6; NF‐κB, nuclear factor‐κB; TNF‐α, tumor necrosis factor‐α.
In our study, the BrdU incorporation assay clearly revealed significant activation of lymphoma cells by coculture with macrophages. Although no study previously investigated which molecules may be related to cell–cell interaction between TAMs and lymphoma cells, our in vitro study here showed that CD163+ M2 macrophages promoted lymphoma cell activation through macrophage‐derived soluble factors such as C5a, TNF‐α, GRO‐α, I‐309, and IL‐6. These molecules are well known to activate nuclear factor‐κB and the JAK/STAT pathway,26, 27, 28, 29, 30 and constitutive activation of these molecules is closely associated with progression of ATLL.31, 32, 33 These macrophage‐derived molecules may therefore be involved to some degree in constitutive activation of nuclear factor‐κB and the JAK/STAT pathway in the ATLL microenvironment.
Certain kinds of tumor cells, such as glioblastoma and kidney cancer cells, secrete many cytokines that upregulate CD163 expression and other M2 markers in cultured macrophages.22, 24, 25 We therefore studied whether TCS from ATLL cells would drive the polarization of cultured macrophages to the M2 phenotype. However, CD163 expression was not induced by TCS from ATN‐1 cells and was downregulated by TCS from TL‐Mor cells. The finding that CD163 expression was reduced in IL‐4‐stimulated cells (Fig. 4a) could be due to IL‐4 or other unknown molecules produced by TL‐Mor cells. In this study, we could not determine what kinds of molecules are involved in CD163 overexpression in patients with ATLL. That direct contact with ATN‐1 cells induced CD163 upregulation in macrophages suggested that unknown molecules associated with M2 polarization were expressed on the cell surface of ATN‐1 cells or ATLL cells. If in the future we can identify these molecules, they may be targets in ATLL therapy.
In this study, we found that cell–cell interaction between lymphoma cells and macrophages was strongly induced when both cell types were in direct contact. We also found that CD163 was a cell surface receptor that was involved in direct cell–cell interaction. However, our finding that the five molecules we studied (C5a, TNF‐α, GRO‐α, I‐309, and IL‐6) were not affected by downregulation of CD163 suggested the existence of unknown molecules regulated by CD163 signals. Additional studies are necessary to determine the molecular mechanisms of CD163‐related cell–cell interaction between TAMs and lymphoma cells. CD163 is one of the scavenger receptors specific for macrophages and is especially highly expressed on M2 macrophages.3, 34 The haptoglobin–hemoglobin complex is well known to bind to CD163, but recent studies showed that bacterial components and TWEAK (TNF‐like weak inducer of apoptosis) are also ligands of CD163.35, 36, 37 In our preliminary study, we found no TWEAK expression in ATLL cell lines. Our study here suggested that an unknown CD163 ligand is expressed on the cell surface of ATLL cells, but it may be difficult to detect the specific CD163 ligand because scavenger receptors such as CD204 and CD36 generally have many ligands.38
In addition, the results shown in Figure 2(a) indicate that a small number of macrophages incorporated BrdU by coculture with ATN‐1 cells. Proliferating cell nuclear antigen (PCNA)+ TAMs are detected in breast cancer and higher counts of PCNA+ TAMs are associated with shorter disease‐free survival.39 These observations suggest that a part of TAMs strongly activated by cancer cell‐derived unknown signals could proliferate.
In conclusion, we showed that TAMs, especially the CD163+ M2 phenotype, are closely associated with progression of ATLL. Although we detected five macrophage‐derived molecules that stimulate the growth of lymphoma cells, other unknown molecules or unknown mechanisms may be involved because our results cannot explain why downregulation of CD163 in cocultured macrophages suppressed lymphoma cell activation. Further studies related to cell–cell interaction between macrophage and lymphoma cells could provide a new treatment strategy for patients with not only ATLL but also other malignant tumors.
Disclosure Statement
The authors have no conflict of interest.
Supporting information
Fig. S1. Data of cytokine array.
Table S1. Primer list for RT‐PCR and real‐time PCR.
Acknowledgments
We thank Ms Emi Kiyota, Mr Osamu Nakamura, and Ms Yui Hayashida for their technical assistance. This work was supported by grants from the Ministry of Education, Culture, Sports, Science and Technology of Japan.
(Cancer Sci 2013; 104: 945–951)
References
- 1. Bingle L, Brown NJ, Lewis CE. The role of tumour‐associated macrophages in tumour progression: implications for new anticancer therapies. J Pathol 2002; 196: 254–65. [DOI] [PubMed] [Google Scholar]
- 2. Mantovani A, Sozzani S, Locati M, Allavena P, Sica A. Macrophage polarization: tumor‐associated macrophages as a paradigm for polarized M2 mononuclear phagocytes. Trends Immunol 2002; 23: 549–55. [DOI] [PubMed] [Google Scholar]
- 3. Gordon S. Alternative activation of macrophages. Nat Rev Immunol 2003; 3: 23–35. [DOI] [PubMed] [Google Scholar]
- 4. Qian BZ, Pollard JW. Macrophage diversity enhances tumor progression and metastasis. Cell 2010; 141: 39–51. [DOI] [PMC free article] [PubMed] [Google Scholar]
- 5. Pollard JW. Tumour‐educated macrophages promote tumour progression and metastasis. Nat Rev Cancer 2004; 4: 71–8. [DOI] [PubMed] [Google Scholar]
- 6. Hagemann T, Lawrence T, McNeish I et al “Re‐educating” tumor‐associated macrophages by targeting NF‐kappaB. J Exp Med 2008; 205: 1261–8. [DOI] [PMC free article] [PubMed] [Google Scholar]
- 7. Sica A, Larghi P, Mancino A et al Macrophage polarization in tumour progression. Semin Cancer Biol 2008; 18: 349–55. [DOI] [PubMed] [Google Scholar]
- 8. Shirono K, Hattori T, Hata H, Nishimura H, Takatsuki K. Profiles of expression of activated cell antigens on peripheral blood and lymph node cells from different clinical stages of adult T‐cell leukemia. Blood 1989; 73: 1664–71. [PubMed] [Google Scholar]
- 9. Ohshima K. Pathological features of diseases associated with human T‐cell leukemia virus type I. Cancer Sci 2007; 98: 772–8. [DOI] [PMC free article] [PubMed] [Google Scholar]
- 10. Shimoyama M. Diagnostic criteria and classification of clinical subtypes of adult T‐cell leukaemia‐lymphoma. A report from the Lymphoma Study Group (1984–87). Br J Haematol 1991; 79: 428–37. [DOI] [PubMed] [Google Scholar]
- 11. Liu Z, Liu Y, Wang C et al Comparative analyses of chromatographic fingerprints of the roots of Polygonum multiflorum Thunb. and their processed products using RRLC/DAD/ESI‐MS(n). Planta Med 2011; 77: 1855–60. [DOI] [PubMed] [Google Scholar]
- 12. Takasaki Y, Iwanaga M, Imaizumi Y et al Long‐term study of indolent adult T‐cell leukemia‐lymphoma. Blood 2010; 115: 4337–43. [DOI] [PubMed] [Google Scholar]
- 13. Oshima K, Jaffe ES, Kikuchi M. Adult T‐cell leukemia/lymphoma In: Swerdlow SH, Campo E, Harris NL. et al, eds. WHO Classification of Tumours of Haematopoietic and Lymphoid Tissue, 4th edn. Lyon: IARC, 2008. [Google Scholar]
- 14. Clear AJ, Lee AM, Calaminici M et al Increased angiogenic sprouting in poor prognosis FL is associated with elevated numbers of CD163 + macrophages within the immediate sprouting microenvironment. Blood 2010; 115: 5053–6. [DOI] [PMC free article] [PubMed] [Google Scholar]
- 15. Niino D, Komohara Y, Murayama T et al Ratio of M2 macrophage expression is closely associated with poor prognosis for Angioimmunoblastic T‐cell lymphoma (AITL). Pathol Int 2011; 60: 278–83. [DOI] [PubMed] [Google Scholar]
- 16. Steidl C, Lee T, Shah SP et al Tumor‐associated macrophages and survival in classic Hodgkin's lymphoma. N Engl J Med 2010; 362: 875–85. [DOI] [PMC free article] [PubMed] [Google Scholar]
- 17. Zaki MA, Wada N, Ikeda J et al Prognostic implication of types of tumor‐associated macrophages in Hodgkin lymphoma. Virchows Arch 2011; 459: 361–6. [DOI] [PubMed] [Google Scholar]
- 18. Wada N, Zaki MA, Hori Y et al Tumour‐associated macrophages in diffuse large B‐cell lymphoma: a study of the Osaka Lymphoma Study Group. Histopathology 2012; 60: 313–19. [DOI] [PubMed] [Google Scholar]
- 19. Nabeshima K, Suzumiya J, Nagano M et al Emmprin, a cell surface inducer of matrix metalloproteinases (MMPs), is expressed in T‐cell lymphomas. J Pathol 2004; 202: 341–51. [DOI] [PubMed] [Google Scholar]
- 20. Karube K, Aoki R, Sugita Y et al The relationship of FOXP3 expression and clinicopathological characteristics in adult T‐cell leukemia/lymphoma. Mod Pathol 2008; 21: 617–25. [DOI] [PubMed] [Google Scholar]
- 21. Komohara Y, Ohnishi K, Kuratsu J, Takeya M. Possible involvement of the M2 anti‐inflammatory macrophage phenotype in growth of human gliomas. J Pathol 2008; 216: 15–24. [DOI] [PubMed] [Google Scholar]
- 22. Komohara Y, Horlad H, Ohnishi K et al M2 macrophage/microglial cells induce activation of Stat3 in primary central nervous system lymphoma. J Clin Exp Hematop 2011; 51: 93–9. [DOI] [PubMed] [Google Scholar]
- 23. Rogers TL, Holen I. Tumour macrophages as potential targets of bisphosphonates. J Trans Med 2011; 9: 177. [DOI] [PMC free article] [PubMed] [Google Scholar]
- 24. Komohara Y, Hasita H, Ohnishi K et al Macrophage infiltration and its prognostic relevance in clear cell renal cell carcinoma. Cancer Sci 2011; 102: 1424–31. [DOI] [PubMed] [Google Scholar]
- 25. Hasita H, Komohara Y, Okabe H et al Significance of alternatively activated macrophages in patients with intrahepatic cholangiocarcinoma. Cancer Sci 2010; 101: 1913–19. [DOI] [PMC free article] [PubMed] [Google Scholar]
- 26. Bode JG, Albrecht U, Haussinger D, Heinrich PC, Schaper F. Hepatic acute phase proteins–regulation by IL‐6‐ and IL‐1‐type cytokines involving STAT3 and its crosstalk with NF‐kappaB‐dependent signaling. Eur J Cell Biol 2012; 91: 496–505. [DOI] [PubMed] [Google Scholar]
- 27. Chiou WF, Tsai HR, Yang LM, Tsai WJ. C5a differentially stimulates the ERK1/2 and p38 MAPK phosphorylation through independent signaling pathways to induced chemotactic migration in RAW264.7 macrophages. Int Immunopharmacol 2004; 4: 1329–41. [DOI] [PubMed] [Google Scholar]
- 28. Bechara C, Chai H, Lin PH, Yao Q, Chen C. Growth related oncogene‐alpha (GRO‐alpha): roles in atherosclerosis, angiogenesis and other inflammatory conditions. Med Sci Monit 2007; 13: RA87–90. [PubMed] [Google Scholar]
- 29. Van Antwerp DJ, Martin SJ, Verma IM, Green DR. Inhibition of TNF‐induced apoptosis by NF‐kappa B. Trends Cell Biol 1998; 8: 107–11. [DOI] [PubMed] [Google Scholar]
- 30. Wong CK, Tsang CM, Ip WK, Lam CW. Molecular mechanisms for the release of chemokines from human leukemic mast cell line (HMC)‐1 cells activated by SCF and TNF‐alpha: roles of ERK, p38 MAPK, and NF‐kappaB. Allergy 2006; 61: 289–97. [DOI] [PubMed] [Google Scholar]
- 31. Tomita M, Kawakami H, Uchihara JN et al Inhibition of constitutively active Jak‐Stat pathway suppresses cell growth of human T‐cell leukemia virus type 1‐infected T‐cell lines and primary adult T‐cell leukemia cells. Retrovirology 2006; 3: 22. [DOI] [PMC free article] [PubMed] [Google Scholar] [Retracted]
- 32. Yamada O, Ozaki K, Akiyama M, Kawauchi K. JAK‐STAT and JAK‐PI3K‐mTORC1 pathways regulate telomerase transcriptionally and posttranslationally in ATL cells. Mol Cancer Ther 2012; 11: 1112–21. [DOI] [PubMed] [Google Scholar]
- 33. Yamagishi M, Nakano K, Miyake A et al Polycomb‐mediated loss of miR‐31 activates NIK‐dependent NF‐kappaB pathway in adult T cell leukemia and other cancers. Cancer Cell 2012; 21: 121–35. [DOI] [PubMed] [Google Scholar]
- 34. Komohara Y, Hirahara J, Horikawa T et al AM‐3K, an anti‐macrophage antibody, recognizes CD163, a molecule associated with an anti‐inflammatory macrophage phenotype. J Histochem Cytochem 2006; 54: 763–71. [DOI] [PubMed] [Google Scholar]
- 35. Kristiansen M, Graversen JH, Jacobsen C et al Identification of the haemoglobin scavenger receptor. Nature 2001; 409: 198–201. [DOI] [PubMed] [Google Scholar]
- 36. Bover LC, Cardo‐Vila M, Kuniyasu A et al A previously unrecognized protein‐protein interaction between TWEAK and CD163: potential biological implications. J Immunol 2007; 178: 8183–94. [DOI] [PubMed] [Google Scholar]
- 37. Fabriek BO, van Bruggen R, Deng DM et al The macrophage scavenger receptor CD163 functions as an innate immune sensor for bacteria. Blood 2009; 113: 887–92. [DOI] [PubMed] [Google Scholar]
- 38. Areschoug T, Gordon S. Scavenger receptors: role in innate immunity and microbial pathogenesis. Cell Microbiol 2009; 11: 1160–9. [DOI] [PubMed] [Google Scholar]
- 39. Mukhtar RA, Moore AP, Nseyo O et al Elevated PCNA+ tumor associated macrophages in breast cancer are associated with early recurrence and non‐Caucasian ethnicity. Breast Cancer Res Treat 2011; 130: 635–44. [DOI] [PubMed] [Google Scholar]
Associated Data
This section collects any data citations, data availability statements, or supplementary materials included in this article.
Supplementary Materials
Fig. S1. Data of cytokine array.
Table S1. Primer list for RT‐PCR and real‐time PCR.