

Abstract
Recently, an association between tumor infiltrating Forkhead box P3 regulatory T cells (Treg) and an unfavorable prognosis has been clinically shown in some cancers, but the mechanism of Treg induction in the tumor microenvironment remains uncertain. The aims of the present study were to examine the relationship between Treg and patient outcome and to investigate whether Treg induction is influenced by the characteristics of cancer‐associated fibroblasts (CAF) in lung adenocarcinoma. The numbers of Treg in both the tumor stroma and the tumor nest were counted in 200 consecutive pathological stage I lung invasive adenocarcinoma specimens. To examine whether the characteristics of CAF influence Treg induction, we selected and cultured CAF from low Treg and high Treg adenocarcinoma. The number of Treg was much higher in the stroma than in the nest (P < 0.01). Patients with high Treg had a significantly poorer prognosis than those with low Treg (overall survival: P = 0.03; recurrence‐free survival: P = 0.02; 5‐year overall survival: 85.4% vs 93.0%). Compared with the CAF from low Treg adenocarcinoma, culture supernatant of the CAF from high Treg adenocarcinoma induced more Treg (P = 0.01). Also, CAF from high Treg adenocarcinoma expressed significantly higher mRNA levels of transforming growth factor‐β (P = 0.01) and vascular endothelial growth factor (P = 0.01), both of which are involved in Treg induction. Our studies suggest the possibility that CAF expressing immunoregulatory cytokines may induce Treg in the stroma, creating a tumor‐promoting microenvironment in lung adenocarcinoma that leads to a poor outcome.
Lung cancer is the most common cause of cancer‐related death worldwide.1 Surgery currently plays an important role in the treatment of clinical stage I–IIIA non‐small lung cancer (NSCLC). Because of local recurrence and distant metastasis, however, patient outcome remains poor even after complete resection.2 Effective therapies are needed for individual patients after surgery, and a new prognostic marker for the selection of patients with a high risk of cancer recurrence is required.
Both tumor cell characteristics and patients' immune responses have been shown to affect tumor development and metastasis.3 Recent studies have shown that the accumulation of immunosuppressive lymphocytes, represented by regulatory T cells (Treg) that suppress autoreactive T cells to maintain immunological self‐tolerance and inhibit autoimmunity, is associated with advanced tumor growth and a poor outcome in several types of malignant tumors, including lung cancer.4, 5, 6, 7, 8 Forkhead box P3 (Foxp3) is a member of the forkhead/winged‐helix family of transcriptional factors that is critically involved in the development and function of Treg.9, 10
Cancer cells coexist with several stromal cell types that together create a cancer microenvironment. The main constituents of the stromal cell types are inflammatory cells, including lymphocytes and fibroblasts. Several recent reports have provided compelling experimental evidence indicating that the progression of tumors toward a malignant phenotype does not depend exclusively on the cell‐autonomous properties of the cancer cells themselves; it is also deeply influenced by cancer associated fibroblasts (CAF).11, 12, 13 Activated CAF contribute not only to inducing tumor progression, but also to creating the tumor microenvironment and inducing endothelial cells and other stromal cells via extracellular matrix proteins, proteases, cytokines and growth factors such as transforming growth factor (TGF)‐β, human growth factor, vascular endothelial growth factor (VEGF), and fibroblast growth factor.14 However, the correlation between tumor‐infiltrating Treg cells and CAF that express immunoregulatory cytokines has not been thoroughly investigated.
The aims of this study were to investigate the relationship between the Treg number and the outcome of patients with p‐stage I lung adenocarcinomas and to examine the possible correlation between Treg induction in the tumor microenvironment and the characteristics of CAF.
Materials and Methods
Patients
The present study group comprises 200 consecutive patients with adenocarcinoma of the lung who underwent a complete resection at the National Cancer Center Hospital East, Kashiwa, Japan. All patients were diagnosed as having pathological stage I disease between January 2004 and December 2005, and all had a solitary lesion. Patients who had received preoperative chemotherapy or preoperative thoracic radiotherapy and whose tumor was diagnosed as a pure bronchioloalveolar carcinoma were excluded. All patients underwent a lobectomy or pneumonectomy for the resection of the primary lesion. We surveyed the patients at 3‐month intervals for the first 2 years and at 6‐month intervals thereafter.
The present research was approved by the Internal Review Board of the National Cancer Center Hospital East. The research consisted of a retrospective chart review in March 2012. No personally identifiable information was included.
Histopathological analysis and evaluation of clinicopathological factors
The available pathology slides from all 200 surgical specimens were coded, masked for identity, and then reviewed by two pathologists (T.K. and G.I.). The cases were reviewed according to the current (third) edition of the World Health Organization's histological classification and were staged according to the TNM classification of the seventh edition of the Union for International Cancer Control. Furthermore, per the WHO classification, we organized all the cases into the four subtypes focused on their histological predominance: bronchioloalveolar carcinoma, acinar, papillary, or solid adenocarcinoma with mucin production.
Antibodies and immunohistochemistry
After the pathologic assessment of the H&E‐stained slides of the surgical specimens, 4‐μm thick sections were made from formalin‐fixed, paraffin‐embedded specimens. Each slide was then incubated overnight at 4°C with mouse antihuman Foxp3 antibodies (ab20034 clone 236A/E7 diluted at 1:200; Abcam Inc, Cambridge, MA, USA). The slides were incubated with EnVision™ (Dako, Glostrup, Denmark) for 30 min at room temperature for visualization of bound primary antibody. They were visualized in 2% 3,3′‐diaminobenzidine in 50‐mM Tris buffer (pH 7.6) containing 0.3% hydrogen peroxidase.
Immunohistochemical scoring
All the stained tissue sections were semiquantitatively scored and evaluated independently under a light microscope by two pathologists (T.K. and G.I.) who did not know any clinicopathological information regarding the cases. Among tumor‐infiltrating lymphocytes, Treg were detected based on the presence of positive nuclear staining for Foxp3. The absolute numbers of Treg in the stroma and in the nest were counted in five different high‐power fields (HPF, ×400 magnification). We counted Treg in the clear hot spot, and average cell count was defined as the Treg number.
Statistical analysis
Overall survival (OS) was measured from the date of surgery until the date of death from any cause or the date on which the patient was last known to be alive. The recurrence‐free survival (RFS) time was measured as the interval between the date of surgery and the date of recurrence, the date of death from any cause, or the most recent date on which the patient was last known to be disease‐free. Survival curves were plotted according to the Kaplan–Meier method and were compared using the log‐rank test. Two‐category comparisons were performed using the Pearson chi‐squared test or the Mann–Whitney U‐test for quantitative data. All the tests were two sided, and P‐values <0.05 were considered statistically significant. The statistical analysis was performed using StatView version 5.0 for Windows (SAS Institute Inc., Cary, NC, USA).
Fibroblast culture
Both CAF and non‐cancer‐associated fibroblasts were prepared from human lung cancer tissue and non‐cancerous lung tissue obtained from the same specimen as previously reported.15, 16 Briefly, an approximately 5‐mm3 sample of carcinoma from each tissue specimen was cut into about 15 subdivisions and placed in an minimum essential medium alpha modification (α‐MEM; Sigma, St. Louis, MO, USA) culture containing 10% heat‐inactivated FBS and antibiotics (penicillin and streptomycin). The medium was changed every other day until the tissue was surrounded by adherent fibroblasts. After 10–20 days of growth, the fibroblasts were separated from the epithelial and endothelial cells using differential trypsinization. When the cells reached 80% confluence, they were harvested with 0.25% trypsin and 1‐mmol/L ethylene‐diamine‐tetra‐acetic acid and replated at a density of 1 × 10⁴ cells/cm2.
CD4+CD25− cell purification and induction of Foxp3
For induction of CD4+Foxp3+ Treg cells, CD4+CD25−CD45RA+ naive conventional T cells were purified from the peripheral blood cells obtained from two healthy volunteers with a naive CD4+ T cell isolation kit II (Miltenyi Biotec, Bergisch Gladbach, Germany). Then, 5 × 10⁵ naive T cells were cultured in the culture supernatant from CAF with 4 × 10⁷ beads/mL CD3/CD28 beads‐T cell expander (Invitrogen, Carlsbad, CA, USA) and 10‐U/μL recombinant human interleukin (hIL)‐2 (Roche, Penzberg, Germany) for 144 h at 37°C in a humidified atmosphere of 5% CO2. For the control experiments, naive CD4+ T cells were cultured in RPMI1640 containing 10% FBS and 1% penicillin/streptomycin/glutamine with 50‐ng/μL recombinant human transforming growth factor‐&1 (Peprotech, Rocky Hill, NJ, USA), CD3/CD28 beads‐T cell expander, and recombinant hIL‐2. The fresh medium was replaced every other day. After 6 days of culture, living T cells were collected from them.
Real‐time RT‐PCR
The cultured T cells, CAF, and non‐cancer‐associated fibroblasts were washed with PBS, suspended in 1 mL TRIzol (Invitrogen), and then stored at −80°C. Total RNA was purified from the thawed samples with standard techniques, and cDNA was synthesized with the PrimeScript RT Reagent Kit (TaKaRa, Shiga, Japan), according to the manufacturer's instructions. Real‐time RT‐PCR was performed using a Smart Cycler System (TaKaRa) and SYBR Premix Ex Taq (TaKaRa), according to the manufacturer's instructions. Next, Foxp3 mRNA expression in the incubated T cells was analyzed with RT‐PCR. We compared each Foxp3 expression level in proportion to the total cell number. To normalize the mRNA expression of cytokines such as TGF‐β, VEGF, interleukin‐10, and COX‐2, we calculated the expression ratio (CAF/non‐cancer‐associated fibroblasts) and defined this ratio relative to the cytokine expression in CAF.
Results
Immunohistochemical staining
We detected Treg among the tumor‐infiltrating lymphocytes in the tumor stroma and the tumor nest based on the presence of positive nuclear staining for Foxp3. The average number of Treg ranged from 0.0 to 23.0 (mean: 6.0, median: 5.5) per HPF in the stroma. The typical staining results for Treg in the stroma are shown in Figure 1(a,b). In contrast, the average number of Treg in the nest ranged from 0.0 to 6.4 (mean: 0.4, median: 0) per HPF. The typical staining results for Treg in the nest are shown in Figure 1(c,d). Clearly, the absolute number of Treg was much higher in the stroma than in the nest (P < 0.01) (Fig. 1e).
Figure 1.
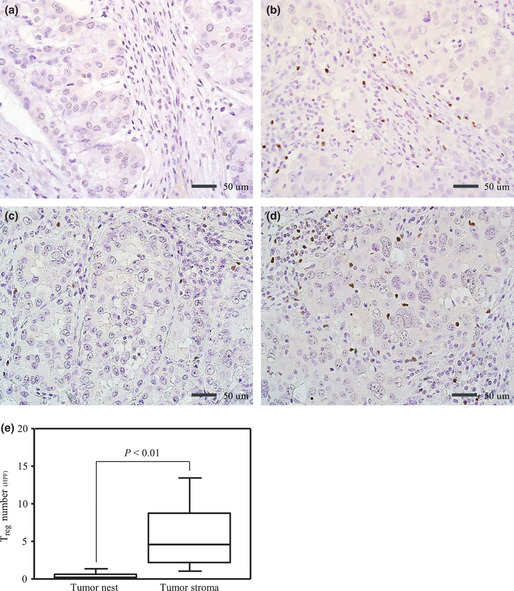
Representative immunohistochemical findings for Forkhead box P3 (Foxp3+) expression in lymphocytes: (a) low Treg in the stroma, (b) high Treg in the stroma, (c) low Treg in the nest, and (d) high Treg in the nest. (e) Comparison of Treg counts in the nest and the stroma. All analyses were performed using the Mann–Whitney U‐test. Treg, regulatory T cells.
Correlations between number of Treg and clinicopathological features
The study cohort included 88 men and 112 women, with a median of age of 65 years (range: 20–84 years, SD: 9.5 years). Five (2.5%) underwent a pneumonectomy and 195 (97.5%) underwent a lobectomy. The follow‐up periods ranged from 3 to 87 months (median follow‐up for surviving patients: 73 months).
We examined the clinicopathological characteristics of the cases according to the Treg number in the tumor stroma and tumor nest. To assess the correlation between the clinicopathological characteristics and the Treg number, we divided the patients into two groups according to their mean Treg count (6/HPF). The group in which the Treg count in the stroma was lower than 6/HPF (n = 107) was the low Treg group, and the group with a Treg count of 6/HPF or higher (n = 93) was the high Treg group. The mean number of Treg in the nest was 0.4/HPF, which was much lower than that in the stroma. The group in which the Treg count in the nest was lower than 0.4/HPF (n = 124) was the low Treg group, and the group with a Treg count of 0.4/HPF or higher (n = 76) was the high Treg group. For the stroma data, a large tumor diameter (P = 0.04), a high serum carcinoembryonic antigen level (P = 0.03), the presence of vascular invasion (P < 0.01), and the presence of pleural invasion (P < 0.01) were significantly more common among the high Treg group than among the low Treg group. For the nest data, a significant difference in vascular invasion (P = 0.03) was noted between the two groups, but no apparent differences in the tumor diameter, lymphatic permeation, or pleural invasion were seen (Table 1).
Table 1.
Correlation between Treg number and clinicopathological factors
| Stroma | Nest | |||||
|---|---|---|---|---|---|---|
| Low Treg | High Treg | P‐value | Low Treg | High Treg | P‐value | |
| n = 107 (%) | n = 93 (%) | n = 124 (%) | n = 76 (%) | |||
| Sex | ||||||
| Men | 48 (44.9) | 40 (43.0) | 0.89 | 54 (43.5) | 34 (44.7) | 0.88 |
| Women | 59 (55.1) | 53 (57.0) | 70 (56.5) | 42 (55.3) | ||
| Age (year) | ||||||
| <65 | 51 (47.7) | 55 (59.1) | 0.12 | 67 (54.0) | 39 (51.3) | 0.77 |
| ≥65 | 56 (52.3) | 38 (40.9) | 57 (46.0) | 37 (48.7) | ||
| Smoking status | ||||||
| Never | 50 (46.7) | 47 (50.5) | 0.67 | 60 (48.4) | 36 (47.4) | >0.99 |
| Ever | 57 (53.3) | 46 (49.5) | 64 (51.6) | 40 (52.6) | ||
| Tumor diameter (cm) | ||||||
| ≤3 | 84 (78.5) | 60 (64.5) | 0.04 | 90 (72.6) | 54 (71.1) | 0.87 |
| >3 | 23 (21.5) | 33 (35.5) | 34 (27.4) | 22 (28.9) | ||
| Serum CEA (ng/mL) | ||||||
| <5 | 83 (77.6) | 59 (63.4) | 0.03 | 95 (76.6) | 47 (61.8) | 0.07 |
| ≥5 | 24 (22.4) | 34 (36.6) | 29 (23.4) | 29 (38.2) | ||
| Lymphatic permeation | ||||||
| Negative | 101 (94.4) | 80 (86.0) | 0.05 | 114 (91.9) | 67 (88.2) | 0.45 |
| Positive | 6 (5.6) | 13 (14.0) | 10 (8.1) | 9 (11.8) | ||
| Vascular invasion | ||||||
| Negative | 93 (86.9) | 59 (63.4) | <0.01 | 101 (81.5) | 51 (67.1) | 0.03 |
| Positive | 14 (13.1) | 34 (36.6) | 23 (18.5) | 25 (32.9) | ||
| Pleural invasion | ||||||
| Negative | 99 (92.5) | 69 (74.2) | <0.01 | 109 (87.9) | 59 (77.6) | 0.07 |
| Positive | 8 (7.5) | 24 (25.8) | 15 (12.1) | 17 (22.4) | ||
Two‐category comparison was performed using the Pearson's χ2. CEA; carcinoembryonic antigen; Treg, regulatory T cells.
Comparison of Treg number in the stroma according to predominant histological subtypes
To examine the difference in the Treg number according to the predominant histologic subtype, we divided the cases into four groups: bronchioloalveolar carcinoma, papillary, acinar, and solid (Fig. 2). A difference in the Treg number between the predominantly papillary tumors (n = 83, range: 0.2–27.4, mean: 6.7, median: 5.4) and the predominantly acinar tumors (n = 14, range: 1.0–14.4, mean: 6.9, median: 6.4) was not apparent (P = 0.79). However, the Treg number in the predominantly bronchioloalveolar carcinoma tumors (n = 79, range: 0.2–22.9, mean: 4.0, median: 2.6) was much lower than that in the other histological types (P < 0.01), and that in the predominantly solid tumors (n = 24, range: 3.6–22.4, mean: 11.8, median: 11.6) was significantly higher than those in the other groups (P = 0.01). In the tumor nest, these differences could not be observed (data not shown).
Figure 2.
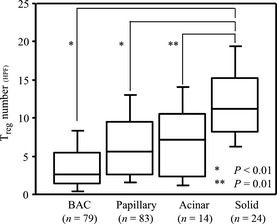
Comparison of Treg number in the stroma between predominant histological subtypes. All analyses were performed using the Mann–Whitney U‐test. BAC, bronchioloalveolar carcinoma; Treg, regulatory T cells.
Survival analysis according to number of Treg in the tumor stroma
Figure 3(a) shows the OS curves according to the results of the Treg count (high Treg vs low Treg) in the tumor stroma. The 5‐year OS rates of the high Treg and low Treg groups were 85.4% and 93.0%, respectively. The OS of the high Treg group was significantly shorter than that of the low Treg group (P = 0.03). Also, RFS curves were plotted according to the results of the Treg count (Fig. 3b). The 5‐year RFS rates of the high Treg and low Treg groups were 76.5% and 87.0%, respectively. The RFS of the high Treg group was significantly shorter than that of the low Treg group (P = 0.02).
Figure 3.

Kaplan–Meier (a) overall survival curve and (b) recurrence‐free survival curve for patients with p‐stage I invasive lung adenocarcinoma according to the Treg number in the stroma. The log‐rank test was used for all the survival analyses. OS, overall survival; RFS, recurrence free survival; Treg, regulatory T cells.
Induction of Treg from naive CD4+ T cells by CAF
Because we found that the tumor stroma, which is mainly composed of CAF, was the main location of the Treg, we investigated whether soluble factors secreted by CAF influenced the induction of Treg. We selected CAF from 12 cases: six from low Treg adenocarcinomas and six from high Treg adenocarcinomas (Fig. 4a). Next, we cultured the naive T cells according to the above‐described method using supernatant samples from these CAF. The results are shown in Figure 4(b). Compared with the low Treg CAF, a significantly higher number of Foxp3+ T cells were induced by the supernatant from the high Treg CAF (P = 0.01).
Figure 4.
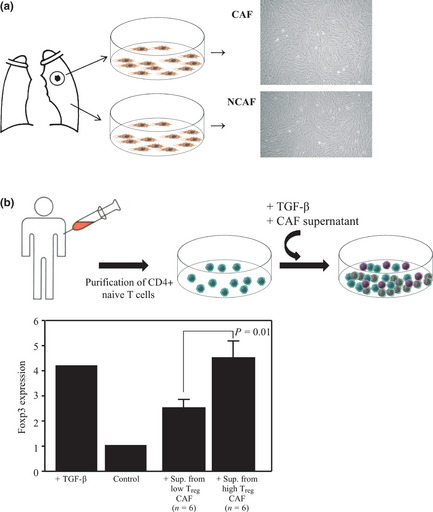
(a) CAF and NCAF were prepared from human lung cancer tissue and non‐cancerous lung tissue obtained from the same samples. After 10 to 20 days of growth, the fibroblasts were cultured as previously reported. (b) Induction of Treg from naive CD4+ T cells by CAF. We selected CAF and cultured the naive T cells according to the above‐described method using supernatant samples from 12 cases: six from low Treg adenocarcinomas and six from high Treg adenocarcinomas. CAF, cancer‐associated fibroblasts; NCAF, non‐cancer‐associated fibroblasts; Sup., supernatant; TGF‐β, transforming growth factor‐β; Treg, regulatory T cells.
Correlations between number of Treg and mRNA levels of immunoregulatory cytokines in CAF
We examined whether a correlation was present between the Treg number in the tumor stroma and the CAF‐induced expression levels of immunoregulatory cytokines. RNA samples from cultured fibroblasts isolated from lung cancer tissue (CAF) in 12 adenocarcinoma patients were analyzed by RT‐PCR. The results are shown in Figure 5. The relative TGF‐β expression levels (median ± SD) induced by the CAF were 1.8 ± 0.4 in the high Treg group and 0.9 ± 0.5 in the low Treg group. In the same way, the relative VEGF expression levels induced by the CAF were 2.6 ± 1.1 in the high Treg group and 1.0 ± 0.4 in the low Treg group. The relative interleukin‐10 expression levels induced by the CAF were 1.9 ± 3.2 in the high Treg group and 1.0 ± 1.2 in the low Treg group. The relative COX‐2 expression levels induced by the CAF were 1.9 ± 3.2 in the high Treg group and 1.0 ± 1.3 in the low Treg group. No apparent difference in the expression levels of interleukin‐10 (P = 0.52) or COX‐2 (P = 0.78) were seen, but significant differences in the TGF‐β (P = 0.01) and VEGF (P = 0.01) levels were detected between the two groups.
Figure 5.

Relative expression levels of immunoregulatory cytokines expressed by CAF (CAF/NCAF). Total RNA was purified from thawed samples, and cDNA was synthesized. All the analyses were performed using the Student's t‐test. CAF, cancer‐associated fibroblasts; IL‐10, interleukin‐10; NCAF, non‐cancer‐associated fibroblasts; TGF‐β, transforming growth factor‐β; Treg, regulatory T cells; VEGF, vascular endothelial growth factor.
Discussion
The accumulation of tumor‐infiltrating Treg has been reported to be an unfavorable prognostic marker in several types of carcinomas.4, 5, 6, 7, 8 Petersen et al. reported that infiltrating Treg were associated with the recurrence of pathological stage I NSCLC, but they did not mention the influence of Treg on overall survival.7 We first found that the Treg number in the tumor stroma was a significant indicator of a poor outcome with regard to overall, recurrence‐free and disease‐specific survival in p‐stage I lung adenocarcinoma. Although the Treg number was not an independent prognostic factor in multivariate analysis (data not shown), the presence of Treg in the tumor stroma may encourage an unfavorable prognosis in patients with lung adenocarcinoma.
Growing evidence suggests that Treg play an important role in suppressing T cell‐mediated immunity in patients with cancer.17, 18 The number of Treg in the tumor stroma was much larger than in the tumor nest. Commonly, CAF are located in the stroma and are distinctively detected in invasive carcinomas, including NSCLC. Therefore, we focused on the relationship between Treg and the characteristics of CAF. We first hypothesized that cytokines secreted by CAF may have an important role in Treg induction in the stroma, and we examined whether Treg could be induced by soluble factors secreted by CAF derived from high Treg and low Treg adenocarcinomas. Compared with the low Treg CAF, the high Treg CAF induced a significantly larger number of Treg from CD4+ naive T cells. Furthermore, we examined the expression of four kinds of immunoregulatory cytokines from 12 adenocarcinoma cases. The expressions of TGF‐β and VEGF, which reportedly induce Treg from naive T cells in the periphery,19, 20 were significantly higher in the CAF from high Treg adenocarcinomas than in the CAF from low Treg adenocarcinomas. CAF are known to produce mainly TGF‐β and VEGF, compared with cancer cells.21, 22 We suggest that the CAF in high Treg adenocarcinomas may have a higher immunoregulatory cytokine‐secreting capacity, leading to Treg induction. Although we did not evaluate the influence of cytokine expression from tumor cells and tumor‐associated macrophages in the present study. Saji et al. confirmed that tumor‐infiltrating stromal cells were major sources of TGF‐β based on the results of an immunohistochemical analysis in NSCLC.23 Thus, the characteristics of CAF may have a great influence on tumor progression via the recruitment of other types of tumor‐promoting stromal cells. There have been no reports demonstrating the correlation between the Treg induction/recruitment and characteristics of CAF. It is well‐known that cytokines, other than TGF‐β and VEGF, are also concerned with the Treg induction. Examining the gene expression profile through microchip analysis will be helpful for elucidating which cytokines are upregulated in high Treg CAF.
Recently, Miyao et al. reported that there was a minor population of non‐regulatory Foxp3+ T cells exhibiting promiscuous and transient Foxp3 expression that were induced from the naive T cells in the peripheral lymph nodes.24 In order to demonstrate whether these induced Foxp3+ T cells have immunoregulatory function, we would need to divide induced Treg into groups according to CD25 expression levels and compare the immunosuppressive ability thereafter. In the current study, we did not examine the influence of chemokines. In the tumor microenvironment, there are many kinds of stromal cells such as macrophages and monocytes. It is possible these stromal cells educate CAF, which could create some chemokines and the Treg‐abundant microenvironment.
In lung cancer, Tao et al. reported the influence of Treg in tumor stroma on OS and RFS, but did not mention the correlation between the Treg count and tumor malignant parameters.6 In the current study, we found that the high Treg group, more frequently than the low Treg group, had predictors of a poor outcome such as a large tumor diameter, vessel invasion, and pleural invasion. These differing results may have occurred because we examined Treg in all stage of NSCLC, including squamous cell carcinomas and large cell carcinomas.
Additionally, the impact of the histological features of lung adenocarcinomas on Treg accumulation has not been previously reported. In this study, the Treg count was highest among patients with a predominantly solid adenocarcinoma subtype. Lung adenocarcinoma patients with a solid adenocarcinoma component are known to have a poorer prognosis than patients without this component.25 The tumor microenvironment of a solid component probably recruits and induces more Treg than other histological subtypes, enabling both the tumor cells to evade the immune system and the tumor to progress easily. Thus, we suggest that tumor cells acquire the ability to survive and metastasize as a result of a tolerance in antitumor immunity induced by Treg in the tumor stroma as the tumor progresses.
In conclusion, we showed that lung adenocarcinoma with a large number of Treg in the tumor stroma was associated with a poor outcome among patients with p‐stage I lung adenocarcinoma after complete resection. Additionally, CAF overexpressing immunoregulatory cytokines, such as TGF‐β and VEGF, may play an important role in Treg induction. Recently, numerous reports have described the treatment of patients with colorectal cancer, breast cancer, or lung cancer using humanized monoclonal anti‐VEGF antibody therapy (bevacizumab). To confirm the effectiveness of anti‐VEGF antibody as an adjuvant therapy in patients with abundant Treg in the tumor stroma, further studies are needed to elucidate the relationship between Treg and CAF. Understanding this relationship will enable the creation of efficacious follow‐up plans and improved therapeutic options for patients.
Disclosure Statement
The authors have no conflict of interest.
Acknowledgments
We thank Hiroko Hashimoto for technical support. This work was supported by a Grant‐in‐Aid for Cancer Research (19‐10) from the Ministry of Health, Labour and Welfare (Tokyo, Japan), the Foundation for the Promotion of Cancer Research, 3rd‐Term Comprehensive 10‐Year Strategy for Cancer Control, National Cancer Center Research and Development Fund (Tokyo, Japan), and JSPS KAKENHI (24659185, Tokyo, Japan) respectively.
(Cancer Sci 2013; 104: 409–415)
References
- 1. Jemal A, Siegel R, Ward E, Hao Y, Xu J, Thun MJ. Cancer statistics, 2009. CA Cancer J Clin 2009; 59: 225–49. [DOI] [PubMed] [Google Scholar]
- 2. Pisters KM, Evans WK, Azzoli CG et al Cancer Care Ontario and American Society of Clinical Oncology adjuvant chemotherapy and adjuvant radiation therapy for stages I‐IIIA resectable non small‐cell lung cancer guideline. J Clin Oncol 2007; 25: 5506–18. [DOI] [PubMed] [Google Scholar]
- 3. Johansson M, Denardo DG, Coussens LM. Polarized immune responses differentially regulate cancer development. Immunol Rev 2008; 222: 145–54. [DOI] [PMC free article] [PubMed] [Google Scholar]
- 4. Hiraoka N, Onozato K, Kosuge T, Hirohashi S. Prevalence of FOXP3+ regulatory T cells increases during the progression of pancreatic ductal adenocarcinoma and its premalignant lesions. Clin Cancer Res 2006; 12: 5423–34. [DOI] [PubMed] [Google Scholar]
- 5. Bates GJ, Fox SB, Han C et al Quantification of regulatory T cells enables the identification of high‐risk breast cancer patients and those at risk of late relapse. J Clin Oncol 2006; 24: 5373–80. [DOI] [PubMed] [Google Scholar]
- 6. Tao H, Mimura Y, Aoe K et al Prognostic potential of FOXP3 expression in non‐small cell lung cancer cells combined with tumor‐infiltrating regulatory T cells. Lung Cancer 2012; 75: 95–101. [DOI] [PubMed] [Google Scholar]
- 7. Petersen RP, Campa MJ, Sperlazza J et al Tumor infiltrating Foxp3+ regulatory T‐cells are associated with recurrence in pathologic stage I NSCLC patients. Cancer 2006; 107: 2866–72. [DOI] [PubMed] [Google Scholar]
- 8. Shimizu K, Nakata M, Hirami Y, Yukawa T, Maeda A, Tanemoto K. Tumor‐infiltrating Foxp3+ regulatory T cells are correlated with cyclooxygenase‐2 expression and are associated with recurrence in resected non‐small cell lung cancer. J Thorac Oncol 2010; 5: 585–90. [DOI] [PubMed] [Google Scholar]
- 9. Fontenot JD, Gavin MA, Rudensky AY. Foxp3 programs the development and function of CD4+CD25+ regulatory T cells. Nat Immunol 2003; 4: 330–6. [DOI] [PubMed] [Google Scholar]
- 10. Sakaguchi S, Miyara M, Costantino CM, Hafler DA. FOXP3+ regulatory T cells in the human immune system. Nat Rev Immunol 2010; 10: 490–500. [DOI] [PubMed] [Google Scholar]
- 11. Ishii G, Sangai T, Ito T et al In vivo and in vitro characterization of human fibroblasts recruited selectively into human cancer stroma. Int J Cancer 2005; 117: 212–20. [DOI] [PubMed] [Google Scholar]
- 12. Kalluri R, Zeisberg M. Fibroblasts in cancer. Nat Rev Cancer 2006; 6: 392–401. [DOI] [PubMed] [Google Scholar]
- 13. Bremnes RM, Donnem T, Al‐Saad S et al The role of tumor stroma in cancer progression and prognosis: emphasis on carcinoma‐associated fibroblasts and non‐small cell lung cancer. J Thorac Oncol 2011; 6: 209–17. [DOI] [PubMed] [Google Scholar]
- 14. Xing F, Saidou J, Watabe K. Cancer associated fibroblasts (CAFs) in tumor microenvironment. Front Biosci 2010; 15: 166–79. [DOI] [PMC free article] [PubMed] [Google Scholar]
- 15. Hoshino A, Ishii G, Ito T et al Podoplanin‐positive fibroblasts enhance lung adenocarcinoma tumor formation: podoplanin in fibroblast functions for tumor progression. Cancer Res 2011; 71: 4769–79. [DOI] [PubMed] [Google Scholar]
- 16. Ishii G, Hashimoto H, Asada K et al Fibroblasts associated with cancer cells keep enhanced migration activity after separation from cancer cells: a novel character of tumor educated fibroblasts. Int J Oncol 2010; 37: 317–25. [DOI] [PubMed] [Google Scholar]
- 17. Gajewski TF, Meng Y, Blank C et al Immune resistance orchestrated by the tumor microenvironment. Immunol Rev 2006; 213: 131–45. [DOI] [PubMed] [Google Scholar]
- 18. Beyer M, Schultze JL. Regulatory T cells in cancer. Blood 2006; 108: 804–11. [DOI] [PubMed] [Google Scholar]
- 19. Zhang L, Yi H, Xia XP, Zhao Y. Transforming growth factor‐beta: an important role in CD4+CD25+ regulatory T cells and immune tolerance. Autoimmunity 2006; 39: 269–76. [DOI] [PubMed] [Google Scholar]
- 20. Wada J, Suzuki H, Fuchino R et al The contribution of vascular endothelial growth factor to the induction of regulatory T‐cells in malignant effusions. Anticancer Res 2009; 29: 881–8. [PubMed] [Google Scholar]
- 21. Dong J, Grunstein J, Tejada M et al VEGF‐null cells require PDGFR alpha signaling‐mediated stromal fibroblast recruitment for tumorigenesis. EMBO J 2004; 23: 2800–10. [DOI] [PMC free article] [PubMed] [Google Scholar]
- 22. Nakagawa H, Liyanarachchi S, Davuluri RV et al Role of cancer‐associated stromal fibroblasts in metastatic colon cancer to the liver and their expression profiles. Oncogene 2004; 23: 7366–77. [DOI] [PubMed] [Google Scholar]
- 23. Saji H, Nakamura H, Awut I et al Significance of expression of TGF‐beta in pulmonary metastasis in non‐small cell lung cancer tissues. Ann Thorac Cardiovasc Surg 2003; 9: 295–300. [PubMed] [Google Scholar]
- 24. Miyao T, Floess S, Setoguchi R et al Plasticity of Foxp3+ T cells reflects promiscuous Foxp3 expression in conventional T cells but not reprogramming of regulatory T cells. Immunity 2012; 36: 262–75. [DOI] [PubMed] [Google Scholar]
- 25. Ohtaki Y, Yoshida J, Ishii G et al Prognostic significance of a solid component in pulmonary adenocarcinoma. Ann Thorac Surg 2011; 91: 1051–7. [DOI] [PubMed] [Google Scholar]