

Abstract
Achaete scute‐like 2 (ASCL2), a basic helix‐loop‐helix transcription factor, plays an essential role in the maintenance of adult intestinal stem cells. However, the function of ASCL2 in gastric cancer (GC) is poorly understood. Therefore, we investigated the roles and regulatory transcription mechanisms of ASCL2 in GC. Gene expression and methylation data analysis showed that ASCL2 was upregulated and hypomethylated in GC tissues. Using real‐time RT‐PCR and pyrosequencing analysis, we confirmed that ASCL2 was overexpressed and hypomethylated in GC tissues compared to adjacent normal tissues. We then investigated the mechanisms underlying the aberrant expression of ASCL2 in GC and found that treatment with a methylation inhibitor induced ASCL2 expression in GC cell lines. MBD‐sequencing assay also revealed hypermethylation of the promoter region of ASCL2 in GC cell lines, which barely expressed the ASCL2 gene. Furthermore, ASCL2 expression levels were inversely correlated with GC patient survival. Ectopic overexpression of ASCL2 showed that ASCL2 increased cell growth and promoted resistance to 5‐fluorouracil in GC cells. These results suggest that ASCL2 might play an important role in gastric tumor growth and chemoresistance, and could be a useful prognostic marker for GC patients.
Gastric cancer (GC) is the second most common cause of cancer‐related death in the world. The incidence rate of GC is highest in East Asia, Eastern Europe and parts of Latin America.1 However, the precise mechanisms underlying gastric carcinogenesis are not yet fully understood.2 One of the most important hallmarks of tumor development and progression is DNA methylation.3 While the role of hypermethylation in the silencing of tumor suppressor genes is well‐documented,4 recent works have also shown that hypomethylation contributes to tumor progression in numerous types of human cancer, including GC.5, 6 DNA methylation is also a dynamic epigenetic indicator that undergoes extensive changes during differentiation of self‐renewing stem cells and is responsible for the regulation of expression of some stem cell markers, such as CD133,7 OCT4 and NANOG.8
The achaete scute‐like 2 (ASCL2) gene is a member of the basic helix‐loop‐helix (bHLH) family of transcription factors, which initiates transcription by binding to the E‐box.9 It is involved in the determination of neuronal precursors in both the peripheral and central nervous systems.10 It is also a cancer stem cell (CSC) marker,11 and some reports have revealed that ASCL2 promotes cell growth and migration in colon cancer.12, 13 The CSC is a fundamental concept in tumor biology and presents a new cellular target for anticancer drug development. Currently, methods to eradicate CSC include blocking self‐renewal signaling, inhibiting the survival of those cells, and targeting CSC surface markers.14 Lung tumor CD133+ cells are highly tumorigenic, endowed with stem‐like features and are spared by cisplatin treatment.15 Ectopic expression of OCT4 and NANOG in lung cancer cells increases the CD133+ subpopulation and sphere formation and enhances drug resistance.16 Therefore, targeting transcription factors related to CSC might be an effective method for increasing the sensitivity to anticancer drugs.
In this study, we examine the transcriptional regulatory mechanisms of ASCL2 and its role in GC. Using the GENT database and other sources to mine gene methylation data, we identified ASCL2 as both overexpressed and hypomethylated in GC patients. Finally, we explored the effects of ASCL2 overexpression on GC cell growth and resistance to anticancer drugs.
Materials and Methods
Cell lines and tissue samples
Gastric cancer cell lines were cultured in complete RPMI 1640 medium. All cell lines were obtained from the Korean Cell Line Bank (http://cellbank.snu.ac.kr/index.htm), and all complete media contained 10% FBS (HyClone, Thermo Scientific, Rockford, IL, USA), 100 U/mL penicillin/streptomycin (Invitrogen, Carlsbad, CA, USA), 2 mM l‐glutamine and 0.5 mM HEPES. A total of 114 tumors were collected from Chungnam National University Hospital. All samples were obtained with informed consent, and the Internal Review Board at Chungnam National University Hospital approved their use.
Real‐time RT‐PCR and western blots
Real‐time RT‐PCR and western blots were carried out as described previously (for details see Supporting Information).6
ASCL2 stable cell line
Human ASCL2 cDNA was amplified from the cDNA of GC tissue using the following primers: 5′‐ATA AGC TTA TGG ACG GCG GCA CAC TGC‐3′ (sense) and 5′‐ ATC TCG AGT CAG TAG CCC CCT AAC CAG‐3′ (antisense). This PCR product was then subcloned into the HindIII/XhoI sites of the pcDNA3.1(+) vector (Invitrogen), and the ASCL2 sequence was verified by sequencing. ASCL2 expression plasmids were transfected into MKN‐1 cells using Lipofectamine Plus (Invitrogen) according to the manufacturer's protocol. Transfected cells were cultured for 2 days before selection in complete media with 500 μg/mL of G418. ASCL2 mRNA and protein levels were assessed by RT‐PCR and western blot analysis, respectively.
MBD‐sequencing
Genomic DNA (5 μg) was fragmented at 44 psi for 1 min with a nebulizer (Illumina, San Diego, CA, USA) and then subjected methylated DNA enrichment using the MethylMiner methylated DNA enrichment kit (Invitrogen).
Briefly, methylated DNA was precipitated from the fragmented genomic DNA (1 μg) via binding to the methyl‐CpG‐binding domain of human MBD2 protein coupled to magnetic Dynabeads. The methylated fragments were then eluted with 2 M NaCl elution buffer (Invitrogen) and purified with the Qiagen (Valencia, CA, USA) MinElute PCR Purification Kit. Purified methylated DNA was then processed to generate a library for sequencing with an Illumina Genome Analyzer. These sequencing libraries were generated using the ChIP‐Seq Sample prep kit (Illumina). Finally, the resulting sequences were mapped to the human genome using ELAND from the Genome Analyzer data analysis pipeline. The sequencing data were visualized as a custom track in the University of California, Santa Cruz Genome Browser. The peaks are in regions that show high density of methylated cytosines, and troughs are in regions with low density of methylated cytosines.
Pyrosequencing analysis
The promoter region of ASCL2 (−795 to −667 upstream of transcription start site) was amplified using primers designed by PSQ Assay Design (Biotage AB, Kungsgatan, Sweden). Pyrosequencing was performed as described previously.6 The primer sequences are shown in Table S1.
5‐aza‐2′‐deoxycitidine (5‐Aza‐dC) treatment
For 5‐aza‐dC treatment, cells were seeded at a density of 1 × 10⁶ cells/100 mm dish, then treated 24 h later with 2 μM of 5‐Aza‐dC (Sigma‐Aldrich, Taufkirchen, Germany). Incubation with 5‐Aza‐dC continued for 4 days with media changes at 2‐day intervals.
Cell proliferation and anchorage‐dependent colony formation
The cell proliferation assay was performed using a Cell‐Counting Kit‐8 (Dojindo, Kumamoto, Japan). Cells were harvested and plated in 96‐well plates and maintained at 37°C in a humidified incubator. At the indicated time points, we added CCK‐8 solution into the wells, incubated the solution, and then measured the absorbance at 450 nm to determine the number of vital cells in each well. To examine the long‐term effects, we seeded the cells in a 6‐well plate using complete medium and cultured them for 14 days at 37°C. After the indicated time period, the cells were washed with PBS, fixed in 70% ethanol, and finally stained using crystal violet.
Caspase‐3/7 assay
MKN‐1 cells were seeded in 96‐well plates and treated with 5‐FU (10 μg/mL). After 48 h of treatment, the cells were washed once with 1× PBS, trypsinized, washed again with 1× PBS, and then resuspended in PBS. Cells were mixed with caspase‐Glo‐3/7 reagent (Promega, Madison, WI, USA) and incubated for 1 h at room temperature with agitation. The luciferase activity was measured using a luminometer and then normalized according to protein concentration.
Bisulfite sequencing
Genomic DNA (1 μg) was modified by sodium bisulfite using the EZ DNA Methylation kit (ZYMO Research, Irvine, CA, USA) according to the manufacturer's instructions. Bisulfite‐modified DNA was amplified using a primer set targeted to the region of interest. Next, these PCR products were cloned using the pGEM‐T Easy Vector (Promega). Clones were randomly chosen for sequencing.
Immunohistochemistry
Immunostainings of ASCL2 were performed on mixed human gastric tissues (n = 10) containing normal and tumor regions using the labeled streptavidin‐biotin method after microwave antigen retrieval. Briefly, the formalin‐fixed, paraffin‐embedded 4 μm‐thick sections were dewaxed in xylene, rehydrated through graded alcohol, and placed in an endogenous peroxide block for 15 min. Sections were then washed in water before antigen retrieval, placed in a citrate buffer, and microwaved for 10 min. Diluted anti‐ASCL2 monoclonal antibody (1:100) was then applied, and antibody binding was detected using an avidin–biotin–peroxidase complex kit (Vextor Laboratories, Burlingame, CA, USA) using diaminobenzidine tetrahydrochloride solution (Biogenex, San Ramon, CA, USA).
Statistical analysis
Statistical analyses of group differences were performed using Student's t‐test. A P‐value <0.05 was considered significant. The following parameters were obtained from the medical records of the 114 patients studied: age, gender, histology, lymph node metastasis, tumor stage and Helicobacter pylori infection. Statistical analyses of correlation between expression and methylation were performed using the R statistical programming language (http://cran.r-project.org/).
Results
Negative correlation between methylation and gene expression of ASCL2 in gastric camcer tissues
We first investigated the expression level of ASCL2 in GC using the GENT database,17 and observed ASCL2 upregulation in tumor tissues compared to normal samples (Fig. S1A). ASCL2 promoter is known to be a target of CpG methylation.12 To inspect the methylation status of ASCL2, we collected human tissue methylation datasets from public resources, and created a methylation database named MENT (submitted; currently available at http://mgrc.kribb.re.kr:8080/MENT/). ASCL2 methylation was inversely correlated with ASCL2 expression in gastric normal or tumor tissues, suggesting a negative correlation between the expression and methylation of ASCL2 (Fig. S1B). To confirm this hypothesis, we performed quantitative RT‐PCR and pyrosequencing using GC and adjacent normal tissues for expression and methylation, respectively. As expected, ASCL2 was both upregulated and hypomethylated in tumor tissues compared with the controls (Fig. 1A,B). A majority of patients (66 of 90) showed higher expression levels of ASCL2 mRNA in tumor tissues than in adjacent normal samples. In contrast, a majority of patients (69 of 90) showed a lower methylation status for ASCL2 in tumor tissues than in normal tissues. Immunostaining also showed that ASCL2 was expressed in intestinal metaplasia and tumor tissue, but barely in normal regions (Fig. 1C). We assessed whether methylation of the ASCL2 CpG sites was negatively correlated with ASCL2 expression and found a significant relationship (Fig. 1D). This suggests that increases in ASCL2 expression in tumor tissues might be associated with DNA hypomethylation.
Figure 1.
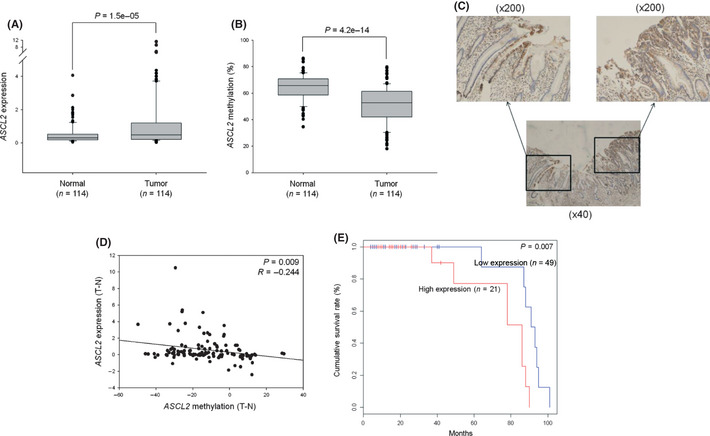
Correlation between expression level and methylation status of ASCL2 in gastric cancer (GC) tissues. (A) Quantitative RT‐PCR for ASCL2 in 114 paired human tumor and adjacent normal tissues. (B) ASCL2 methylation for 114 paired GC and adjacent normal tissues. Pyrosequencing analysis was performed at the three CpG sites of ASCL2 promoter. The boxes are bounded above and below by the 25th and 75th percentiles. The lines in the boxes indicate the median values. (C) ASCL2 immunostaining of gastric tissues. Sections shown are representative of 10 mixed human gastric tissues containing normal and tumor regions. (D) Correlation between the methylation and expression of ASCL2. The x‐axis and y‐axis are the difference in methylation and expression, respectively, between paired tumor and normal tissues (tumor minus normal). (E) A Kaplan–Meier plot of survival for patient groups with high and low levels of ASCL2 mRNA expression in late‐stage (III + IV) GC. Comparison of the two groups was done by log rank test.
We then examined the relationship between ASCL2 expression and survival of GC patients. We first divided the patients into two groups: a group with low ASCL2 expression and the other group with high ASCL2 expression. No significant difference was observed in the overall survival rate between the two groups. Then, we divided the patients into two groups based on tumor stages: early‐stage (I + II) and late‐stage (III + IV), and assessed survival differences within the sub‐groups. Kaplan–Meier survival analysis showed that significant differences in survival existed among late‐stage patients according to ASCL2 expression levels, but not in early‐stage patients (Fig. 1E). We also examined the relationship between ASCL2 methylation and survival of GC patients. However, there was no difference in the survival rate between the two groups (data not shown). We analyzed the correlation between the expression and DNA methylation of ASCL2 and clinicopathological parameters in GC patients. Neither expression nor methylation of ASCL2 were associated other parameters (Tables S2 and S3).
5‐Aza‐dCs restores the expression of ASCL2 gene in gastric cancer cell lines
To investigate whether 5‐Aza‐dCs, an inhibitor of the DNMT enzymes, influences ASCL2 expression, we treated two cell lines (SNU‐601 and MKN‐1) with 5‐Aza‐dCs. The expression of ASCL2 in SNU‐601 and MKN‐1 cells was augmented by 5‐Aza‐dC treatment (Fig. 2A). When we analyzed the methylation status on the ASCL2 promoter by pyrosequencing, both cell lines exhibited strong demethylation after 5‐aza‐dC treatment (Fig. 2B), suggesting that DNA methylation is one of the mechanisms responsible for the expression of the ASCL2 gene. We then performed an MBD‐sequencing assay using the SNU‐601 and SNU‐620 cell lines to examine the methylation status broadly across the ASCL2 promoter. Notably, SNU‐620 expressed very little ASCL2, but the ASCL2 expression was partially restored by 5‐Aza‐dCs treatment (data not shown). These results indicated that the promoter region of ASCL2 in those two ASCL2 silent cell lines was strongly hypermethylated, which was confirmed by bisulfite sequencing (Fig. 2C,D).
Figure 2.
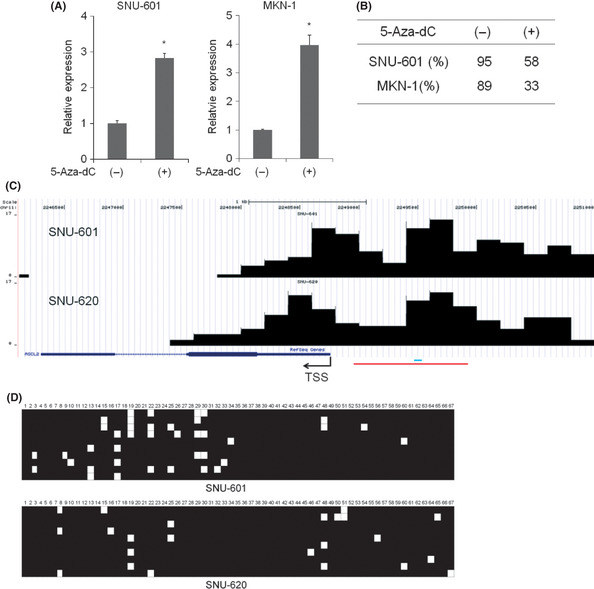
ASCL2 upregulation by 5‐Aza‐dCs treatment in gastric cancer (GC) cells. (A) Cells were treated for 4 days with 2 μM of 5‐Aza‐dC, as described in Materials and Methods. Quantitative RT‐PCR was performed using specific primers for the ASCL2 gene. (B) Pyrosequencing analysis in SNU‐601 and MKN‐1 cells after 5‐Aza‐dC treatment. (C) MBD‐sequencing analysis of cell lines SNU‐601 and SNU‐620. Black bars represent the methylation status. Red and blue lines indicate the bisulfite sequencing and pyrosequencing region, respectively. (D) ASCL2 methylation status was analyzed by bisulfite sequencing in GC cell lines. A total of 67 CG sites exist in the bisulfite sequencing region. Squares represent CpG dinucleotides either unmethylated (open) or methylated (closed).
ASCL2 overexpression promotes the growth of gastric cancer cells
Although aberrant upregulation of ASCL2 was found in tumor tissues, we could not detect ASCL2 protein expression in GC cell lines. Thus, we investigated the effects of ASCL2 via overexpression in GC cells. Recently, it was reported that an ASCL2 blockade in colon cancer cell lines inhibits cell proliferation.13 Therefore, we examined the proliferative role of ASCL2 in GC using ASCL2‐overexpressing cell lines. MKN‐1 cells were transfected with empty vector (Vector) or ASCL2‐expressing vector (ASCL2) and selected with G418. The expression of ASCL2 in mixed clones after selection was estimated by RT‐PCR and western blot analysis (Fig. 3A). We first examined whether ASCL2 overexpression affected cell growth in MKN‐1 cells. The results showed a significant difference in growth between ASCL2‐overexpressing and control cells (Fig. 3B). In the colony‐forming assay, ASCL2 overexpressing cells also established more and larger colonies than control cells (Fig. 3C). We also performed a migration assay, but found no difference in migration between ASCL2 and control‐transfected cell lines (data not shown).
Figure 3.
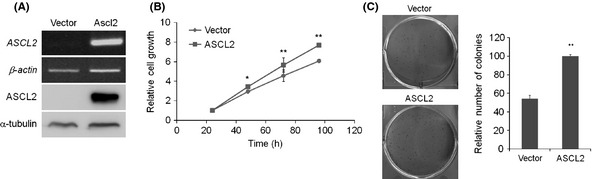
The effect of ASCL2 on cell growth. (A) RT‐PCR (top) and western blot (bottom) analysis of MKN‐1 cells stably expressing ASCL2. (B) Proliferation was measured at 24, 48, 72 and 96 h. The data are presented as the means ± SD of triplicate experiments. (C) Anchorage‐dependent colony formation assay in a monolayer culture. Columns, results of triplicate experiments; error bars, SD. *P < 0.05, **P < 0.01.
ASCL2 promotes resistance to 5‐fluorouracil in gastric cancer cells
To further examine the functional role of ASCL2, cells were treated with 5‐fluorouracil (5‐FU), one of the most effective chemotherapeutic drugs in the GC treatment. Our results showed different susceptibility to the anti‐proliferative effect of 5‐FU. ASCL2 overexpressing cells exhibited better overall survival compared with control cells in a dose‐dependent manner (Fig. 4A). Our data also revealed that cell growth differences were augmented in a time‐dependent manner (Fig. 4B,C). To assess the effect of 5‐FU on apoptosis, caspase activity was also examined. Levels of caspase‐3/7 activity were increased in control cells compared to the ASCL2 overexpressing cells after 5‐FU treatment (Fig. 4D).
Figure 4.
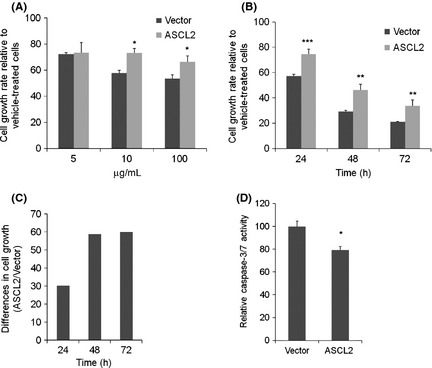
The effect of ASCL2 on resistance to 5‐fluorouracil. (A) MKN‐1 cells were seeded in 96‐well plates, and the cell growth of MKN‐1 cells were analyzed by CCK‐8 reagent after 24 h exposure to the indicated doses of 5‐fluorouracil. (B) Cell growth of MKN‐1 cells were measured at 24, 48 and 72 h after exposure to 5‐fluorouracil (10 μg/mL). (C) Differences (ASCL2 divided by Vector) in cell growth in panel B. (D) A plot of caspase‐3/7 activity normalized to protein concentration in MKN‐1 cells after 48 h exposure to 5‐fluorouracil (10 μg/mL). Columns, results of triplicate experiments; error bars, SD. *P < 0.05, **P < 0.01, ***P < 0.001.
ASCL2 upregulates LGR5 expression at transcriptional level
We investigated whether ASCL2 plays a role in regulating the expression of stemness‐related genes in MKN‐1 cells, as ASCL2 is known to bind to promoters from this group.11, 13 The expressions of a few selected stemness‐related genes were analyzed by real time PCR in ASCL2‐overexpressing and control cells. Among the tested genes, only LGR5 was significantly upregulated by ASCL2 overexpression (Fig. 5A). Transient transfection experiments also showed the induction of LGR5 by ASCL2 overexpression (Fig. 5B). We then investigated the correlation between ASCL2 and LGR5 expression using the GENT database. We observed significant positive correlations between ASCL2 and LGR5 expression in normal and tumor tissues (Fig. 5C,D). The expression of LGR5 in tumors was also higher than that in normal tissues (Fig. 5E). These data suggest that ASCL2 might be an important factor that regulates the expression of LGR5. ASCL2 binds approximately 500 bp upstream from the LGR5 gene transcription start site (TSS) in intestinal cells.11 Hence, we constructed an LGR5 reporter gene containing three E‐box sites, covering approximately 1 kb upstream from the LGR5 gene TSS. However, ASCL2 did not affect the reporter gene activity (data not shown), suggesting that there may be another binding site that is important for LGR5 expression.
Figure 5.
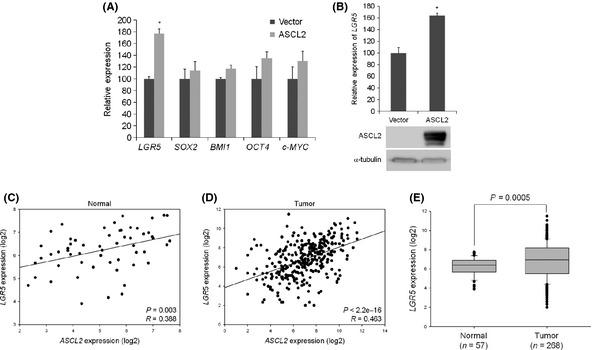
ASCL2 upregulates LGR5 expression at transcriptional level in MKN‐1 cells. (A) Quantitative RT‐PCR analysis of expression of stemness‐related genes in MKN‐1 cells stably expressing ASCL2. (B) Quantitative RT‐PCR (top) and western blot (bottom) analysis of LGR5 and ASCL2 expression in MKN‐1 cells transfected with ASCL2, respectively. (C,D) The comparison of the expression levels of ASCL2 and LGR5 in gastric normal and tumor tissues, respectively, using GENT database. (E) The comparison of the expression levels of LGR5 in gastric normal and tumor tissues. Columns, results of triplicate experiments; error bars, SD. *P < 0.05.
Discussion
ASCL2 is a transcription factor essential for the differentiation of the nervous system.18 Although a few reports have revealed that ASCL2 affects cell growth and migration in colon cancer,12, 13 little is known on the biological roles of ASCL2 and its signaling pathway. Furthermore, little is known about the molecular mechanisms regulating ASCL2 expression in cancer. DNA methylation is an important mechanism for regulating gene expression during cancer progression. Many tumor suppressor genes and oncogenes are regulated in cancers via epigenetic mechanisms.4, 6 There are some clues as to the involvement of epigenetics in ASCL2 expression at transcriptional levels.12, 19 However, those reports do not fully reveal the mechanism of ASCL2 expression. Here, we showed that promoter methylation might be an important mechanism for the increased expression of ASCL2 in tumor tissues. We also found that the ASCL2 promoter region was extensively methylated in GC cell lines, suggesting that this pattern may maintain the expression status of ASCL2.
Cancer stem cells are a very small population of cancer cells in tumor tissues. Primarily, they function as stem cells, with self‐renewal and differentiation potential. CSC play decisive roles in malignancy, metastasis and recurrence.20 Therefore, the development of CSC‐targeted therapies is critical to improving the survival and overall quality of life in cancer patients. Four transcription factors, OCT4, SOX2, KLF4 and c‐MYC, can induce pluripotent stem cells through overexpression, although KLF4 and c‐MYC may be replaced by Lin28 and Nanog.21, 22 These transcription factors are known to be involved in tumor progression. For example, double knockdown of OCT4 and NANOG reverses epithelial‐mesenchymal transition and blocks the tumorigenic and metastatic ability of lung adenocarcinoma.16 SOX2 is also expressed in early stage breast tumors; SOX2 knockdown prevents sphere formation and delays tumor generation.23 Reduced expression of ASCL2 leads to arrest at the G2/M cell cycle checkpoint. Lowered levels of ASCL2 can also lead to colon cancer tumor growth arrest, both in vitro and in vivo.12, 13 Here, we have also shown that ASCL2 overexpression results in increased growth of GC cells.
Cancer stem cells are relatively resistant to commonly used cancer therapies, such as radiation and chemotherapy. Indeed, some groups have demonstrated that CSC or cells expressing stem cell markers exhibit resistance to cancer therapies. Our work has revealed that ASCL2 can induce resistance to 5‐FU in GC cells. Wnt signaling promotes chemoresistance in multiple myeloma and hepatocellular carcinoma cells.24, 25 Breast cancer cells expressing CSC markers are also resistant to radiation, and ectopic expression of Wnt or β‐catenin augments this resistance.26, 27 Recently, a report has noted that the upregulation of Wnt6 using chemotherapeutics enhances the resistance of GC cells to anthracycline drugs.28 ASCL2 is a target of the Wnt pathway, and expression of ASCL2 mRNA is reduced in colon cancer cells transfected with β‐catenin siRNA,12 suggesting that ASCL2 may control one of the important components in Wnt‐mediated chemoresistance. LGR5 is a member of the canonical Wnt pathway cascade and regulates cell proliferation and differentiation. LGR5 also has prognostic and tumor biological significance in GC29, 30 and is associated with increased tumor recurrence.31 Although we have not identified promoter elements in LGR5 regulated by ASCL2, we suggest that LGR5 might be one of the ASCL2 target genes and that cooperation between ASCL2 and LGR5 could be an important component of cell growth and chemoresistance in GC.
In conclusion, we demonstrated that upregulation of ASCL2 expression in GC tissues was accomplished by epigenetic mechanisms. Moreover, high ASCL2 expression was associated with poor prognosis in GC patients. We also explored the effects of ASCL2 overexpression in GC and revealed that overexpression of ASCL2 promoted the growth of GC cells as well as significant resistance to 5‐FU, indicating that ASCL2 is a potential prognostic marker in GC. Although more detailed studies need to be performed to identify the underlying mechanism of ASCL2 effects on GC, the results presented here support the notion that ASCL2 targeting may elevate the efficacy of current GC therapies.
Disclosure Statement
The authors have no conflict of interest to declare.
Supporting information
Fig. S1. The expression and methylation level of ASCL2 in gastric normal and cancer tissues.
Doc. S1. Material and methods details.
Table S1. Primer information.
Table S2. ASCL2 expression in tumors with respect to clinicopathologic characteristics.
Table S3. ASCL2 methylation in tumors with respect to clinicopathologic characteristics.
Acknowledgments
This work was supported by grants from the Basic Science Research Program through the National Research Foundation of Korea (NRF2010‐0008143), which is funded by the Ministry of Education, Science and Technology, the National R&D Program for Cancer Control, the Ministry for Health and Welfare, the Republic of Korea (1020360), and the Korea Research Institute of Bioscience and Biotechnology Research Initiative Grant.
(Cancer Sci, doi: 10.1111/cas.12076, 2013)
References
- 1. Parkin DM, Pisani P, Ferlay J. Estimates of the worldwide incidence of 25 major cancers in 1990. Int J Cancer 1999; 80: 827–41. [DOI] [PubMed] [Google Scholar]
- 2. Yuasa Y. Control of gut differentiation and intestinal‐type gastric carcinogenesis. Nat Rev Cancer 2003; 3: 592–600. [DOI] [PubMed] [Google Scholar]
- 3. Feinberg AP, Tycko B. The history of cancer epigenetics. Nat Rev Cancer 2004; 4: 143–53. [DOI] [PubMed] [Google Scholar]
- 4. Baylin SB. DNA methylation and gene silencing in cancer. Nat Clin Pract Oncol 2005; 2(Suppl. 1): S4–11. [DOI] [PubMed] [Google Scholar]
- 5. Ehrlich M. DNA methylation in cancer: too much, but also too little. Oncogene 2002; 21: 5400–13. [DOI] [PubMed] [Google Scholar]
- 6. Kwon OH, Park JL, Kim M et al Aberrant upregulation of LAMB3 and LAMC2 by promoter demethylation in gastric cancer. Biochem Biophys Res Commun 2011; 406: 539–45. [DOI] [PubMed] [Google Scholar]
- 7. Tabu K, Sasai K, Kimura T et al Promoter hypomethylation regulates CD133 expression in human gliomas. Cell Res 2008; 18: 1037–46. [DOI] [PubMed] [Google Scholar]
- 8. Deb‐Rinker P, Ly D, Jezierski A, Sikorska M, Walker PR. Sequential DNA methylation of the Nanog and Oct‐4 upstream regions in human NT2 cells during neuronal differentiation. J Biol Chem 2005; 280: 6257–60. [DOI] [PubMed] [Google Scholar]
- 9. Massari ME, Murre C. Helix‐loop‐helix proteins: regulators of transcription in eucaryotic organisms. Mol Cell Biol 2000; 20: 429–40. [DOI] [PMC free article] [PubMed] [Google Scholar]
- 10. Miyamoto T, Jinno Y, Sasaki T et al Genomic cloning and localization to chromosome 11p15.5 of the human achaete‐scute homolog 2 (ASCL2). Cytogenet Cell Genet 1996; 73: 312–14. [DOI] [PubMed] [Google Scholar]
- 11. van der Flier LG, van Gijn ME, Hatzis P et al Transcription factor achaete scute‐like 2 controls intestinal stem cell fate. Cell 2009; 136: 903–12. [DOI] [PubMed] [Google Scholar]
- 12. Jubb AM, Chalasani S, Frantz GD et al Achaete‐scute like 2 (ascl2) is a target of Wnt signalling and is upregulated in intestinal neoplasia. Oncogene 2006; 25: 3445–57. [DOI] [PubMed] [Google Scholar]
- 13. Zhu R, Yang Y, Tian Y et al Ascl2 Knockdown results in tumor growth arrest by miRNA‐302b‐related inhibition of colon cancer progenitor cells. PLoS ONE 2012; 7: e32170. [DOI] [PMC free article] [PubMed] [Google Scholar]
- 14. Zhou BB, Zhang H, Damelin M, Geles KG, Grindley JC, Dirks PB. Tumour‐initiating cells: challenges and opportunities for anticancer drug discovery. Nat Rev Drug Discov 2009; 8: 806–23. [DOI] [PubMed] [Google Scholar]
- 15. Bertolini G, Roz L, Perego P et al Highly tumorigenic lung cancer CD133+ cells display stem‐like features and are spared by cisplatin treatment. Proc Natl Acad Sci U S A 2009; 106: 16281–6. [DOI] [PMC free article] [PubMed] [Google Scholar]
- 16. Chiou SH, Wang ML, Chou YT et al Coexpression of Oct4 and Nanog enhances malignancy in lung adenocarcinoma by inducing cancer stem cell‐like properties and epithelial‐mesenchymal transdifferentiation. Cancer Res 2010; 70: 10433–44. [DOI] [PubMed] [Google Scholar]
- 17. Shin G, Kang TW, Yang S, Baek SJ, Jeong YS, Kim SY. GENT: gene expression database of normal and tumor tissues. Cancer Inform 2011; 10: 149–57. [DOI] [PMC free article] [PubMed] [Google Scholar]
- 18. Hermansen SE, Kalstad T, How OJ, Myrmel T. Inflammation and reduced endothelial function in the course of severe acute heart failure. Transl Res 2011; 157: 117–27. [DOI] [PubMed] [Google Scholar]
- 19. de Sousa EMF, Colak S, Buikhuisen J et al Methylation of cancer‐stem‐cell‐associated Wnt target genes predicts poor prognosis in colorectal cancer patients. Cell Stem Cell 2011; 9: 476–85. [DOI] [PubMed] [Google Scholar]
- 20. Reya T, Morrison SJ, Clarke MF, Weissman IL. Stem cells, cancer, and cancer stem cells. Nature 2001; 414: 105–11. [DOI] [PubMed] [Google Scholar]
- 21. Takahashi K, Tanabe K, Ohnuki M et al Induction of pluripotent stem cells from adult human fibroblasts by defined factors. Cell 2007; 131: 861–72. [DOI] [PubMed] [Google Scholar]
- 22. Okita K, Nakagawa M, Hyenjong H, Ichisaka T, Yamanaka S. Generation of mouse induced pluripotent stem cells without viral vectors. Science 2008; 322: 949–53. [DOI] [PubMed] [Google Scholar]
- 23. Leis O, Eguiara A, Lopez‐Arribillaga E et al Sox2 expression in breast tumours and activation in breast cancer stem cells. Oncogene 2012; 31: 1354–65. [DOI] [PubMed] [Google Scholar]
- 24. Noda T, Nagano H, Takemasa I et al Activation of Wnt⁄beta‐catenin signalling pathway induces chemoresistance to interferon‐alpha⁄5‐fluorouracil combination therapy for hepatocellular carcinoma. Br J Cancer 2009; 100: 1647–58. [DOI] [PMC free article] [PubMed] [Google Scholar]
- 25. Kobune M, Chiba H, Kato J et al Wnt3⁄RhoA⁄ROCK signaling pathway is involved in adhesion‐mediated drug resistance of multiple myeloma in an autocrine mechanism. Mol Cancer Ther 2007; 6: 1774–84. [DOI] [PubMed] [Google Scholar]
- 26. Woodward WA, Chen MS, Behbod F, Alfaro MP, Buchholz TA, Rosen JM. WNT⁄beta‐catenin mediates radiation resistance of mouse mammary progenitor cells. Proc Natl Acad Sci USA 2007; 104: 618–23. [DOI] [PMC free article] [PubMed] [Google Scholar]
- 27. Phillips TM, McBride WH, Pajonk F. The response of CD24(– ⁄low)⁄CD44+ breast cancer‐initiating cells to radiation. J Natl Cancer Inst 2006; 98: 1777–85. [DOI] [PubMed] [Google Scholar]
- 28. Yuan G, Regel I, Lian F et al WNT6 is a novel target gene of caveolin‐1 promoting chemoresistance to epirubicin in human gastric cancer cells. Oncogene 2012; doi: 10.1038/onc.2012.40. [DOI] [PubMed] [Google Scholar]
- 29. Reya T, Clevers H. Wnt signalling in stem cells and cancer. Nature 2005; 434: 843–50. [DOI] [PubMed] [Google Scholar]
- 30. Simon E, Petke D, Boger C et al The spatial distribution of LGR5+ cells correlates with gastric cancer progression. PLoS ONE 2012; 7: e35486. [DOI] [PMC free article] [PubMed] [Google Scholar]
- 31. Gerger A, Zhang W, Yang D et al Common cancer stem cell gene variants predict colon cancer recurrence. Clin Cancer Res 2011; 17: 6934–43. [DOI] [PubMed] [Google Scholar]
Associated Data
This section collects any data citations, data availability statements, or supplementary materials included in this article.
Supplementary Materials
Fig. S1. The expression and methylation level of ASCL2 in gastric normal and cancer tissues.
Doc. S1. Material and methods details.
Table S1. Primer information.
Table S2. ASCL2 expression in tumors with respect to clinicopathologic characteristics.
Table S3. ASCL2 methylation in tumors with respect to clinicopathologic characteristics.