

Abstract
Overexpression of atypical protein kinase Cλ/ι (aPKCλ/ι), a regulator of cell polarity, is frequently associated with the poor prognoses of several cancers, including gastric cancer. Recent studies revealed a molecular link between aPKC and KIBRA, an upstream regulator of tumor suppressor Hippo pathway that regulates cell proliferation and apoptosis. Further, KIBRA directly inhibits the kinase activity of aPKC to regulate epithelial cell polarity. These observations suggest that the KIBRA‐aPKC connection plays a role in cancer progression; however, clinical significance of the correlation between these factors remains unclear. Here we examined the correlation between KIBRA/aPKCλ/ι expression, as detected by immunohistochemistry, and clinicopathological outcomes in 164 gastric cancer patients using Fisher's exact test and Kaplan–Meier log‐rank test. We found an intimate correlation between the expression level of KIBRA and aPKCλ/ι (P = 0.012). Furthermore, high expression of KIBRA is correlated with lymphatic (P = 0.046) and venous invasion (P = 0.039). The expression level of KIBRA by itself did not correlate with the prognosis; however, high expression of KIBRA in low aPKCλ/ι‐expressing gastric cancer correlated with disease‐specific (P = 0.037) and relapse‐free survival (P = 0.041) by Kaplan–Meier with log‐rank test and higher lymphatic invasion cases by Fisher's exact test (P = 0.042). Furthermore, overexpression of the aPKC‐binding region of KIBRA disrupted tight junctions in epithelial cells. These results suggest that high expression of KIBRA in low aPKC‐expressing cells causes massive loss of aPKC activity, leading to loss of polarity and invasiveness of gastric cancer cells.
Gastric cancer is the fourth most common cancer and the second highest cause of cancer‐related death in the world.1, 2, 3, 4 Five‐year survival rates for gastric cancer are approximately 20% in most areas of the world, and only 60% in Japan, where an extensive mass screening program has been implemented.5 Although several combined chemotherapeutic regimens have been used for advanced and recurrent cases, their clinical outcomes are still unsatisfactory.6, 7 Therefore, new therapeutic targets, clinical markers and the establishment of more effective therapeutic strategies for gastric cancer are still urgently required.
Loss of epithelial cell polarity is one of the hallmarks of cancer, and recent studies have shown loss of polarity itself can cause malignancy.8, 9, 10, 11, 12 Among the regulators of epithelial cell polarity, a serine/threonine kinase known as atypical protein kinase C (aPKC) plays pivotal roles in the establishment of epithelial cell polarity binding with several partner proteins such as partitioning defective proteins (PARs).13, 14 Overexpression of aPKCλ/ι is observed in several malignancies, including non‐small cell lung, ovarian, colon, breast and prostate cancers and glioma.15, 16, 17, 18, 19, 20 We previously reported that high expression of aPKCλ/ι has been suggested as a prognostic factor for recurrence of gastric cancer.21 In contrast, downregulation of aPKCλ/ι has also been observed in several cancers.16, 22 Overactivation and/or inactivation of aPKCλ/ι can cause loss of polarity in several biological contexts,23, 24, 25 suggesting that precise control of the amount or activity of aPKCλ/ι is crucial in the progression of a variety of cancers. The activity of aPKC is regulated by its binding partner proteins; however, little is known about the expression level of these in gastric cancer tissue.
We have recently found that one of the aPKC‐binding partners, KIBRA,26, 27 regulates the activity of aPKC through competitive inhibition during development of epithelial cell polarity.28 KIBRA has also been suggested as a potential tumor suppressor gene acting as an upstream regulator of the Hippo pathway in Drosophila.29, 30, 31 Epigenetic inactivation of KIBRA is associated with B‐cell acute lymphocytic leukemia cell lines.32 However, the correlation between the expression level of KIBRA and cancer progression in cancer patients remains to be evaluated.
Here, we examined the expression levels of KIBRA in gastric cancer specimens, in which aPKCλ/ι‐expression has already been examined.21 We found an intimate correlation between the expression levels of KIBRA and aPKCλ/ι. Furthermore, high expression of KIBRA correlated with lymphovascular invasion. Although KIBRA expression alone did not correlate with prognosis, high expression of KIBRA in low aPKCλ/ι‐expressing gastric cancer correlated with poor prognosis and marked lymphatic invasion cases. Furthermore, the overexpression of aPKC‐binding region of KIBRA disrupted tight junction formation in epithelial cells. These results suggest that high expression of KIBRA in low aPKC‐expressing cells causes massive loss of aPKC activity, leading to loss of polarity and enhanced invasive behavior in gastric cancer tissues.
Materials and Methods
Patients
This study included 164 patients who underwent resection of gastric cancer between January 1999 and December 2004 at the Department of Gastroenterological Surgery, Yokohama City University Hospital, Yokohama, Japan.21 Patients who received preoperative chemotherapy were excluded from this study. All the patients were followed up after surgery at 3–6 month intervals, and were evaluated for disease recurrence by examining tumor markers, by endoscopy or by diagnostic imaging such as computed tomography, ultrasonography, and MRI. There were no patients who underwent endoscopic resection in this study. Follow‐up data were obtained from the patients' medical records. The study protocol was approved by the Institutional Ethical Committee, Yokohama City University, and written informed consent was obtained from all the patients enrolled in this study.
Pathological diagnosis
For pathological diagnosis, 4‐μm‐thick formalin‐fixed paraffin sections of the cases examined were stained with hematoxylin and eosin. Pathological diagnosis was performed by two experienced pathologists (Y. I. and Y.N.), according to World Health Organization guidelines.33 Pathological tumor‐node‐metastasis (pTNM) stages were determined according to the International Union against Cancer (UICC).34 The clinicopathological features of patients enrolled in this study are summarized in Table 1. The patient group included 119 men and 45 women (aged 26–93 years, with a median age of 66 years and interquartile age range of 57–73 years). The maximum size of tumors ranged 15–195 mm, with a median of 48 mm. Ninety (55%) patients were classified as stage I, 26 (16%) as stage II, 26 (16%) as stage III, and 22 (13%) as stage IV disease.
Table 1.
Clinicopathological features of patients enrolled in the study (n = 164)
| Pathologic factors | |
|---|---|
| Age, years (range) | 65.9 (26–93) |
| Gender | |
| Male/female | 119/45 |
| Tumor diameter, mm (range) | 48.0 (15–195) |
| Histological type | |
| Intestinal/diffuse | 94/70 |
| Depth of invasion | |
| pT1/pT2/pT3/pT4 | 65/59/29/11 |
| Nodal metastasis | |
| Negative/positive | 91/73 |
| Distant metastasis | |
| Negative/positive | 162/2 |
| Lymphatic invasion | |
| Absent/positive | 87/77 |
| Venous invasion | |
| Absent/positive | 102/62 |
| pStage | |
| I/II/III/IV | 90/26/26/22 |
| Resectability | |
| R0/R1/R2 | 117/38/9 |
| Adjuvant chemotherapy (R0, R1 patients) | |
| Negative/positive | 116/48 |
| Recurrence (R0, R1 patients) | |
| Negative/positive | 117/47 |
| aPKC expression | |
| low/high | 50/114 |
| E‐cadherin expression | |
| Negative/positive | 87/77 |
Immunohistochemistry
Immunohistochemical staining for aPKCλ/ι and KIBRA were performed as described previously.16 Four‐micrometer‐thick paraffin sections were deparaffinized, rehydrated, and then autoclaved in 10 mM citrate buffer (pH6.0) for 20 min at 121°C for antigen retrieval. After cooling, the slides were immersed in 0.3% H2O2 for 30 min at room temperature to quench endogenous peroxidase activity. After incubation with 10% normal goat serum in PBS, the sections were incubated with anti‐mouse KIBRA antibody27 (diluted to 1:500 with the Signal Stain Antibody Diluent [Cell Signaling Technology, Danvers, MA, USA]) at 4°C overnight. The labeled antigens were visualized with the HistFine kit (Nichirei, Tokyo, Japan) and 3, 3′‐diaminobenzidine reaction. Sections were counterstained with hematoxylin and examined under a light microscope.
Evaluation of immunostaining
Two investigators (Y.I. and Y.N.) independently assessed the stained sections. The signal intensity for KIBRA was graded as 0–3 using a semi‐quantitative scale: 0 representing no staining, 1 representing less intense signal than normal tissue staining, 2 representing moderate signal comparable to normal tissue staining, and 3 representing far more intense signal than in normal tissue staining. In statistical analysis, scores 0 and 1 were defined as negative, whereas 2 and 3 were positive. Sections stained for aPKCλ/ι and E‐cadherin were assessed as previously described.21
Statistical analysis
Statistical analyses were performed using spss version 11.0 (SPSS Inc., Chicago, IL, USA) for Windows. Fisher's exact test was used to examine possible associations between the expression of KIBRA and clinicopathological parameters. Kaplan–Meier curves were plotted to assess the association of KIBRA expression with disease‐specific and relapse‐free survival rates. Survival curves were compared using the log‐rank test. The data for “Depth of invasion” was categorized as pT1,2 / pT3,4 as well as “Stage” as I, II /III, IV as in the previous study21 for comparison.
Cell culture and immunocytochemistry
Madin‐Darby canine kidney II cells were obtained from Dr Shoichiro Tsukita (Kyoto University) and cultured in DMEM (Nissui, Tokyo, Japan) supplemented with 10% FBS (JRH Biosciences, Lenexa, KS, USA), 100 U/mL penicillin and streptomycin (Gibco, Grand Island, NY, USA) at 37°C/5% CO2. Cells were transfected with pEB‐CAGMCS‐tagRFP (tRFP) or pEB‐CAGMCS‐tRFP‐KIBRA‐aBR (919–978).28 Calcium switch assays were performed as described previously.28 Cells in transwells (Costar Coning, Lowell, MA, USA) were fixed with 2% paraformaldehyde/PBS for 15 min, permeabilized with 0.5% Triton X‐100/PBS for 10 min at room temperature, and stained with anti‐zonula occludens‐1 (ZO‐1) antibody (Zymed Laboratories, San Francisco, CA, USA), and anti‐tagRFP antibody (Evrogen, Moscow, Russia), as described previously.25 F‐actin was visualized with phalloidin conjugated with Alexa647 (Invitrogen, Carlsbad, CA, USA). RFP‐positive cells that were not completely surrounded by ZO‐1 staining were counted as cells with disrupted ZO‐1 staining. Total RFP positive cells were also counted.
Results
Expression of KIBRA protein in gastric cancer tissue
We first performed immunohistochemical analysis for KIBRA using gastric cancer tissues previously analyzed for aPKCλ/ι expression.21 In non‐neoplastic gastric tissue, KIBRA was detected at the apical and cell–cell junctional regions (Fig. 1a). In epithelium with intestinal metaplasia, KIBRA was detected not only at apical but also in the lateral regions (Fig. 1b). Almost no signal was detected in the signet ring cells (Fig. 1c). In 164 gastric cancer cases, increased expression of KIBRA (to moderately or strongly positive levels) was detected in 109 cases (66.5%), and the signal was detected not only in apical and junctional regions but also in cytoplasmic regions (Fig. 1d–g).
Figure 1.
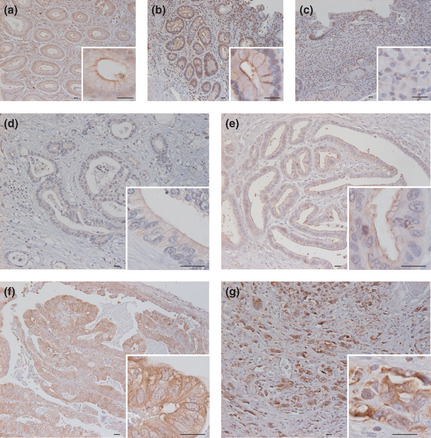
Expression and localization of KIBRA in non‐neoplastic and cancerous gastric tissues. Representative images of non‐neoplastic and cancerous gastric tissues immunostained for KIBRA are shown: non‐neoplastic epithelium (a), gastric epithelium with intestinal (b), signet ring cells (c), gastric cancer tissue diagnosed as 0 + (d), 1 + (e), 2 + (f), and 3 + (g). Bars: 20 μm.
Correlation between KIBRA expression and clinicopathological features of gastric cancer tissues
We next analyzed the association between KIBRA expression and clinicopathological features of gastric cancer tissues. As shown in Table 2, aPKCλ/ι expression showed a significantly positive correlation with KIBRA expression (P = 0.012). Increased staining of KIBRA significantly correlated with increased probability of lymphatic invasion (P = 0.046) and venous invasion (P = 0.039). Although not statistically significant, there was a tendency for increased expression of KIBRA in patients older than 70 years compared to younger ones (P = 0.058), and in intestinal‐type cancer compared to diffuse‐type (P = 0.069). There was no deviation between KIBRA expression and gender, tumor diameter, depth of invasion, lymph node metastasis, distant metastasis, stage, curability or E‐cadherin expression. As shown in Figure 2, there was no correlation between 5‐year disease specific survival (DSS) and relapse free survival (RFS) between KIBRA‐positive and ‐negative cancers.
Table 2.
Correlation between KIBRA expression and clinicopathological features of gastric cancer patients
| KIBRA expression | P‐value | ||
|---|---|---|---|
| Positive n = 109 (%) | Negative n = 55 (%) | ||
| Age (years) <70/≥70 | 64/45 (59/41) | 41/14 (75/25) | 0.058 |
| Gender | |||
| Male/Female | 81/28 (74/26) | 38/17 (69/31) | 0.578 |
| Tumor diameter (mm) <50/≥50 | 59/50 (54/46) | 33/22 (60/40) | 0.508 |
| Histological type | |||
| Intestinal/Diffuse | 68/41 (62/38) | 26/29 (47/53) | 0.069 |
| Depth of invasion | |||
| pT1,2/pT3,4 | 84/25 (77/23) | 40/15 (73/27) | 0.567 |
| Lymph node metastasis | |||
| Negative/Positive | 61/48 (56/44) | 30/25 (55/45) | 0.869 |
| Distant metastasis | |||
| Negative/Positive | 108/1 (99/1) | 54/1 (98/2) | 1.000 |
| Lymphatic invasion | |||
| Negative/Positive | 52/57 (48/52) | 36/19 (65/35) | 0.046a |
| Venous invasion | |||
| Negative/Positive | 62/47 (57/43) | 41/14 (75/25) | 0.039a |
| Stage | |||
| I,II/III,IV | 78/31 (72/28) | 38/17 (69/31) | 0.856 |
| Curability | |||
| R0,R1/R2 | 103/6 (94/6) | 52/3 (95/5) | 1.000 |
| aPKC expression | |||
| low/high | 26/83 (24/76) | 24/31 (44/56) | 0.012a |
| E‐cadherin expression | |||
| Negative/Positive | 56/53 (51/49) | 31/24 (56/44) | 0.620 |
P < 0.05 for Fisher's exact test.
Figure 2.
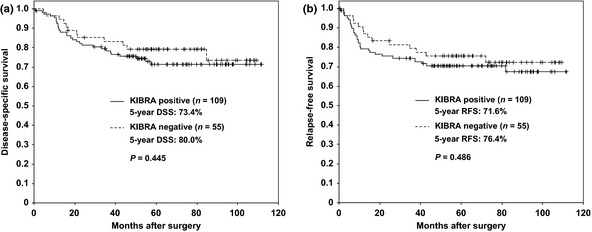
No correlation between the expression of KIBRA and disease‐specific survival or relapse‐free survival. Kaplan–Meier plot comparing positive (line) and negative (dashed line) staining of KIBRA for disease‐specific survival (DSS) (a) and relapse‐free survival (RFS) (b) are shown. P‐values were calculated by log‐rank test.
Correlation between KIBRA/aPKCλ/ι expression and clinicopathological features of gastric cancer tissues
We next separated the samples into two groups, aPKCλ/ι‐high or ‐low,21 and examined the association between KIBRA and clinical characteristics in these groups. We first analyzed the association between the expression of KIBRA and DSS or RFS. Neither DSS nor RFS were significantly correlated with KIBRA expression in the aPKCλ/ι‐high group (Fig. 3a,b); however, there was a significant difference in the 5‐year DSS between the KIBRA‐positive and KIBRA‐negative samples in the aPKCλ/ι‐low patient group (73.1% and 95.8%, respectively; P = 0.037; Fig. 3c). The 5‐year RFS was also significantly different between the two groups (73.1% and 95.8%, respectively; P = 0.041; Fig. 3d). As shown in Table 3, KIBRA expression did not correlate with any clinical characteristics in the aPKCλ/ι‐high group; however, the increased staining of KIBRA showed significant correlation with increased probability of lymphatic invasion (P = 0.042) and not significant but strong correlation with increased probability of venous invasion (P = 0.067) in the aPKCλ/ι‐low group. There was also a correlation of increased KIBRA expression patients older than 70 years old compared to younger ones (P = 0.028), and in intestinal‐type cancer compared to diffuse‐type (P = 0.035) in the aPKCλ/ι‐low group. There was no deviation between KIBRA expression and gender, tumor diameter, depth of invasion, lymph node metastasis, distant metastasis, stage, curability and E‐cadherin expression in the aPKCλ/ι‐low group (Table 3).
Figure 3.
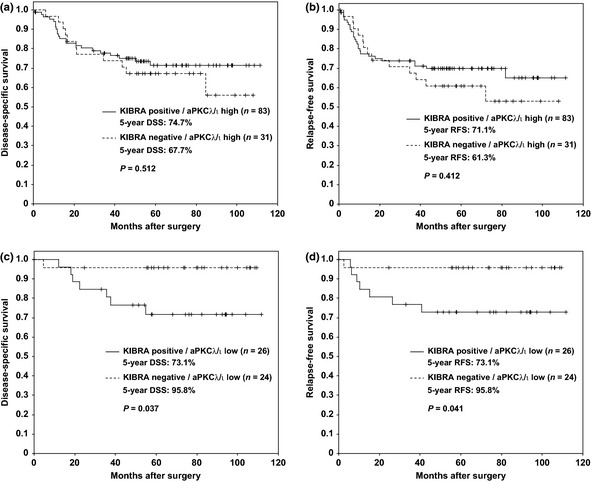
Association between high expression of KIBRA in aPKCλ/ι‐low gastric cancer and poor prognosis. Kaplan–Meier plot comparing positive (line) and negative (dashed line) staining of KIBRA for disease‐specific survival (DSS) and relapse‐free survival (RFS) in a aPKCλ/ι‐high group (a & b) or in a aPKCλ/ι‐low group (c & d) are shown. P‐values were calculated by log‐rank test.
Table 3.
Association between atypical protein kinase Cλ/ι (aPKCλ/ι)/KIBRA expression and clinicopathological features of gastric cancer patients
| aPKCλ/ι high | aPKCλ/ι low | |||||
|---|---|---|---|---|---|---|
| KIBRA expression | P‐value | KIBRA expression | P‐value | |||
| Positive n = 83 (%) | Negative n = 31 (%) | Positive n = 26 (%) | Negative n = 24 (%) | |||
| Age <70/≥70 (years) | 49/34 (59/41) | 20/11 (65/35) | 0.670 | 15/11 (58/42) | 21/3 (87/13) | 0.028a |
| Gender | ||||||
| Male/Female | 65/18 (78/22) | 25/6 (81/19) | 1.000 | 16/10 (62/38) | 13/11 (54/46) | 0.405 |
| Tumor diameter <50/≥50 (mm) | 44/39 (53/47) | 16/15 (52/48) | 1.000 | 15/11 (58/42) | 17/7 (71/29) | 0.388 |
| Histological type | ||||||
| Intestinal/Diffuse | 56/27 (67/33) | 22/9 (71/29) | 0.823 | 12/14 (46/54) | 4/20 (17/83) | 0.035a |
| E‐cadherin expression | ||||||
| Negative/Positive | 44/39 (53/47) | 15/16 (48/52) | 0.679 | 12/14 (46/54) | 16/8 (67/33) | 0.166 |
| Depth of invasion | ||||||
| pT1,2/pT3,4 | 63/20 (76/24) | 20/11 (65/35) | 0.243 | 21/5 (81/19) | 20/4 (83/17) | 1.000 |
| Lymph node metastasis | ||||||
| Negative/Positive | 49/34 (59/41) | 16/15 (52/48) | 0.527 | 12/14 (46/54) | 14/10 (58/42) | 0.413 |
| Distant metastasis | ||||||
| Negative/Positive | 83/0 (100/0) | 30/1 (97/3) | 0.272 | 25/1 (96/4) | 24/0 (100/0) | 1.000 |
| Lymphatic invasion | ||||||
| Negative/Positive | 39/44 (47/53) | 17/14 (55/45) | 0.530 | 13/13 (50/50) | 19/5 (79/21) | 0.042a |
| Venous invasion | ||||||
| Negative/Positive | 47/36 (57/43) | 21/10 (68/32) | 0.391 | 15/11 (58/42) | 20/4 (83/17) | 0.067 |
| Stage | ||||||
| I,II/III,IV | 60/23 (72/28) | 19/12 (61/39) | 0.264 | 18/8 (69/31) | 19/5 (79/21) | 0.526 |
| Curability | ||||||
| R0,R1/R2 | 78/5 (94/6) | 29/2 (94/6) | 1.000 | 25/1 (96/4) | 23/1 (96/4) | 1.000 |
P < 0.05 for Fisher's exact test.
Effect of KIBRA‐aPKC interaction on cell‐cell contact formation
To further understand the biological significance of KIBRA expression in the aPKCλ/ι‐low group, we next examined the effect of KIBRA‐aPKC interactions in cell–cell contact formation. To this purpose, we used calcium switch (CS) assays with Madin‐Darby canine kidney (MDCK) cells, a dog kidney epithelial cell line commonly used for polarity research. MDCK cells were depolarized in low calcium medium to disrupt cell–cell contact (Fig. 4a, 0 h). Then cells were cultured in normal calcium medium to reform cell–cell contact. In MDCK cells expressing tRFP, ZO‐1, a tight junction protein, was recruited to the primordial cell–cell junction 0.5 h after a CS, and formed linear staining at cell–cell junctional regions 2–6 h after a CS (Fig. 4a). We tried to examine the effect of overexpression of full‐length KIBRA; however, we somehow failed to overexpress full‐length KIBRA in MDCK cells, possibly due to cytotoxic effect such as Hippo pathway activation (data not shown).29, 30, 31 Thus we used overexpression of tRFP‐tagged aPKC‐binding region of KIBRA (tRFP‐aBR).28 In contrast to tRFP overexpression, overexpression of tRFP‐aBR delayed the recruitment of ZO‐1 to cell–cell junction, and disrupted junctional staining of ZO‐1 up to 6 h after CS (Fig. 4a). Almost 40% of tRFP‐aBR expressing MDCK cells showed disrupted ZO‐1 staining, whereas only 4% of tRFP expressing MDCK cells did 6 h after a CS (Fig. 4b). Given that aBR can competitively inhibit the kinase activity of aPKC,28 the results suggest that overexpression of KIBRA can disrupt cell–cell junctions through inhibition of aPKC activity in epithelial cells.
Figure 4.
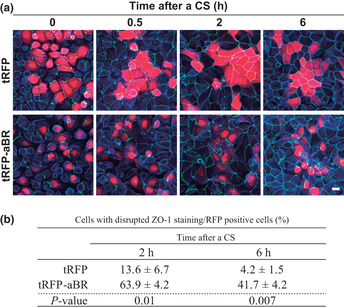
Overexpression of the atypical protein kinase C (aPKC) binding region of KIBRA affects tight junction formation. (a) Madin‐Darby canine kidney (MDCK) cells were transfected to express indicated proteins and then subjected to calcium switch assays. Cells were fixed at indicated times after calcium switch and stained for ZO‐1 (green), tRFP (red), and F‐actin (blue). Scale bars, 10 μm. (b) Cells that showed disrupted ZO‐1 staining in tRFP‐ or tRFP‐aBR‐expressing MDCK cells were counted, and percentages for total RFP positive cells were calculated. Values represent the mean ± standard deviation (SD) of three independent experiments. P‐values were calculated by Student's t‐test.
Discussion
Previous studies have suggested the importance of the deregulation of aPKCλ/ι in the progression of various cancer types. In the present study, we extended this notion and provided evidence suggesting the importance of aPKCλ/ι activity for loss of polarity and invasiveness in gastric cancer tissues.
We showed that KIBRA localizes at the apical domain of epithelial cells in normal gastric tissue in a similar manner to aPKCλ/ι.21 Importantly, we found a correlation between the expression level of aPKCλ/ι and KIBRA (Table 2), suggesting that KIBRA might affect aPKCλ/ι in gastric carcinogenesis. We also showed that high expression of KIBRA correlated with lymphovascular invasion (Table 2). Although the expression of KIBRA did not affect the DSS or RFS in total (Fig. 2), high expression of KIBRA correlated with poor prognosis both in DSS and in RFS in low aPKCλ/ι‐expressing samples (Fig. 3). Further, high KIBRA expression showed positive correlation with lymphovascular invasion only in the low aPKCλ/ι‐expressing group (Table 3). Thus, we focused on the correlation between KIBRA expression with lymphovascular invasion. Considering that KIBRA inhibits the kinase activity of aPKCλ/ι in epithelial cells,28 the kinase activity of aPKCλ/ι might be severely lowered in KIBRA‐high/aPKCλ/ι‐low gastric cancer tissue. Loss of aPKC activity can disrupt cell–cell adhesion by increased endocytosis of E‐cadherin35 and loss of tight junctions,25, 36 which can increase the possibility of vascular invasion. Consistently, we showed that overexpression of the aPKC‐binding region of KIBRA in MDCK cells causes defects in tight junction formation during calcium switching (Fig. 4) similarly to aPKCλ/ι RNAi36 but not to its overexpression,25 supporting the hypothesis that imbalances in KIBRA and aPKCλ/ι expression can cause loss of polarity, presumably because of the decrease in aPKC kinase activity. The correlation between high expression of aPKCλ/ι and tumor progression is suggested in many malignancies including breast cancer.15, 16, 17, 18, 19, 20 On the other hand, in bladder cancer tissue, loss of aPKC expression is correlated with tumor recurrence.22 Taken together with this study, these facts suggest that both increased and decreased activity of aPKCλ/ι is important for tumorigenesis and the activity of aPKCλ/ι should be properly regulated to maintain normal tissue homeostasis.
In aPKC‐λ/ι low cases, KIBRA‐negative gastric cancer has a more diffuse type (83%) than KIBRA positive (54%), but shows more favorable prognosis (Table 3). KIBRA‐negative/ aPKCλ/ι‐low group showed significantly better prognosis than any other group subdivided based on KIBRA and aPKCλ/ι expression. It raises the possibility that the KIBRA‐negative/ aPKCλ/ι‐low group are consistent with relatively earlier stage of cancer cases than KIBRA‐positive/aPKCλ/ι‐low cases. We examined the impact of KIBRA expression on prognostic value in stage‐matched populations; the aPKC‐low patients group was divided into two group; stage I/II and stage III/IV, and then we examined whether or not the KIBRA‐negative group had a favorable prognosis in these stages. There was a tendency that the KIBRA‐negative/aPKC‐low patients group showed better prognosis than the KIBRA‐positive/aPKC‐low group, independently of stage (data not shown). Furthermore, there was no significant difference in clinical stages between the KIBRA‐negative/aPKCλ/ι‐low group and the KIBRA‐positive/aPKCλ/ι‐low group (Table 3). These findings suggest that the KIBRA‐negative/aPKCλ/ι‐low group are not earlier stage of cancer cases than KIBRA‐positive/aPKCλ/ι‐low cases.
Nuclear accumulation of YAP, a transcription co‐activator that is suppressed by the Hippo pathway, is associated with poor prognosis of gastric cancer.37 KIBRA activates the Hippo pathway,29, 30, 31 thus nuclear accumulation of YAP might be accelerated to cause poor prognosis in KIBRA‐negative cancer compared with KIBRA‐positive cancer. In this study, however, KIBRA expression alone did not correlate with prognosis (Fig. 2). Drosophila KIBRA (Kibra) acts together with FERM proteins Merlin and Expanded, and loss of Kibra alone showed mild overgrowth phenotype.29, 30, 31 Combined analysis of NF2 (human Merlin homolog) and FERMD6 (human Expanded homolog) will be required to conclude whether Hippo pathway regulation by KIBRA is important for gastric cancer progression.
Our study showed that the expression level of KIBRA can be a prognostic factor in the low aPKCλ/ι‐expressing group (Fig. 3). Note that the KIBRA expression by itself is not a prognostic factor (Fig. 2). One possible explanation is that both overexpression and loss of KIBRA can affect cell polarity. Loss of KIBRA can increase the activity of aPKC, which leads to its overactivation and subsequent poor prognosis in gastric cancer. In contrast, overexpression of KIBRA can lead to a loss of polarity through inhibition of aPKC, as discussed above. It is quite possible that the expression level of KIBRA is precisely regulated in gastric tissue. As mentioned above, high expression of KIBRA only in low aPKCλ/ι‐expressing tumors correlated with poor prognostic factors (Fig. 3). One possibility is that gastric cancer expresses other aPKC such as aPKCζ, and KIBRA expression alone could not suppress total aPKC activity if all aPKC family members are expressed. Unfortunately, there is no aPKCζ specific antibody available in immunohistochemistry, thus it is difficult to determine the expression level of aPKCζ in the gastric cancer tissues used in this study. The expression of aPKCζ is required for further investigation. The importance of this result is that aPKCλ/ι‐low tumors have been associated with better prognoses. Combined with the expression level of KIBRA, we observed worse prognoses for the aPKCλ/ι‐low groups. The combined analysis of aPKCλ/ι and KIBRA expression might be a more precise predictor of prognosis in gastric cancer.
In conclusion, our findings provide evidence that supports the importance of a KIBRA‐aPKC connection in the progression of gastric cancer. We found that the KIBRA high/aPKCλ/ι low expression could indicate poor prognosis, which would have been missed if diagnosed with aPKCλ/ι expression only.
Disclosure Statement
The authors have no conflict of interest.
Acknowledgments
The authors thank Ms Ei Hiruma, Harumi Sakurada, Tamiyo Taniguchi, Shizuko Kobayashi, and Sayuri Kanaya for their technical and secretarial assistance. This research was supported by Grants‐in‐Aids from the Japanese Ministry of Education, Culture, Sports, Science and Technology for Fundamental Research (to K. Akimoto, Y. Nagashima, and S. Ohno) and a Grant from the Yokohama Foundation for Medical Research Promotion (to Y. Nagashima). This work was also supported by a Grant‐in Aid from the Japan Society for the Promotion of Science (JSPS). Y. Yoshihama is a research fellow of JSPS.
(Cancer Sci, doi: 10.1111/cas.12066, 2012)
References
- 1. Jemal A, Siegel R, Ward E et al Cancer statistics, 2006. CA Cancer J Clin 2006; 56: 106–30. [DOI] [PubMed] [Google Scholar]
- 2. Henson DE, Dittus C, Younes M, Nguyen H, Albores‐Saavedra J. Differential trends in the intestinal and diffuse types of gastric carcinoma in the United States, 1973–2000: increase in the signet ring cell type. Arch Pathol Lab Med 2004; 128: 765–70. [DOI] [PubMed] [Google Scholar]
- 3. Faycal J, Bessaguet C, Nousbaum JB et al Epidemiology and long term survival of gastric carcinoma in the French district of Finistere between 1984 and 1995. Gastroenterol Clin Biol 2005; 29: 23–32. [DOI] [PubMed] [Google Scholar]
- 4. Cunningham SC, Kamangar F, Kim MP et al Survival after gastric adenocarcinoma resection: eighteen‐year experience at a single institution. J Gastrointest Surg 2005; 9: 718–25. [DOI] [PubMed] [Google Scholar]
- 5. Tsubono Y, Hisamichi S. Screening for gastric cancer in Japan. Gastric Cancer 2000; 3: 9–18. [DOI] [PubMed] [Google Scholar]
- 6. Koizumi W, Narahara H, Hara T et al S‐1 plus cisplatin versus S‐1 alone for first‐line treatment of advanced gastric cancer (SPIRITS trial): a phase III trial. Lancet Oncol 2008; 9: 215–21. [DOI] [PubMed] [Google Scholar]
- 7. Ajani JA. Optimizing docetaxel chemotherapy in patients with cancer of the gastric and gastroesophageal junction: evolution of the docetaxel, cisplatin, and 5‐fluorouracil regimen. Cancer 2008; 113: 945–55. [DOI] [PubMed] [Google Scholar]
- 8. Lee M, Vasioukhin V. Cell polarity and cancer‐cell and tissue polarity as a non‐canonical tumor suppressor. J Cell Sci 2008; 121: 1141–50. [DOI] [PubMed] [Google Scholar]
- 9. Wodarz A, Nathke I. Cell polarity in development and cancer. Nat Cell Biol 2007; 9: 1016–24. [DOI] [PubMed] [Google Scholar]
- 10. Tanos B, Rodriguez‐Boulan E. The epithelial polarity program: machineries involved and their hijacking by cancer. Oncogene 2008; 27: 6939–57. [DOI] [PubMed] [Google Scholar]
- 11. Martin‐Belmonte F, Perez‐Moreno M. Epithelial cell polarity, stem cells and cancer. Nat Rev Cancer 2012; 12: 23–38. [DOI] [PubMed] [Google Scholar]
- 12. McCaffrey LM, Macara IG. Epithelial organization, cell polarity and tumorigenesis. Trends Cell Biol 2011; 21: 727–35. [DOI] [PubMed] [Google Scholar]
- 13. Suzuki A, Ohno S. The PAR‐aPKC system: lessons in polarity. J Cell Sci 2006; 119: 979–87. [DOI] [PubMed] [Google Scholar]
- 14. Ohno S. Intercellular junctions and cellular polarity: the PAR‐aPKC complex, a conserved core cassette playing fundamental roles in cell polarity. Curr Opin Cell Biol 2001; 13: 641–8. [DOI] [PubMed] [Google Scholar]
- 15. Li Q, Wang JM, Liu C, Xiao BL, Lu JX, Zou SQ. Correlation of aPKCι and E‐cadherin expression with invasion and prognosis of cholangiocarcinoma. Hepatobiliary Pancreat Dis Int 2008; 7: 70–5. [PubMed] [Google Scholar]
- 16. Kojima Y, Akimoto K, Nagashima Y et al The overexpression and altered localization of the atypical protein kinase Cλ/ι in breast cancer correlates with the pathologic type of these tumors. Hum Pathol 2008; 39: 824–31. [DOI] [PubMed] [Google Scholar]
- 17. Ishiguro H, Akimoto K, Nagashima Y et al aPKCλ/ι promotes growth of prostate cancer cells in an autocrine manner through transcriptional activation of interleukin‐6. Proc Natl Acad Sci USA 2009; 106: 16369–74. [DOI] [PMC free article] [PubMed] [Google Scholar]
- 18. Regala RP, Weems C, Jamieson L et al Atypical protein kinase Cι is an oncogene in human non‐small cell lung cancer. Cancer Res 2005; 65: 8905–11. [DOI] [PubMed] [Google Scholar]
- 19. Eder AM, Sui X, Rosen DG et al Atypical PKCι contributes to poor prognosis through loss of apical‐basal polarity and cyclin E overexpression in ovarian cancer. Proc Natl Acad Sci USA 2005; 102: 12519–24. [DOI] [PMC free article] [PubMed] [Google Scholar]
- 20. Patel R, Win H, Desai S, Patel K, Matthews JA, Acevedo‐Duncan M. Involvement of PKC‐iota in glioma proliferation. Cell Prolif 2008; 41: 122–35. [DOI] [PMC free article] [PubMed] [Google Scholar]
- 21. Takagawa R, Akimoto K, Ichikawa Y et al High expression of atypical protein kinase C λ/ι in gastric cancer as a prognostic factor for recurrence. Ann Surg Oncol 2010; 17: 81–8. [DOI] [PubMed] [Google Scholar]
- 22. Namdarian B, Wong E, Galea R et al Loss of APKC expression independently predicts tumor recurrence in superficial bladder cancers. Urol Oncol 2011. (in press). [DOI] [PubMed] [Google Scholar]
- 23. Chalmers AD, Pambos M, Mason J, Lang S, Wylie C, Papalopulu N. aPKC, Crumbs3 and Lgl2 control apicobasal polarity in early vertebrate development. Development 2005; 132: 977–86. [DOI] [PubMed] [Google Scholar]
- 24. Grifoni D, Garoia F, Bellosta P et al aPKCζ cortical loading is associated with Lgl cytoplasmic release and tumor growth in Drosophila and human epithelia. Oncogene 2007; 26: 5960–5. [DOI] [PubMed] [Google Scholar]
- 25. Suzuki A, Yamanaka T, Hirose T et al Atypical protein kinase C is involved in the evolutionarily conserved par protein complex and plays a critical role in establishing epithelia‐specific junctional structures. J Cell Biol 2001; 152: 1183–96. [DOI] [PMC free article] [PubMed] [Google Scholar]
- 26. Buther K, Plaas C, Barnekow A, Kremerskothen J. KIBRA is a novel substrate for protein kinase Cζ. Biochem Biophys Res Commun 2004; 317: 703–7. [DOI] [PubMed] [Google Scholar]
- 27. Yoshihama Y, Hirai T, Ohtsuka T, Chida K. KIBRA co‐localizes with protein kinase Mζ (PKMζ) in the mouse hippocampus. Biosci Biotechnol Biochem 2009; 73: 147–51. [DOI] [PubMed] [Google Scholar]
- 28. Yoshihama Y, Sasaki K, Horikoshi Y et al KIBRA suppresses apical exocytosis through inhibition of aPKC kinase activity in epithelial cells. Curr Biol 2011; 21: 705–11. [DOI] [PubMed] [Google Scholar]
- 29. Yu J, Zheng Y, Dong J et al Kibra functions as a tumor suppressor protein that regulates Hippo signaling in conjunction with Merlin and Expanded. Dev Cell 2010; 18: 288–99. [DOI] [PMC free article] [PubMed] [Google Scholar]
- 30. Genevet A, Wehr MC, Brain R, Thompson BJ, Tapon N. Kibra is a regulator of the Salvador/Warts/Hippo signaling network. Dev Cell 2010; 18: 300–8. [DOI] [PMC free article] [PubMed] [Google Scholar]
- 31. Baumgartner R, Poernbacher I, Buser N, Hafen E, Stocker H. The WW domain protein Kibra acts upstream of Hippo in Drosophila . Dev Cell 2010; 18: 309–16. [DOI] [PubMed] [Google Scholar]
- 32. Hill VK, Dunwell TL, Catchpoole D et al Frequent epigenetic inactivation of KIBRA, an upstream member of the Salvador/Warts/Hippo (SWH) tumor suppressor network, is associated with specific genetic event in B‐cell acute lymphocytic leukemia. Epigenetics 2011; 6: 326–32. [DOI] [PMC free article] [PubMed] [Google Scholar]
- 33. Hamilton SR, Aaltonen LA. Pathology and Genetics of Tumours of the Digestive System. Lyon: IARCP Press, 2000. [Google Scholar]
- 34. Sobin LH, Wittekind CH. TNM: Classification of Malignant Tumours, 6th edn. New York: John Wiley & Sons, 2002. [Google Scholar]
- 35. Sato K, Watanabe T, Wang S et al Numb controls E‐cadherin endocytosis through p120 catenin with aPKC. Mol Biol Cell 2011; 22: 3103–19. [DOI] [PMC free article] [PubMed] [Google Scholar]
- 36. Suzuki A, Hirata M, Kamimura K et al aPKC acts upstream of PAR‐1b in both the establishment and maintenance of mammalian epithelial polarity. Curr Biol 2004; 14: 1425–35. [DOI] [PubMed] [Google Scholar]
- 37. Kang W, Tong JH, Chan AW et al Yes‐associated protein 1 exhibits oncogenic property in gastric cancer and its nuclear accumulation associates with poor prognosis. Clin Cancer Res 2011; 17: 2130–9. [DOI] [PubMed] [Google Scholar]