

Abstract
Feline sarcoma‐related protein (Fer) is a ubiquitously expressed non‐receptor protein tyrosine kinase associated with proliferation in various cancer cells. However, no reports have described the pathological roles and prognostic value of Fer expression in renal cell carcinoma (RCC). We investigated Fer expression in three RCC cell lines (ACHN, Caki‐1, and Caki‐2) and in normal tubule cells (HK‐2) by immunoblotting. Fer expression was highest in ACHN cells, with Caki‐1 showing intermediate levels and Caki‐2 showing low levels, and was undetectable in HK‐2. RNA interference was therefore used to assess the effects of Fer knockdown in ACHN. Knockdown of Fer expression was found to inhibit RCC cell proliferation and colony formation. Immunohistochemical analysis of 131 human RCC tissues (110 conventional, 11 chromophobe, and 10 papillary) investigated relationships between Fer expression and clinicopathological features, including cancer cell proliferation, apoptosis, and prognostic value for survival. In human tissues, Fer expression was significantly higher in cancer cells than in normal tubules. In addition, expression levels correlated with cancer cell proliferation, but not with apoptosis. Multivariate analysis indicated associations of Fer expression with pT stage, tumor grade, and metastasis (P < 0.001). Fer expression was also prognostic for cause‐specific survival according to multivariate analysis (hazard ratio, 3.89; 95% confidence interval, 1.02–14.84, P = 0.047). Fer expression correlates with RCC cell proliferation both in vitro and in vivo, and with tumor progression and survival. This represents useful information for discussing the pathological and clinical significance of Fer in RCC.
Protein‐tyrosine kinases are important regulators of intracellular signal transduction pathways. Feline sarcoma (Fes) belongs to subgroup IV of the non‐receptor protein tyrosine kinases. Fes‐related protein (Fer) is a member of a distinct subgroup of Src homology 2‐containing non‐receptor tyrosine kinases.1, 2 Fes is known to be expressed in hematopoietic cells, endothelial cells, and neuronal cells.2 Conversely, Fer is ubiquitously expressed, but its potential involvement in cancer remains enigmatic.1 Fer expression has been associated with proliferation of several cultured cancer cell lines and poor prognosis in prostate cancer has recently been correlated with increased Fer expression levels.3, 4, 5 More generally, Fer is implicated in signaling downstream to a variety of receptor systems that regulate cell proliferation and invasion in various cell types.3, 4, 5, 6, 7, 8 For example, Fer can regulate both β‐catenin, a key molecule in the cell proliferation and cell adhesion systems, and cortactin, which plays important roles in cell migration and invasion.7, 8 These observations suggest potential roles for Fer in the regulation of proliferation as well as the metastatic potential of cancer cells.
Renal cell carcinoma (RCC) is a common urological malignancy with a high frequency of invasion and metastasis being apparent at the time of diagnosis. Actually, over 30% of patients show non‐organ‐confined tumor on diagnosis. Approximately one‐third of patients with localized RCC will eventually develop metastasis despite various treatments.9, 10, 11 Molecular targeting therapies have been used for patients with advanced RCC. These treatments represent a major breakthrough with well‐established antitumoral effectiveness, because conventional therapies are generally ineffective.12 However, side‐effects are occasionally observed and the effectiveness of such therapies is sometimes insufficient, because the pharmacotherapy must be abandoned.13 Various information regarding the pathological mechanisms and molecular basis of cancer cell progression thus needs to be determined to allow a proper discussion of new treatment strategies. We have previously reported the association between Fes expression and cancer cell proliferation and tumor growth in RCC cells, but no reports to date have described the expression of the related Fer in RCC.14 Because Fer has been implicated in many cellular functions associated with cancer, we reasoned that expression in RCC might provide predictive or prognostic value in RCC patients.
Here we describe in vitro and in vivo investigations of Fer expression in both RCC cell lines and human tissues. The results suggest that Fer expression might represent a valuable prognostic biomarker for RCC. Furthermore, the involvement of Fer in cell signaling processes linked to cancer cell progression also points to Fer as a potential therapeutic target for future treatments in RCC patients.
Materials and Methods
Cell culture and immunoblotting
Three human RCC cell lines (ACHN, Caki‐1, and Caki‐2) and normal tubule cells (HK‐2) were obtained from ATCC (Manassas, VA, USA). Both ACHN and HK‐2 were cultured in DMEM, and Caki‐1 and Caki‐2 were cultured in McCoy's 5A (Sigma‐Aldrich, St Louis, MO, USA). All growth media were supplemented with 10% FBS (Sigma‐Aldrich). Cells were cultured at 37°C in a humidified atmosphere containing 5% CO2.
Cell lysates were prepared in radioimmunoprecipitation assay buffer containing protease inhibitors as previously described.14 Cell lysates were centrifuged at 14 000g for 15 min at 4°C and quantified using the Bio‐Rad protein assay (Bio‐Rad, Mississauga, ON, Canada). Lysates were diluted to 1 mg/mL with SDS sample buffer (130 mM Tris‐HCl [pH 6.8], 20% [v/v] glycerol, 2% [w/v] SDS, 2% [v/v] β‐mercaptoethanol, 0.08% [v/v] bromophenol blue) and heated to 95°C. Aliquots of 20 μg were separated by SDS‐PAGE and transferred to Immobilon‐P transfer membranes (Millipore, Mississauga, ON, Canada) using a semidry transfer apparatus (Bio‐Rad). Membranes were blocked with 5% skimmed milk in TBST buffer (10 mM Tris‐HCl [pH 7.5], 150 mM NaCl, 0.1% [v/v] Tween‐20) and incubated overnight at 4°C with primary antibody. To detect Fer expression, this analysis used rabbit polyclonal antibody (anti‐FpsQE antibody), which is cross‐reactive for Fer and Fes. This antibody was used for detecting Fer in a previous report.15 Membranes were then incubated with the secondary goat anti‐rabbit antibodies in TBST for 1 h at room temperature. After washing with TBST, reactive proteins were detected using enhanced chemiluminescence (NEN Life Science Products, Boston, MA, USA). In addition, we also reconfirmed Fer expression using the anti‐Fer antibody applied in immunohistochemical analyses. The method for this immunoblotting basically followed the steps outlined above.
Quantitation of viable cells and colony formation assay
Relative numbers of viable cells were determined using the MTT assay. Briefly, growth medium was removed and cells were incubated for 3 h with 100 μL MTT solution at 37°C. Cells were then lysed with 50% N,N‐dimethylformamide and levels of the formazan reduction product were determined by measuring absorbance at 570 nm. Alternatively, cell viability was assessed using the Trypan blue dye exclusion method.
In colony formation assays, WT‐ and Fer‐KD‐ACHN cells (5 × 10³ per 35‐mm well) were plated in complete culture medium. After 21 days of incubation at 37°C in a 5% CO2 humidified atmosphere, colonies with more than 50 cells were scored.
Knockdown of Fer expression by shRNA
The ACHN cells were transduced with pLKO.1 lentivirus encoding shRNA directed against human fer (Cat# RHS3979‐9570903; Open Biosystems, Waltham, MA, USA) or an empty vector control. The transduced polyclonal populations were selected with puromycin and Fer expression was assessed by immunoblotting. We used cells after stable selection of Fer knockdown clones.
Patients and specimens
Formalin‐fixed, paraffin‐embedded sections were obtained from surgical specimens of 131 RCC (110 conventional RCC, 11 chromophobe RCC, and 10 papillary RCC) resected from patients between 1991 and 2006. Although consecutive specimens were investigated, some specimens were excluded due to low cancer cell numbers following previous investigations. We also excluded patients who received neo‐adjuvant therapy. All patients were evaluated by chest radiography, ultrasonography, computed tomography, and bone scanning. Pathological staging was assessed using the 2002 TNM classification, with the grade determined using the criteria of Fuhrman et al.16 Tumors were grouped for statistical analysis as follows: low stage (pT1 or pT2) versus high stage (pT3 or pT4); or low grade (grade 1 or 2) versus high grade (grade 3 or 4). In addition, for multivariate analyses, grades 1 and 2 were considered as a low‐grade group. Patients were followed up every 3–6 months and chest radiography, computed tomography, and/or magnetic resonance imaging were carried out every 6–12 months. The mean (SD) duration of follow‐up was 45.4 (40.4) months and 26 patients (19.8%) died of disease‐specific causes. We also examined 30 normal kidney samples and 15 specimens with oncocytoma. The study protocol met the ethical standards of the Human Ethics Review Committee of Nagasaki University Hospital (Nagasaki, Japan).
Immunohistochemistry
We used antibodies for Fer (Sigma‐Aldrich), Ki‐67 (Dako, Glostrup, Denmark), and cleaved caspase‐3 (Cell Signaling Technology, Danvers, MA, USA). Five‐micrometer‐thick sections were deparaffinized and rehydrated, and antigen retrieval was carried out at 95°C for 40 min in 0.01 M sodium citrate buffer (pH 6.0). All sections were then immersed in 3% H2O2 for 30 min. Sections were incubated with the primary antibody, then with EnVision + Peroxidase (Dako). The peroxidase reaction was visualized using a DAB substrate kit. As positive controls for Ki‐67 and Fer or cleaved caspase‐3, tonsil or prostate cancer tissues that had been confirmed in preliminary studies as immunoreactive for the studied antigens were used. Apoptotic cells were detected using an ApopTag In Situ Apoptosis Detection kit (Intergen, Purchase, NY, USA), as described previously.17 A consecutive section from each sample processed without the primary antibody was used as a negative control. In addition, specificity of this primary antibody for human Fer protein was again confirmed by comparing expression on immunoblotting with that on immunohistochemistry, as described previously by our group.18
Fer expression was considered positive if staining intensity was strong or moderate, and the percentage of positively stained cells was determined using a continuous scale. This study measured the number of Fer‐positive cancer cells, not Fer‐positive infiltrating cells. In the present study, we evaluated and analyzed cytoplasmic Fer expression (see “Results”). For survival analysis and logistic regression analysis, all scales were divided into two groups based on median levels. Proliferation index (PI) and apoptotic index (AI) represented the percentages of Ki‐67‐ and terminal deoxynucleotidyl transferase (TdT)‐mediated dUTP nick end labeling‐positive cells, respectively. The AI was confirmed by the proportion of cleaved caspase‐3‐positive cells. Each expression and index was measured in at least 500 cancer cells in similar areas to where Fer expression was strongest. These methods have been described in previous reports.17, 19 Slides were examined using an E‐400 microscope (Nikon, Tokyo, Japan) producing digital images, which were examined using a computer‐aided image analysis system (Win ROOF version 5.0; Mitani, Fukui, Japan). Slides were evaluated twice at different times by two investigators (Y.M. and S.K.) who were blinded to the clinicopathological features.
Statistical analyses
All data are expressed as mean and SD. In addition, some data are expressed as median values because of non‐normal distributions. Student's t‐test and χ2‐test were used for comparisons of continuous variables and comparisons of categorical data, respectively. Conversely, the Mann–Whitney U‐test was carried out for continuous variables showing a non‐normal distribution. Differences were assessed using two‐sided tests. Survival comparisons were carried out by Kaplan–Meier analysis and the log–rank test. Survival data were accumulated from the time of operation, which all patients underwent within 1 month from diagnosis. Variables that achieved statistical significance (P < 0.050) in univariate analysis were subsequently entered into multivariate analysis using Cox proportional hazards analysis, with results provided as hazard ratios (HR) with 95% confidence intervals (95% CI), together with P‐values. Crude and adjusted effects were estimated by logistic regression analysis, with results provided as odds ratios with 95% CI, together with P‐values. All statistical analyses were carried out using StatView version 5.0 software (Abacus Concepts, Berkeley, CA, USA).
Results
Fer expression
In immunoblotting analysis using FpsQE (Fig. 1a), ACHN cells showed the highest levels of Fer expression, with Caki‐1 cells showing intermediate levels and Caki‐2 cells showing low levels. HK‐2 cells showed no detectable Fer expression. To select the target for knockdown of Fer expression among RCC cell lines, we reconfirmed Fer expression by Fer‐LA (Fig. 1b). Finally, we judged that strongest expression of Fer was found in ACHN.
Figure 1.
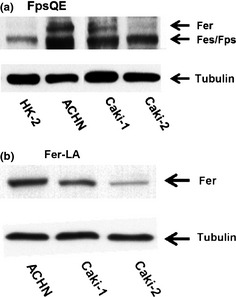
Expression of feline sarcoma‐related protein (Fer) in renal cell carcinoma (RCC) cell lines. Lysates from the HK‐2 kidney epithelial cell line and the ACHN, Caki‐1, and Caki‐2 RCC lines were assessed for expression of Fer by immunoblotting using the anti‐FpsQE antibody (a). Results were confirmed using specific antibody (Fer‐LA) in RCC cell lines (b).
In human tissues, Fer expression was observed in normal tubules, although moderate or strong expression was rare (Fig. 2a). Likewise, Fer expression was weak or absent in oncocytoma (Fig. 2b). Representative examples of Fer expression in RCC tissues and corresponding appearances with H&E staining are shown in Figure 2(c–h). Figure 2(c) represents typical Fer immunostaining in conventional RCC. Representative images of staining in papillary and chromophobe RCC are shown in Figure 2(d,e), respectively. Corresponding H&E stains are shown in Figure 2(f–h) for comparison. We found no differences in expression patterns or intensity among cancer cells from conventional, papillary, or chromophobe RCC samples, with staining appearing mainly in the cytoplasm and rarely in the nucleus. However, although membranous expression was apparent in some cancer cells (Fig. 2i), membranous expression without cytoplasmic staining was rare. In some cases, cancer cells at the invasive front and edge of the tumor often showed strong Fer immunostaining, and we noticed such invasive cancer cells showed strong cytoplasmic expression of Fer (Fig. 2i). In addition, such findings were more frequent in high pT stage cases (13 of 33, 39.4%) than in low pT stage cases (7 of 98, 7.1%). Given these findings, the present study evaluated cytoplasmic staining of Fer. Finally, median (mean ± SD) proportions of Fer‐positive cells in normal kidney cells and oncocytoma were 1.2% (1.3 ± 1.2%) and 0.9% (1.2 ± 1.0%), respectively, compared to the significantly higher proportion in RCC samples at 6.5% (11.0 ± 11.0%). No significant difference in Fer expression was apparent among the different histological types, with conventional, chromophobe, and papillary RCC showing 6.4% (10.9 ± 10.8%), 6.0% (9.1 ± 9.2%), and 9.3% (14.1 ± 14.0%) positive cells, respectively (Table 1). When we analyzed Fer expression of type I and type II papillary RCC separately, positive ratios tended to be higher in type II than in type I (Table 1), although the difference was not significant (P = 0.210). In addition to cancer cells, some infiltrating inflammatory cells and fibroblast‐like cells also showed Fer immunostaining, although unlike the cancer cells, these Fer‐positive cells showed no characteristic features or distributions of expression.
Figure 2.
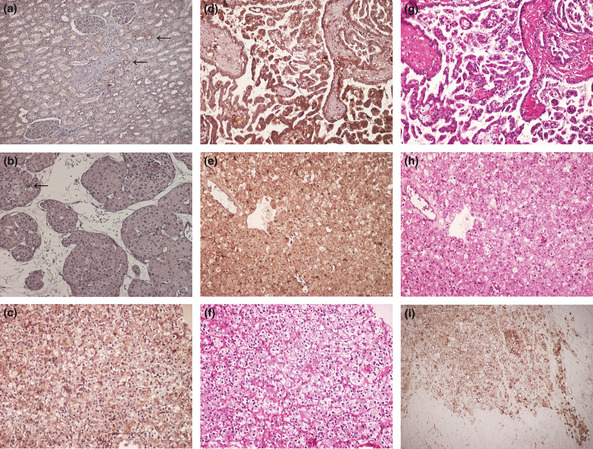
Feline sarcoma‐related protein (Fer) expression in normal kidney tissue (a) and oncocytoma (b). Strong expression of Fer appears rare in both non‐malignant cell types. Arrows point to positively stained cells. Positively stained cancer cells were detected in renal cell carcinoma (RCC) cells and some cancer cells showed strong expression. Representative examples of clear cell (c), papillary (d), and chromophobe RCC (e). (f–h) corresponding H&E staining for each type of RCC. (i) Strongly stained cancer cells are apparent at the invasive front and edge of the tumor. Sections were counterstained using hematoxylin. (Magnification: a–h, ×200; i, ×100).
Table 1.
Feline sarcoma‐related protein (Fer) expression and clinicopathological features of patients with renal cell carcinoma
| n | Median Fer expression (mean ± SD) | P‐value | |
|---|---|---|---|
| Sex | |||
| Male | 92 | 6.9 (11.5 ± 11.4) | 0.513 |
| Female | 39 | 6.3 (10.0 ± 9.9) | |
| pT stage | |||
| T1 | 82 | 3.9 (5.8 ± 6.6) | |
| T2 | 16 | 11.5 (13.4 ± 7.2) | <0.001 |
| T3 | 28 | 19.8 (20.9 ± 10.1) | 0.003 |
| T4 | 5 | 33.2 (32.4 ± 14.4) | 0.009 |
| Low (1 + 2) | 98 | 4.5 (7.2 ± 7.5) | <0.001 |
| High (3 + 4) | 33 | 22.5 (24.6 ± 11.4) | |
| Lymph node metastasis | |||
| Absence | 124 | 6.2 (9.9 ± 9.7) | <0.001 |
| Presence | 7 | 33.3 (30.9 ± 13.0) | |
| Distant metastasis | |||
| Absence | 117 | 5.6 (8.7 ± 8.3) | <0.001 |
| Presence | 14 | 28.0 (30.5 ± 11.5) | |
| Grade | |||
| 1 | 56 | 3.7 (6.9 ± 6.7) |
0.008 0.003 |
| 2 | 66 | 12.5 (12.9 ± 12.4) | |
| 3 + 4 | 13 | 21.1 (18.2 ± 11.5) | |
| Histological type | |||
| Conventional | 110 | 6.4 (10.9 ± 10.8) |
0.863 0.696 |
| Chromophobe | 11 | 6.0 (9.1 ± 9.2) | |
| Papillary | 10 | 9.3 (14.1 ± 14.0) | |
| Type 1 | 7 | 4.3 (12.0 ± 16.8) | 0.210 |
| Type 2 | 3 | 14.1 (16.1 ± 8.8) | |
Correlation with cell proliferation and apoptosis
Fer expression was knocked down using fer‐specific shRNA‐encoding lentiviruses in the ACHN cell line (Fig. 3a). As shown in Figure 3(b), knockdown of Fer expression in ACHN cells inhibited cell proliferation (P < 0.001). Colony‐forming ability was also decreased by knockdown of Fer expression (Fig. 3c,d). In human tissues, median and mean (SD) PI in cancer cells were 5.7% and 7.4% (6.2%), respectively; median and mean (SD) AI were 1.3% and 1.4% (0.8%), respectively. Median and mean (SD) proportions of cleaved caspase‐3‐positive cancer cells were 1.7% and 1.8% (0.9%), respectively. A significant correlation was evident between the proportion of Fer‐positive cancer cells and PI (r = 0.394, P < 0.001; Fig. 4) in human tissues. A significant correlation was also found in conventional RCC (r = 0.406, P < 0.001). In addition, multivariate analysis including pT stage, metastasis, and tumor grade showed that Fer expression was independently and closely associated with cell proliferation (odds ratio, 3.0; 95% CI, 1.2–7.2; P = 0.015). However, neither AI nor the proportion of cleaved caspase‐3‐positive cancer cells correlated with Fer expression (r = −0.29, P = 0.197 and r = −0.14, P = 0.124, respectively).
Figure 3.
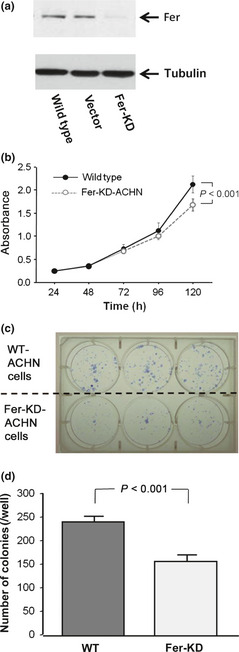
(a) Immunoblotting analysis of feline sarcoma‐related protein (Fer) expression in lentiviral shRNA transduced knockdown (KD) cells relative to untransduced wild‐type (WT) or vector control transduced (VC) ACHN renal cell carcinoma cells. (b) Growth curves of WT‐ and KD‐ACHN cells. Absorbance was measured four times in each cell. (c) Colony numbers were determined by Giemsa staining and only colonies with more than 50 cells were scored. (d) The number of colonies in KD‐ACHN was lower than in WT‐ACHN.
Figure 4.
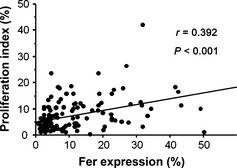
Correlation between feline sarcoma‐related protein (Fer) expression and proliferation index in human tissues. Proliferation index and Fer expression were determined by immunohistochemical staining for Ki‐67 and Fer, respectively.
Clinical significance and survival implications
The proportion of Fer‐positive cancer cells showed positive associations with pT stage, metastasis, and grade (Table 1). With regard to grade, when grade 1 and 2 were combined, the significance of the relationship remained. Kaplan–Meier curves of cause‐specific survival according to Fer expression status are presented in Figure 5. The cut‐off level for Fer expression was determined about the median level of 6.5%, and patients with high Fer expression had worse prognosis compared to those with low expression (P < 0.001). Although 45 patients were treated with immunotherapy after surgery, this factor had no significant effect on survival (P = 0.233). The present study did not include any patients treated with molecular targeted therapy. Furthermore, pathological types were not associated with survival (P = 0.380). Univariate and multivariate Cox proportional hazard analyses revealed Fer expression as a significant, independent predictor of cause‐specific survival among RCC patients (Table 2).
Figure 5.
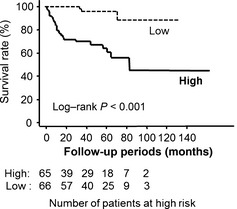
Kaplan–Meier survival curves. Renal cell carcinoma patients with high feline sarcoma‐related protein (Fer) expression showed worse survival compared to those with low Fer expression.
Table 2.
Cox proportional hazard analyses for cause‐specific survival in patients with renal cell carcinoma
| Parameter (n) | Univariate analysis | Multivariate analysis | ||||
|---|---|---|---|---|---|---|
| OR | 95% CI | P‐value | OR | 95% CI | P‐value | |
| pT stage | ||||||
| High (33) | 6.95 | 3.14–15.34 | <0.001 | 1.77 | 0.66–4.75 | 0.257 |
| Lymph node | ||||||
| Metastasis (7) | 10.48 | 5.50–20.91 | <0.001 | 1.68 | 0.43–6.58 | 0.457 |
| Distant | ||||||
| Metastasis (14) | 12.90 | 6.40–23.11 | <0.001 | 3.71 | 1.47–9.37 | 0.006 |
| Grade | ||||||
| High (13) | 8.68 | 3.65–20.59 | <0.001 | 2.58 | 0.83–8.04 | 0.083 |
| Fer expression | ||||||
| Positive (65) | 13.28 | 2.84–31.56 | <0.001 | 3.98 | 1.04–15.25 | 0.044 |
CI, confidence interval; Fer, feline sarcoma‐related protein; OR, odds ratio.
When similar analyses were carried out in patients without distant metastasis (n = 117), Fer expression was recognized as a significant independent predictor of cause‐specific survival by multivariate analysis (HR, 4.81; 95% CI, 1.28–18.05; P = 0.020).
When we carried out similar analyses for patients with conventional RCC alone, Fer expression was also significantly associated with pT stage (P < 0.001), metastasis (P < 0.001), and grade (P < 0.001). In addition, Fer expression offered a significant predictor of survival (log–rank, P < 0.001) and was identified as a significant, independent factor in multivariate analysis (HR, 8.87; 95% CI, 1.03–76.37; P = 0.047).
To clarify the pathological role of Fer for metastasis, the predictive value of Fer expression for postoperative metastasis was analyzed in patients without any identified metastasis at the time of operation (n = 112). Metastasis developed in nine patients (8.0%), seven of whom showed positive expression of Fer. Fer expression was a significant predictor of poor prognosis in univariate analysis (log–rank, P = 0.020), but was not identified as an independent factor in a multivariate analysis model including pT stage and grade (HR, 4.66; 95% CI, 0.86–25.18, P = 0.074).
Discussion
This study indicated a highly significant correlation between Fer expression and tumor progression, grade, and survival in patients with RCC. In a previous report, we showed that Fes was closely associated with proliferation in RCC cell lines.14 In the present study, we also showed that Fer expression showed a positive correlation with cancer cell proliferation. Conversely, no such correlation was found between Fer expression and apoptosis. Fer expression levels have previously been associated with cell proliferation in cultured breast,4 colon,20 and prostate cancer cells,3, 4 and elevated Gleason's scores have been correlated with Fer expression levels in human prostate cancer.5 Downregulation of Fer also correlated with decreased prostate cancer cell proliferation;3, 4, 20 other researchers have reported no significant effects on apoptosis in prostate cancer (PC3) or breast cancer (MDA‐MB‐231) cell lines.4 These observations implicate Fer in tumor promotion at the level of proliferation and metastasis, rather than by affecting the survival of cancer cells.
One of the most important results of the present study is the potential role of Fer expression as a significant independent prognostic biomarker of survival in RCC patients, as shown by multivariate analysis. This is the first study to report the value of Fer expression in predicting cancer survival. In addition, Fer expression was positively associated with pT stage and metastasis. Regulation of cell proliferation has important clinical and pathological implications, although tumor progression and survival are affected by numerous other factors. The correlation between Fer expression and cancer cell proliferation, although statistically significant, was not overly strong, leading us to speculate that the roles of Fer in promoting invasion and metastasis may be more relevant to tumor progression than cancer cell proliferation. In support of this, immunohistochemical staining for Fer in cancer cells was strongest at the invasive front and within invading cancer cells. In addition, such findings were common in tumors with high pT stage compared to those with low pT stage. However, although Fer expression was significantly associated with postoperative incidence of metastasis in univariate analysis, this significance was not independent and significant in a multivariate analysis model including pathological features. Based on these results, further study of the pathological roles of Fer in cancer cell invasion and metastasis is necessary. Examination of the relationships between Fer and other invasion‐related biomarkers was beyond the scope of this study, however, this issue should be pursued in future studies. Various adherens junction‐, cell migration‐, and invasion‐related proteins, including p120 catenin, β‐catenin, E‐cadherin, PTP1B, and cortactin are regulated by Fer.6, 7, 8, 21, 22 These proteins have also been associated with tumor progression in several cancers, including RCC,22, 23, 24, 25, 26 suggesting that some may also be regulated by Fer and could play important roles in determining malignant aggressiveness in RCC.
Targeted disruption of fer in mice with a kinase‐inactivating missense mutation correlated with enhanced inflammatory responses to endotoxin challenge,27, 28 even though these mice were otherwise healthy and fertile.29 This suggests that systemic inhibition of Fer in a clinical setting using pharmacological inhibitors could be well tolerated. Cells from these Fer‐deficient mice showed a number of defects, including reduced migration.29, 30 Given these results, Fer inhibition might provide therapeutic benefits in RCC, and possibly in other malignancies.
Our in vitro study showed that Fer expression was highest in ACHN cells. In addition, although no significant difference was evident, Fer expression tended to be high in papillary RCC of human tissues. From these results, we speculated that Fer could play important roles in papillary RCC. Furthermore, given the results in RCC tissues, similar mechanisms may be present in other histological types. Unfortunately, survival analysis of Fer expression according to types of papillary RCC was not carried out in the present study because the number of patients was too low. It is an important question for further investigation.
In conclusion, we have shown an association between Fer expression and both cancer cell proliferation and tumor development in RCC. Expression of Fer in these patients was also related to malignant aggressiveness, including grade and metastasis. These results offer the first suggestion that Fer expression could be a potentially useful biomarker for prognosis in RCC. The results also suggest Fer as a possible therapeutic target as options develop for the treatment of patients with RCC in the future.
Disclosure Statement
The authors have no conflicts of interest.
Acknowledgments
We are grateful to Mr Takumi Shimogama and Mrs Miho M. Kuninaka for their outstanding support. This study was supported in part by a Grant‐in‐Aid from the Japan Society for the Promotion of Science (to Y.M.) and a grant from the Canadian Institutes of Health Research (to P.A.G.).
(Cancer Sci, doi: 10.1111/cas.12140, 2013)
References
- 1. Greer P. Closing in on the biological functions of FPS/FES and FER. Nat Rev Mol Cell Biol 2002; 3: 278–89. [DOI] [PubMed] [Google Scholar]
- 2. Letwin K, Yee SP, Pawson T. Novel protein‐tyrosine kinase cDNAs related to Fps/Fes and Eph coned using anti‐phosphotyrosine antibody. Oncogene 1998; 3: 621–7. [PubMed] [Google Scholar]
- 3. Allard P, Zoubeidi A, Nguyen LT et al Links between Fer tyrosine kinase expression levels and prostate cell proliferation. Mol Cell Endocrinol 2000; 159: 63–77. [DOI] [PubMed] [Google Scholar]
- 4. Pasder O, Shpungin S, Salem Y et al Downregulation of Fer induces PP1 activation and cell‐cycle arrest in malignant cells. Oncogene 2006; 25: 4149–206. [DOI] [PubMed] [Google Scholar]
- 5. Zoubeidi A, Rocha J, Zouanat FZ et al The Fer tyrosine kinase cooperates with interleuikin‐6 to activate signal transducer and activator of transcription 3 and promote human prostate cancer cell growth. Mol Cancer Res 2009; 7: 142–55. [DOI] [PubMed] [Google Scholar]
- 6. Rosato R, Veltmaat JM, Groffen J, Heisterkamp N. Involvement of the tyrosine kinease fer in cell adhesion. Mol Cell Biol 1998; 18: 5762–70. [DOI] [PMC free article] [PubMed] [Google Scholar]
- 7. Xu G, Craig AWB, Greer P et al Continuous association of cadherin with β‐catenin requires the non‐receptor tyrosine‐kinase Fer. J Cell Sci 2004; 117: 3207–19. [DOI] [PubMed] [Google Scholar]
- 8. Sangrar W, Gao Y, Scott M, Truesdell P, Greer PA. Fer‐mediated cortactin phosphorylation is associated with efficient fibroblast migration and is dependent on reactive oxygen species generation during integrin‐mediated cell adhesion. Mol Cell Biol 2007; 27: 6140–52. [DOI] [PMC free article] [PubMed] [Google Scholar]
- 9. Varkarakis MJ, Bhanalaph T, Moore RH, Murphy GP. Prognostic criteria of renal cell carcinoma. J Surg Oncol 1974; 6: 97–107. [DOI] [PubMed] [Google Scholar]
- 10. Bleumer I, Oosterwijk E, De Mulder P, Mulders PF. Immunotherapy for renal cell carcinoma. Eur Urol 2003; 44: 65–75. [DOI] [PubMed] [Google Scholar]
- 11. Lam JS, Leppert JT, Figlin RA, Belldegrun AS. Surveillance following radical or partial nephrectomy for renal cell carcinoma. Curr Urol Rep 2005; 6: 7–18. [DOI] [PubMed] [Google Scholar]
- 12. Coppin C, Kollmannsberger C, Le L, Porzsolt F, Wilt TJ. Targeted therapy for advanced renal cell cancer (RCC): a Cochrane systematic review of published randomised trials. BJU Int 2011; 108: 1556–63. [DOI] [PubMed] [Google Scholar]
- 13. Tamaskar I, Pili R. Update on novel agents in renal cell carcinoma. Expert Rev Ant 2009; 9: 1817–27. [DOI] [PubMed] [Google Scholar]
- 14. Kanda S, Miyata Y, Kanetake H, Smithgall TE. Downregulation of the c‐Fes protein‐tyrosine kinase inhibits the proliferation of human renal carcinoma cells. Int J Oncol 2009; 34: 89–96. [PMC free article] [PubMed] [Google Scholar]
- 15. Shapovalova Z, Tabunshchyk K, Greer PA. The Fer tyrosine kinase regulates an axon retraction response to Semaphorin 3A in dorsal root ganglion neurons. BMC Dev Biol 2007; 30: 133. [DOI] [PMC free article] [PubMed] [Google Scholar]
- 16. Fuhrman SA, Lasky LC, Limas C. Prognostic significance of morphologic parameters in renal cell carcinoma. Am J Surg Pathol 1982; 6: 655–63. [DOI] [PubMed] [Google Scholar]
- 17. Miyata Y, Koga S, Kanda S, Nishikido M, Hayashi T, Kanetake H. Expression of cyclooxygenase‐2 in renal cell carcinoma: correlation with tumor cell proliferation, apoptosis, angiogenesis, expression of matrix metalloproteinase‐2, and survival. Clin Cancer Res 2003; 9: 1741–9. [PubMed] [Google Scholar]
- 18. Ohba K, Miyata Y, Watanabe S et al Clinical significance and predictive value of prostaglandin E2 receptors (EPR) 1 ‐ 4 in patients with renal cell carcinoma. Anticancer Res 2011; 31: 597–605. [PubMed] [Google Scholar]
- 19. Watanabe S, Miyata Y, Kanda S et al Expression of X‐linked inhibitor of apoptosis protein in human prostate cancer specimens with and without neo‐adjuvant hormonal therapy. J Cancer Res Clin Oncol 2010; 136: 787–93. [DOI] [PMC free article] [PubMed] [Google Scholar]
- 20. Orlovsky K, Theodor L, Malovani H, Chowers Y, Nir U. Gamma interferon down‐regulates Fer and induces its association with inactive Stat3 in colon carcinoma cells. Oncogene 2002; 21: 4997–5001. [DOI] [PubMed] [Google Scholar]
- 21. Kowalski JR, Egile C, Gil S, Snapper SB, Li R, Thomas SM. Cortactin regulates cell migration through activation of N‐WASP. J Cell Sci 2005; 118: 79–87. [DOI] [PubMed] [Google Scholar]
- 22. Yamada S, Yanamoto S, Kawasaki G, Mizuno A, Nemoto TK. Overexpression of cortactin increases invasion potential in oral squamous cell carcinoma. Pathol Oncol Res 2010; 16: 523–31. [DOI] [PubMed] [Google Scholar]
- 23. Luo ML, Shen XM, Zhang Y et al Amplification and over expression of CTTN (EMS1) contribute to the metastasis of esophageal squamous cell carcinoma by promote cell migration and anoikis resistance. Cancer Res 2006; 66: 11690–9. [DOI] [PubMed] [Google Scholar]
- 24. Weaver AM. Cortactin in tumor invasiveness. Cancer Lett 2008; 265: 157–66. [DOI] [PMC free article] [PubMed] [Google Scholar]
- 25. Aaltomaa S, Lipponen P, Kärjä V, Lundstedt S, Lappi J, Kosma VM. The expression and prognostic values of α‐, β‐, γ‐catenins in renal cell carcinoma. Anticancer Res 2004; 24: 2407–14. [PubMed] [Google Scholar]
- 26. Gervais ML, Henry PC, Saravanan A et al Nuclear E‐cadherin and VHL immunoreactivity are prognostic indicators of clear‐cell renal cell carcinoma. Lab Invest 2007; 87: 1252–64. [DOI] [PubMed] [Google Scholar]
- 27. McCafferty DM, Craig AW, Senis YA, Greer PA. Absence of Fer protein‐tyrosine kinase exacerbates leukocyte recruitment in response to endotoxin. J Immunol 2002; 168: 4930–5. [DOI] [PubMed] [Google Scholar]
- 28. Qi W, Ebbert KV, Craig AW, Greer PA, McCafferty DM. Absence of Fer protein tyrosine kinase exacerbates endotoxin induced intestinal epithelial barrier dysfunction in vivo. Gut 2005; 54: 1091–7. [DOI] [PMC free article] [PubMed] [Google Scholar]
- 29. Craig AW, Zirngibl R, Williams K, Cole LA, Greer PA. Mice devoid of fer protein‐tyrosine kinase activity are viable and fertile but display reduced cortactin phosphorylation. Mol Cell Biol 2001; 21: 603–13. [DOI] [PMC free article] [PubMed] [Google Scholar]
- 30. Craig AW, Greer PA. Fer kinase is required for sustained p38 kinase activation and maximal chemotaxis of activated mast cells. Mol Cell Biol 2002; 22: 6363–74. [DOI] [PMC free article] [PubMed] [Google Scholar]